Sales of kvass in Russia and Commonwealth of Independent States countries are estimated at USD 400 million in 2025, with projections indicating a rise to USD 650 million by 2035, reflecting a CAGR of approximately 5.0% over the forecast period.
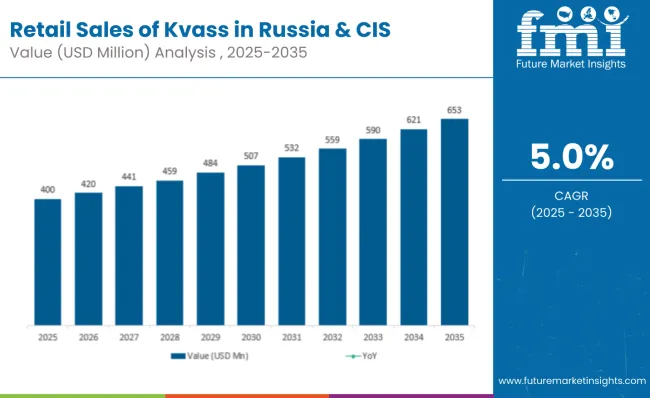
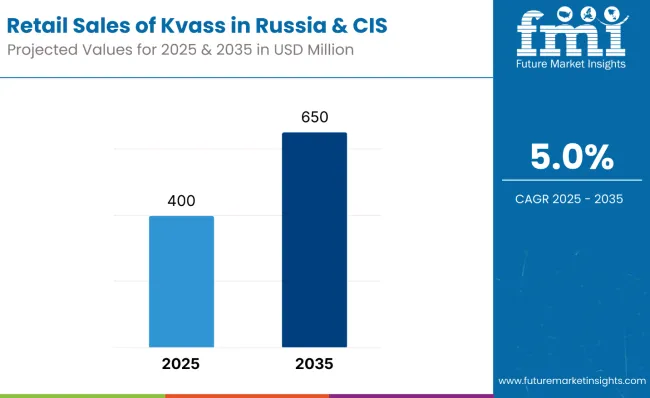
This growth reflects both cultural revival of traditional beverages and expanding consumer base across younger demographic segments. The rise in demand is linked to growing health consciousness, nostalgic consumption patterns, and increased availability across modern retail channels.
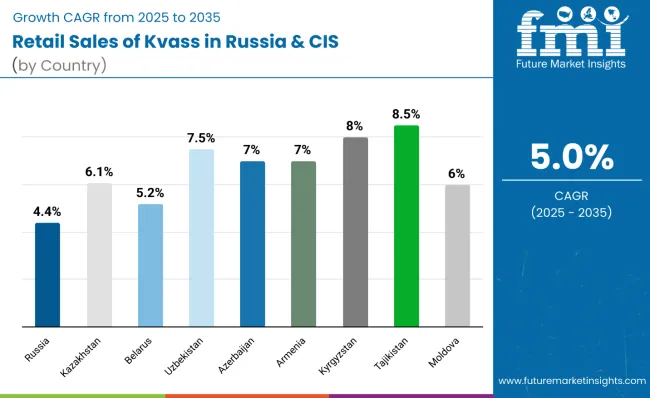
Russia leads regional consumption, expected to generate USD 431 million in kvass sales by 2035, representing 66% of total regional sales, though declining from 70% share in 2025 as other CIS countries accelerate adoption. Kazakhstan follows as the second-largest market at USD 73 million by 2035, while Central Asian countries including Uzbekistan, Kyrgyzstan, and Tajikistan demonstrate the strongest growth rates ranging from 7.5% to 8.5% CAGR.
The largest contribution to demand continues to come from traditional bread kvass, which is expected to account for 45% of total sales by 2035, down from 48% in 2025 as flavored varieties gain momentum. By distribution channel, supermarkets and hypermarkets represent the dominant retail format, responsible for 50% of all sales in 2035, while online channels expand rapidly from 8% to 13% share.
Consumer adoption spans traditional Russian families maintaining cultural beverage preferences, health-conscious millennials seeking probiotic benefits, and urban professionals exploring craft and premium variants. Regional preferences vary significantly, with Russian consumers favoring traditional bread-based formulations while Central Asian countries show stronger demand for flavored and sweetened varieties.
The kvass segment in Russia and CIS countries is classified across several categories. By product type, key varieties include traditional bread kvass, flavored kvass, craft and premium variants, and low or no-sugar options. By packaging format, the segment spans PET bottles, draft and dispensed on-premise retail, cans, and glass bottles.
By distribution channel, sales occur through supermarkets and hypermarkets, discounters, convenience stores and kiosks, traditional markets, and online direct channels. By geography, coverage includes Russia, Kazakhstan, Belarus, Uzbekistan, Azerbaijan, Armenia, Kyrgyzstan, Tajikistan, Moldova, and other CIS associated countries.
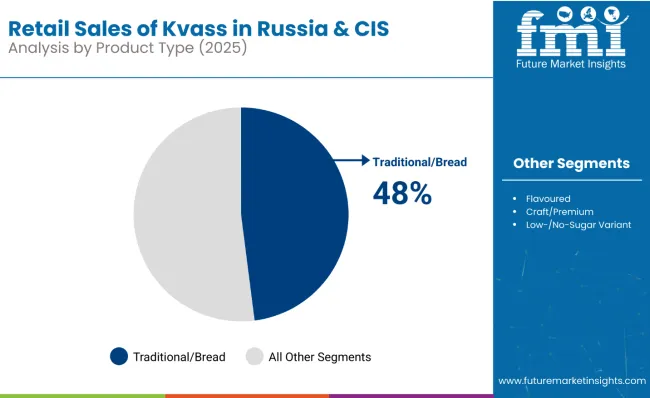
Traditional bread kvass is projected to maintain category leadership through 2035, though facing gradual share erosion as consumers explore flavored alternatives. The category benefits from cultural authenticity, perceived health benefits, and strong brand heritage across the region.
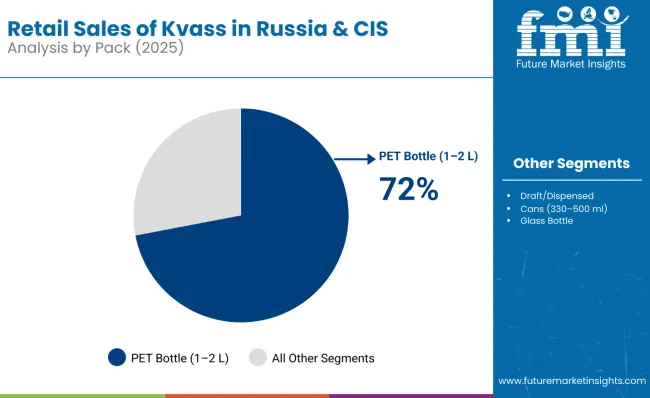
Kvass in Russia and CIS countries is available across multiple packaging formats, with PET bottles maintaining format leadership while facing competition from convenience-oriented alternatives. Format preferences reflect both household consumption patterns and on-the-go usage occasions.
Kvass in Russia and CIS countries is distributed through diverse retail channels, with supermarkets and hypermarkets maintaining channel leadership while online platforms expand rapidly. Distribution strategies reflect both traditional shopping patterns and evolving consumer convenience expectations.
Regional demand for kvass varies significantly across CIS countries, with Russia maintaining overwhelming dominance while Central Asian countries demonstrate the strongest growth trajectories. Economic development, cultural affinity, and retail modernization drive regional performance differences.
Russia represents the largest regional segment, growing from USD 287 million (70% share) in 2025 to USD 431 million (66% share) by 2035, reflecting a CAGR of 4.40%. This performance is supported by deep cultural connection to kvass consumption, extensive retail distribution, and strong domestic production capabilities, though share decline reflects faster growth in other CIS countries.
Kazakhstan follows as the second-largest segment, expanding from USD 40 million (10% share) to USD 73 million (11% share) by 2035, achieving a CAGR of 6.10%. The country benefits from growing urban population, increasing disposable income, and cultural familiarity with kvass consumption patterns inherited from Soviet traditions.
Belarus maintains USD 30 million in 2025, growing to USD 50 million by 2035 (maintaining 7-8% share) with a CAGR of 5.20%, supported by strong cultural ties to traditional kvass consumption and established domestic production serving both local and export needs.
Uzbekistan demonstrates strong acceleration from USD 20 million to USD 40 million with a 7.50% CAGR, reflecting economic development, population growth, and increasing availability through modern retail channels in Tashkent and other major cities.
Central Asian countries including Kyrgyzstan (8.0% CAGR) and Tajikistan (8.5% CAGR) show the strongest growth rates despite small absolute values, driven by economic development, urbanization, and cultural revival of traditional fermented beverages.
Regional concentration remains significant, with the top five countries (Russia, Kazakhstan, Belarus, Uzbekistan, Azerbaijan) accounting for 95% of sales in 2025, maintaining 95% share by 2035. This concentration reflects historical cultural connections, established production capabilities, and economic development levels across the region.
The regional data reveals clear performance tiers, with Russia maintaining dominance despite share erosion, Kazakhstan consolidating its position as second-largest segment, and Central Asian countries demonstrating the strongest growth potential from smaller bases.
Product preferences demonstrate gradual diversification, with traditional bread kvass maintaining leadership while flavored varieties capture growing consumer interest. The expansion of craft and premium segments from 8% to 10% share represents significant premiumization, reflecting urban consumer willingness to pay for authentic, artisanal production methods.
The stability of low-sugar variants at 7-8% share indicates moderate health consciousness without abandoning traditional taste expectations, while the growth of flavored options reflects successful adaptation of traditional beverage to contemporary flavor preferences.
Format evolution reflects changing consumption patterns, with large PET bottles maintaining household dominance while smaller, convenient formats gain ground. The growth of draft and dispensed options from 14% to 16% indicates consumer appreciation for authentic preparation methods and fresh consumption experience.
Can format expansion from 7% to 10% demonstrates successful adaptation to urban, on-the-go consumption patterns, while glass bottle stability reflects premium positioning and quality perception among discerning consumers.
Channel evolution reflects broader retail modernization across CIS countries, with traditional supermarkets maintaining leadership while online channels capture significant growth. The expansion of online sales from 8% to 13% indicates increasing consumer comfort with beverage e-commerce, supported by improved cold chain logistics.
The decline in traditional markets from 10% to 9% reflects gradual modernization of retail infrastructure, though these channels maintain cultural importance and authenticity appeal for traditional consumer segments.
Kvass consumption serves multiple cultural and functional roles across CIS countries, from traditional family beverages to health-focused probiotic consumption. Urban professionals drive weekday consumption through convenience channels, while families rely on large format purchases for household consumption and cultural celebration preparation.
Regional taste preferences influence product success, with Russian consumers maintaining preference for traditional bread-based formulations, while Central Asian countries show greater openness to fruit flavors and sweeter profiles adapted to local taste preferences.
Traditional cultural associations with kvass as a healthy, refreshing alternative to western soft drinks support continued consumption growth, particularly among consumers seeking authentic regional alternatives to global beverage brands.
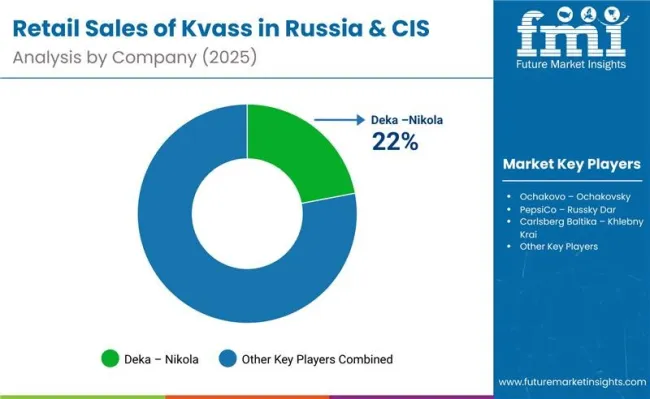
Kvass makers in Russia and the wider CIS have two imperatives: defend a centuries-old staple from soda and energy-drink encroachment, and monetise its “fermented-health” halo without alienating price-sensitive legacy shoppers. The big players are doubling down on PET multi-packs and draft-keg installs to lock up shelf and tap space, all while slimming sugar to stay ahead of looming tax hikes.
They’re launching flavoured and “live culture” extensions to chase the kombucha crowd, but the red-pill truth is that margins still depend on ruthless logistics owning cold-chain and regional distributors to flood kiosks and convenience stores during the May-to-August heat spike. Export ambitions target diaspora hubs in Germany, Israel, and the USA, yet sanctions, currency volatility, and short shelf-life make this a tightrope walk. Expect consolidation around brands that can straddle nostalgia marketing (“old-world rye brew”) with functional-beverage positioning and aggressive cost control on malt and PET resin.
| Attribute | Details |
|---|---|
| Study Coverage | Russia and CIS countries sales and consumption of kvass from 2025 to 2035 |
| Base Year | 2025 |
| Forecast Period | 2025 to 2035 |
| Units of Measurement | USD (sales), Percentage shares, CAGR |
| Geography Covered | 10 CIS countries with detailed analysis of top 5 countries |
| Top Countries Analyzed | Russia, Kazakhstan, Belarus, Uzbekistan, Azerbaijan |
| By Product Type | Traditional bread kvass, Flavored kvass, Craft/premium, Low/no-sugar |
| By Packaging Format | PET bottles, Draft/dispensed, Cans, Glass bottles |
| By Distribution Channel | Supermarkets/hypermarkets, Discounters, Convenience/kiosks, Traditional markets, Online |
| Metrics Provided | Sales (USD), Share by segment, CAGR (2025 to 2035), YoY growth |
| Competitive Landscape | Regional production, cultural positioning, modern retail expansion |
| Forecast Drivers | Cultural revival, health consciousness, retail modernization, economic development |
By 2035, total Russia and CIS sales of kvass are projected to reach USD 650 million, up from USD 400 million in 2025, reflecting a CAGR of 5.0%.
Traditional bread kvass holds the leading share, accounting for 48% of total sales in 2025, followed by flavored kvass (38%) and craft/premium variants (10%).
Tajikistan leads in projected growth with a CAGR of 8.5%, followed by Kyrgyzstan at 8.0% and Uzbekistan at 7.5%, all significantly outpacing Russia's 4.4% growth.
Supermarkets and hypermarkets dominate with 50% share by 2035, while online channels show rapid expansion from 8% to 13% share over the forecast period.
PET bottles in 1-2 liter sizes lead with 66% share by 2035, while draft/dispensed formats (16%) and cans (10%) serve different consumption occasions and consumer preferences.


Our Research Products

The "Full Research Suite" delivers actionable market intel, deep dives on markets or technologies, so clients act faster, cut risk, and unlock growth.

The Leaderboard benchmarks and ranks top vendors, classifying them as Established Leaders, Leading Challengers, or Disruptors & Challengers.

Locates where complements amplify value and substitutes erode it, forecasting net impact by horizon

We deliver granular, decision-grade intel: market sizing, 5-year forecasts, pricing, adoption, usage, revenue, and operational KPIs—plus competitor tracking, regulation, and value chains—across 60 countries broadly.

Spot the shifts before they hit your P&L. We track inflection points, adoption curves, pricing moves, and ecosystem plays to show where demand is heading, why it is changing, and what to do next across high-growth markets and disruptive tech

Real-time reads of user behavior. We track shifting priorities, perceptions of today’s and next-gen services, and provider experience, then pace how fast tech moves from trial to adoption, blending buyer, consumer, and channel inputs with social signals (#WhySwitch, #UX).

Partner with our analyst team to build a custom report designed around your business priorities. From analysing market trends to assessing competitors or crafting bespoke datasets, we tailor insights to your needs.
Supplier Intelligence
Discovery & Profiling
Capacity & Footprint
Performance & Risk
Compliance & Governance
Commercial Readiness
Who Supplies Whom
Scorecards & Shortlists
Playbooks & Docs
Category Intelligence
Definition & Scope
Demand & Use Cases
Cost Drivers
Market Structure
Supply Chain Map
Trade & Policy
Operating Norms
Deliverables
Buyer Intelligence
Account Basics
Spend & Scope
Procurement Model
Vendor Requirements
Terms & Policies
Entry Strategy
Pain Points & Triggers
Outputs
Pricing Analysis
Benchmarks
Trends
Should-Cost
Indexation
Landed Cost
Commercial Terms
Deliverables
Brand Analysis
Positioning & Value Prop
Share & Presence
Customer Evidence
Go-to-Market
Digital & Reputation
Compliance & Trust
KPIs & Gaps
Outputs
Full Research Suite comprises of:
Market outlook & trends analysis
Interviews & case studies
Strategic recommendations
Vendor profiles & capabilities analysis
5-year forecasts
8 regions and 60+ country-level data splits
Market segment data splits
12 months of continuous data updates
DELIVERED AS:
PDF EXCEL ONLINE
Retail Paper Bag Market Size and Share Forecast Outlook 2025 to 2035
Retail Automation Market Size and Share Forecast Outlook 2025 to 2035
Retail Logistics Market Size and Share Forecast Outlook 2025 to 2035
Retail Displays Market Size and Share Forecast Outlook 2025 to 2035
Retail Colocation Market Size and Share Forecast Outlook 2025 to 2035
Retail Warehouse Management Systems Market Size and Share Forecast Outlook 2025 to 2035
Retail Analytics Market Analysis by Solution, Function, Enterprise Size, Deployment Model, Field Crowdsourcing, and Region Through 2035
Examining Market Share Trends in the Retail Paper Bag Industry
Retail Signage Market
Retail Digital Signage Market
India Retail Mineral Turpentine Oil Market Growth – Trends & Forecast 2024-2034
Retail Clinics Market Analysis – Size, Share, and Forecast Outlook 2025 to 2035
Retail Printers Market Growth - Trends & Forecast 2025 to 2035
Retail Printers and Consumables Market Growth - Trends & Forecast 2025 to 2035
Retail Vending Machine Market Analysis - Size, Share, and Forecast 2025 to 2035
Market Share Distribution Among Retail Vending Machine Suppliers
Retail Sourcing And Procurement Market Size and Share Forecast Outlook 2025 to 2035
Europe Retail Paper Bag Market Trends – Growth & Forecast 2023-2033
Retail Glass Packaging Market Size and Share Forecast Outlook 2025 to 2035
Market Share Distribution Among Retail Glass Packaging Companies

Thank you!
You will receive an email from our Business Development Manager. Please be sure to check your SPAM/JUNK folder too.
Chat With
MaRIA