Retail Automation Market
Market Insights on Retail Automation covering sales outlook, demand forecast & up-to-date key trends
Retail Automation Market By Product Type (Manned POS Terminal, Unattended Terminals), Market (Organized Market, Unorganized Market), Industry (FMCG, Health and Personal Care, Apparel and footwear, Hospitality, Consumer Electronics, Travel and Logistics, Oil & Gas) & Region - Forecast to 2021 - 2031
Retail Automation Market - About the Report
[346 Pages Report] The demand for retail automation is estimated to increase over time owing to several advantages it offers such as low cost, accuracy, speed and high-quality performance. The implementation of automated technologies in retail industry is one of the major factor driving the market growth.
Retail automation is touted as the future of commerce by many. The system has been designed to automate various manual processes including book-keeping, inventory management, and accounting within the retail sector. The focus on improved customer services is expected to drive the retail automation market.
Future Market Insight’s new study covers comprehensive insights about the market trends, value (US$ Bn) projections, recent developments, and dynamics in the global retail automation market for the forecast period of 2021-2031.
The report tracks the global value of retail automation in 20+ high-growth markets, with the regions of North America, Europe, and Asia offering the most opportunities to stakeholders. The report also analyzes the impact COVID-19 has had on the economy in general, and retail automation in particular.
Let us know your requirement to get
100% FREE customization
How the Historical & Future Projections for Retail Automation Market Compare?
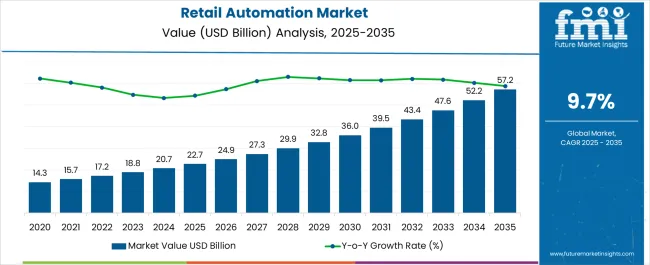
From 2016 to 2020, the market registered a CAGR of 9.6%. Surge in adoption of Artificial Intelligence and deep learning technologies across various applications within the retail sector is likely to drive the market over the coming years.
The global retail industry is evolving thanks to extraordinary changes. In an era of growing mobility, consumers are looking for easy and reliable access to products and services from anywhere and anytime. Automation can control the inventory flow of a supermarket, a mall, a departmental store, or a retail store. Thus, retailers are looking for advanced systems in order to address the needs such as quick processing, result accuracy and cost reduction.
Retail automation is the turn key solution to these requirements as it provides point of sale terminals and interactive kiosks which include all the essential software, hardware, and related services. The POS terminals including cash registers, receipt printer, and barcode scanners, are majorly contributing to the retail automation market growth. Moreover, retail automation is seen as a trending technology in developed economies such as Germany, the U.S., China, and so on. Overall, the global market for retail automation is projected to fare even better over the coming years, expanding at an impressive CAGR of over 11.5% through 2031.
How is Integration of Cloud-based PoS Contributing to Retail Automation?
Point-of-Sale (POS) systems are where a product/service is handed from seller to buyer. POS systems are generally used by retailers to complete sales transactions. Most of the businesses demands to access their sales data quickly from any place or time, on any device, which is why the retail industry is witnessing rising adoption of cloud-based POS system.
It makes the work easier for retailers and is expected to change the landscape of the retail POS industry in the future.
According to Forbes, maximum number of new retailers are opting for cloud-based POS instead of traditional POS, while a significant number of the existing retailers consider switching to cloud-based POS. It is estimated that the market may witness a considerable surge in cloud-based POS deployment by 2021. As a result, the retail automation market is projected to experience a noteworthy growth over the forecast period.
Find your sweet spots for generating winning opportunities in this market.
Talk to AnalystMobile Payment and e-Wallet Propelling Retail Automation
With the rising number of smartphone users each year, customers are becoming habitual of e-wallets to store debit/credit cards and even loyalty cards. Whilst digital payments enable easier and faster checkout. It also enables customers to track their spending budget and transactions. Integration of digital payment helps retailers in easy transactions, improved customer service, and secure payments solutions.
In addition, businesses could also save money as e-wallet offers lower interest rate of 1-2% unlike that of credit cards (2-3%). This further adds momentum to market growth and creates productive opportunities for retail automation providers.
E-wallet and mobile payment are becoming a major trend, driving towards a cashless future. By installing a POS system with digital payments access, retailers can enhance their customer service while retaining their competitive positions. This rising demand across various verticals is expected to create growth opportunity for manufacturers of retail automation systems.
What are Key Challenges Posing Threat to Retail Automation?
Retailers deal with numerous operations every day. In order to manage them effectively and align them with business goals, departmental integration is a major requirement that cannot be overlooked. Some of the major challenges faced by the retailers are inappropriate storage layout, flawed in-store product mix, inefficient warehouse space utilization, frequent price changes, quick shift in customer's demands, and lack of control over channel partners among others.
Moreover, commercial companies are confronted with challenging requirements in the fields of e-commerce and retail and the associated logistics such as, same-day delivery, click-and-collect or simple returns processing. Therefore, it is expected that those companies with top logistics stand out from the competition and can prevail on the market in the long term.

An unified Market Research Subscription Platform, built for today’s disparate research needs.
How has COVID-19 Created Opportunities for Retail Automation Vendors?
The COVID-19 pandemic has mandated all retail businesses adhere to precautionary measures, leading to the closure of several outlets. Due to this, leading luxury brands and retailers have been facing short-term challenges such as health and safety concerns, sustained revenues, labor shortages, reduced pricing, supply chain management, and so on.
Moreover, with governments enforcing worldwide quarantines to control transmission of COVID-19, forcing people to stay back at home, has led to bulk-buying of goods and increased online shopping, resulting in a great supply chain stress. Hence, such supply chain players among retailers have been looking to deploy smart analytics and AI to ensure resilience.
From a retailer’s perspective, COVID-19 accelerated investments in automation to gain operational efficiency and reduce labor costs. The use of deep learning and robotics offers cost-friendly and speedy benefits as compared to manually picking items off store shelves, especially now as the COVID-19 pandemic has triggered big rise in demand for online shopping and grocery retailers want to keep their workers protected while timely addressing customer’s ongoing need.
Retail Automation Market Country-wise Analysis
What is Driving Retail Automation Demand in the U.S.?
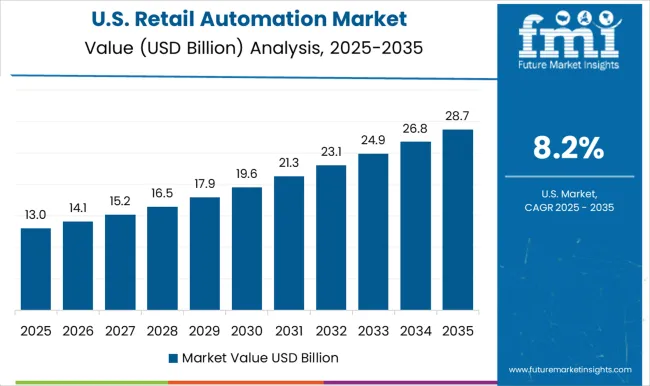
Until 2020, retail automation sales across the United States noted a Y-o-Y growth of over 8.5% to reach close to US$ 4,310.3 Bn. The market is set to further magnify at a CAGR of nearly 9.9% through 2031. The retail automation market in the United States is expected to be driven by the growing adoption of automation technologies by major players, such as Walmart and Amazon.
Part of the adoption is also attributable to changing consumer preferences. Major retailers in the region have adhered to complaints such as ‘slow checkout speeds’ and ‘long lines’, and adapted to the quick and secure checkout process.
Moreover, the United States is viewed as a productive market for retail automation systems, owing to which, various manufacturers are moving in the country in order to capture a large set of customers, hence, allowing them to achieve economies of scale.
Why is India Considered an Attractive Retail Automation Landscape?
As international brands make their entry into the India market and along with changes in regulations like GST, it has become increasingly important for domestic retailers to acknowledge the importance of having robust automation infrastructure and the efficiencies it can bring.
Emerging technologies are providing various solutions from the loading dock to the checkout line to give operational efficiency. In addition, mobile checkout devices have made it possible to sell merchandise in any location, be it a pop up shop, an event, or a kiosk. Thus, the Indian retail industry is on the verge of evolving in terms of adopting new technologies in automation.
How is Japan Contributing towards the Growth of Retail Automation Market?
Japan has always been at the forefront when it comes to deploying robotics and automation in everyday life. Thus, robots have become an integral part of sectors such as restaurants, hotels, and local retail stores.
Japan is a unique economy that primarily relies on convenience stores, which are called “konbini”. According to the Japan Franchise Association, there were 55,743 convenience stores as of December 2018, and the number has been increasing steadily since 1970s. However, due to major shrink in population count in the country over the years, the Japanese government is dealing with the labor force crisis that would majorly affect the retail sector.
As a result, the Ministry of Economy, Trade and Industry (METI) launched a project to promote automation in retail industry with Radio-Frequency Identification (RFID) technology.
Moreover, it is estimated that in coming years, automation will be critical for retailers who are looking to scale up their operations in an optimized manner. This has significantly increased demand for retail automation systems within the country.
Retail Automation Scenario in Brazil
Enterprises in Brazil are seeking application developers that use machine learning and other automation tools to identify and predict problems in application development. Many businesses in Brazil are focusing on agile development methods for new projects and application modernization for legacy applications. With the increasing middle class population, and diverse retail ecosystem like Brazil’s huge market, offer rewarding opportunities.
Although, Brazil may have few political and economic challenges like that of high fiscal deficits, yet the market outlook still remains confident. Moreover, rising competition between the local and international players is estimated to provide further impetus to the growth in the retail automation market in Brazil.
Growth Opportunities for South Africa Retail Automation Market
The retail industry in South Africa has witnessed significant technological advancements over the last few years. With millions of internet users in Africa, the expectation is that e-commerce will grow tremendously. In South Africa, where e-commerce platforms like Takealot are doing really well, average e-commerce spend is only USD 109.
Most of the ecommerce sites in Africa are marketplaces that invite third party sellers. While there are obstacles, but there are also opportunities for retailers, especially during the global pandemic. During the COVID-19 pandemic, South Africa has seen a rise in e-commerce platforms, which is thus, likely to create profitable growth opportunities for the retail automation market players over the forecast period.
Retail Automation Market Category-wise Insights
Why is there Huge Demand for Retail Automation Hardware?
Hardware components have dominated and accounted for a market share of 44.2% in 2020. Based on hardware, the point-of-sale (POS) segment held the maximum share in the market in 2020 and is likely to remain dominant over the forecast period.
Increasing R&D investment in advanced POS systems such as contactless payment options and RFID transponders is projected to drive growth over the forecast period. Furthermore, biometric-based POS systems creates a simplified process for personalized payment options to the end-user. This in turn is expected to upsurge the growth of the segment.
Cloud-based Retail Automation Solutions to hold a Major Share
The cloud segment is expected to record the highest CAGR during the forecast period, among all the deployment. The segment is estimated to register a CAGR of 13.3%. This is due to the rising demand for remote management which is one of the key factors driving the retail automation market.
Automating the retail stores enables operators to send and receive real-time notifications via the cloud, thus decreasing maintenance cost associated with regular check-ups. The connected machines can communicate when they are running low on product and facilitate dynamic route optimization and other logistic efficiencies for automatic restocking of the goods.
How Automated Supermarkets are shaping Retail Automation Market?
Over the past couple of years, the futuristic “connected supermarket” concept has started to unfold, which was commenced in late 2016 by Amazon Go, a connected grocery store with no checkouts.
Using deep learning, computer vision, sensor fusion, and more, customers can walk into an Amazon Go outlet and automatically “check out” simply by picking items off the shelf. It is clear that robotics will play a significant role in supermarkets - both on the floor and behind the scenes. This is expected to further fuel the demand for retail automation solutions in this segment.
Retail Automation Market Competition Landscape
Companies operating in the market rely on various expansion strategies to make their presence felt across lucrative markets. These strategies include collaboration with key players, product launches, acquisitions, partnerships, and enhancement of distribution networks at regional and global levels.
- In January 2021, NCR Corporation announced the acquisition of grocery e-commerce leader Freshop. Adding e-commerce to NCR’s leading retail core POS platform will give retailers, particularly small and regional grocery chains, the ability to quickly deploy the capabilities to directly serve their customers’ needs.
- In December 2020, Posiflex Technology, Inc. launched a new series of PoS systems, The HS-3314A series is a 14" Android 9.0 PCAP touch POS system designed with the high-performance Rockchip RK3399 platform and a built-in printer along with various peripherals. HS-3314A is equipped with a high-speed, detachable thermal receipt printer, built with unique innovation and a compact body.
Future Market Insights has profiled the following prominent retail automation providers in its report:
- Datalogic S.p.A
- NCR Corporation
- Honeywell International Inc.
- KUKA AG
- Zebra Technologies Corporation
- Fujitsu Limited
- Samsung Electronics Co. Ltd.
- Posiflex Technology, Inc.
- Tecsys Inc.
- Optimove Inc.
- Capillary Technologies
- Focus Softnet FZ LLC
- Future Way Technical Services LLC
- QR Retail Automation (Asia) Sdn Bhd
- Microlistics
- First Data Corporation
- E&K Automation GmbH
- Napse
- Vinculum Solutions Pvt. Ltd.
- Infoplus
Retail Automation Market Report Scope
Attribute |
Details |
Forecast Period |
2021-2031 |
Historical Data Available for |
2016-2020 |
Market Analysis |
US$ Mn for Value |
Key Regions Covered |
North America, Latin America, Europe, East Asia, South Asia & Pacific, and Middle East & Africa |
Key Countries Covered |
U.S., India, Canada, Germany, China, Italy, France, U.K., Spain, GCC and South Africa |
Key Segments Covered |
Component, Deployment, End User, and Region |
Key Companies Profiled |
|
Customization & Pricing |
Key Segments Covered
Product Type :
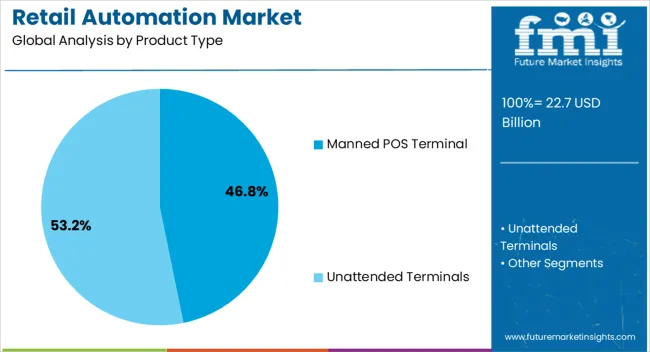
- Manned POS Terminal
- Fixed POS Terminal
- Mobile POS Terminal
- Contactless POS Terminal
- Unattended Terminals
- Kiosk / Vending Machine
- Self-Checkout System
Market :
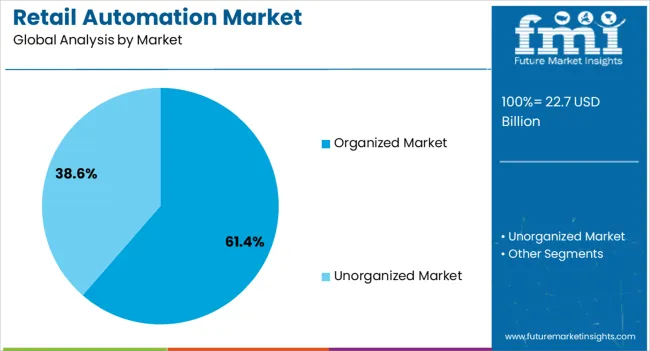
- Organized Market
- Unorganized Market
Industry :
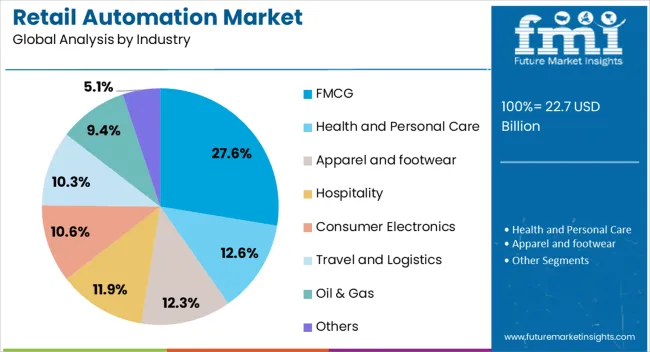
- FMCG
- Health and Personal Care
- Apparel and footwear
- Hospitality
- Consumer Electronics
- Travel and Logistics
- Oil & Gas
- Others
Key Regions covered :
- North America Retail Automation market
- U.S.
- Canada
- Latin America Retail Automation market
- Brazil
- Mexico
- Rest of Latin America
- Western Europe Retail Automation market
- Germany
- France
- U.K.
- Spain
- Italy
- Benelux
- Nordic
- Rest of Western Europe
- Eastern Europe Retail Automation market
- Russia
- Poland
- Rest of Eastern Europe
- APEJ Retail Automation market
- China
- India
- Australia & New Zealand
- ASEAN
- Rest of APAC
- Japan Retail Automation market
- MEA Retail Automation Market
- GCC Countries
- Turkey
- South Africa
- North Africa
- Rest of MEA
Frequently Asked Questions
Future Market Insights projects the market to register a CAGR of over 11.5% over the assessment period, starting from 2021 to 2031. The consistent growth of self-service machines such as kiosk, and the self-checkout system is expected to increase the overall growth of retail automation market.
In recent years, demand for retail automation has been increasing owing to features such as reduced cost to retailers, high speed of transactions, and accuracy in transactions, thus positively impacting the market.
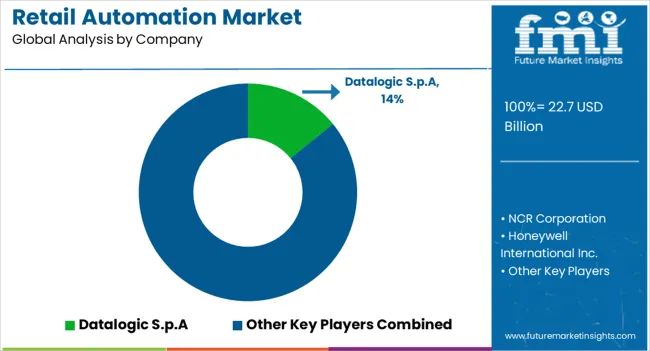
Prominent players providing retail automation systems and services include Datalogic S.p.A, Zebra Technologies Corporation, Honeywell International Inc., NCR Corporation, among others.
Supermarkets have emerged as the leading end users of the technology. The focus on improving customer services has resulted in higher update of retail automation across supermarkets.
Table of Content
1. Executive Summary
1.1. Global Market Outlook
1.2. Demand Side Trends
1.3. Supply Side Trends
1.4. Analysis and Recommendations
2. Market Overview
2.1. Market Coverage / Taxonomy
2.2. Market Definition / Scope / Limitations
3. Key Market Trends
3.1. Key Trends Impacting the WMS Market
3.2. Innovation / Development Trends
3.3. Key Success Factors
4. Global Retail Automation Market - Pricing Analysis
4.1. WMS Component, Pricing Models
4.1.1. Hardware Devices, Unit Price Analysis
4.1.2. Software Pricing Models
4.1.2.1. Subscription-based Pricing ( Per User/Month)
4.1.2.2. Perpetual License (One Time License Fee)
4.2. Global Average Pricing Analysis Benchmark
5. Impact Analysis of Pandemic Crisis & Economic Slowdown
5.1. Impact of crisis (such as SAARs/ 2008 Recession/COVID-19) on Supply Chain Management, Warehousing & Logistics
5.2. Current Economic Projection and Probable Impact on GDP
5.3. Future Market Impact Trends
5.4. Recovery Scenario (Short Term/Mid Term/Long Term Impact on WMS System Market)
5.5. Other Key Trends
6. Market Structure Analysis
6.1. Market Analysis by Tier of Companies
6.2. Market Concentration
6.3. Market Share Analysis of Top Players
6.3.1. WMS Hardware Vendors
6.3.2. WMS Software Vendors
6.4. Market Presence Analysis
6.4.1. Regional footprint by Players
6.4.2. Product footprint by Players
6.4.3. Channel footprint by Players
7. Global Retail Automation Market Demand (in Volume in ‘000 Units) Analysis 2016-2020 and Forecast, 2021-2031
7.1. Historical Market Volume (‘000 Units) Analysis, 2016-2020
7.2. Current and Future Market Volume (‘000 Units) Projections, 2021-2031
7.2.1. Y-o-Y Growth Trend Analysis
8. Global Retail Automation Market Demand (in Value in US$ Mn) Analysis 2016-2020 and Forecast, 2021-2031
8.1. Historical Market Value (US$ Mn) Analysis, 2016-2020
8.2. Current and Future Market Value (US$ Mn) Projections, 2021-2031
8.2.1. Y-o-Y Growth Trend Analysis
8.2.2. Absolute $ Opportunity Analysis
9. Market Background
9.1. Macro-Economic Factors
9.1.1. Global GDP Growth Outlook
9.1.2. Global ICT Spending Outlook
9.1.3. Impact of Pandemic Crises (SAARs/COVID-19)
9.2. Forecast Factors - Relevance & Impact
9.2.1. Historic Growth Rate of Retail Automation Vendors
9.2.1. Supply Chain Management Market Growth
9.2.2. Inventory Management Market Growth
9.2.3. Global Retail & eCommerce Market Trends
9.2.4. Retail Automation Technology Adoption
9.2.5. Autonomous Material Handling Equipment for Warehouses
9.3. Value Chain Analysis
9.3.1. Retail Automations Hardware Vendors
9.3.2. Retail Automations Software Vendors
9.3.3. System Integrators/Value-added Resellers
9.3.4. Distributors/Value-Added Resellers
9.4. Market Dynamics
9.4.1. Drivers
9.4.2. Restraints
9.4.3. Opportunities
10. Global Retail Automation Market Analysis 2016-2020 and Forecast 2021-2031, by Component
10.1. Introduction / Key Findings
10.2. Historical Market Size (US$ Mn) and Volume (‘000 Units) Analysis By Component, 2016 - 2020
10.3. Current and Future Market Size (US$ Mn) and Volume (‘000 Units) Analysis and Forecast By Component, 2021 - 2031
10.3.1. Hardware
10.3.1.1. Point of Sale (POS) Terminals
10.3.1.2. RFID Tags
10.3.1.3. Code Scanners/Readers
10.3.1.4. Electronic Shelf Labels
10.3.1.5. Interactive Kiosks/Vending Machines
10.3.1.6. Others
10.3.2. Software
10.3.2.1. Retail Analytics & BI Software
10.3.2.2. Supply Chain and Inventory Management Software
10.3.2.3. On-Shelf Availability Software
10.3.2.4. Others
10.3.3. Services
10.3.3.1. Professional Services
10.3.3.1.1. Retail Consulting & Advisory
10.3.3.1.2. Implementation & Integration
10.3.3.1.3. Support & Maintenance
10.3.3.2. Managed Services
10.3.4. Market Attractiveness Analysis By Component
11. Global Retail Automation Market Analysis 2016-2020 and Forecast 2021-2031, by Deployment
11.1. Introduction / Key Findings
11.2. Historical Market Size (US$ Mn) Analysis By Deployment, 2016 - 2020
11.3. Current and Future Market Size (US$ Mn) Analysis and Forecast By Deployment, 2021 – 2031
11.3.1. Cloud
11.3.2. On-Premises
11.4. Market Attractiveness Analysis By Deployment
12. Global Retail Automation Market Analysis 2016-2020 and Forecast 2021-2031, by End user
12.1. Introduction / Key Findings
12.2. Historical Market Size (US$ Mn) Analysis By End user, 2016 - 2020
12.3. Current and Future Market Size (US$ Mn) Analysis and Forecast By End user, 2021 - 2031
12.3.1. Specialty Retail Stores
12.3.2. Departmental Stores
12.3.3. Supermarkets
12.3.4. Retail Pharmacy Stores
12.3.5. Others
12.4. Market Attractiveness Analysis By End user
13. Global Retail Automation Market Analysis 2016-2020 and Forecast 2021-2031, by Region
13.1. Introduction / Key Findings
13.2. Historical Market Size (US$ Mn) and Volume (‘000 Units) Analysis By Region, 2016 - 2020
13.3. Current Market Size (US$ Mn) and Volume (‘000 Units) Analysis and Forecast By Region, 2021 - 2031
13.3.1. North America
13.3.2. Latin America
13.3.3. Europe
13.3.4. East Asia
13.3.5. South Asia & Pacific
13.3.6. Middle East & Africa
13.4. Market Attractiveness Analysis By Region
14. North America Retail Automation Market Analysis 2016-2020 and Forecast 2021-2031
14.1. Introduction
14.2. Historical Market Size (US$ Mn) and Volume (‘000 Units) Trend Analysis By Market Taxonomy, 2016 - 2020
14.3. Market Size (US$ Mn) and Volume (‘000 Units) Forecast By Market Taxonomy, 2021 - 2031
14.3.1. By Component
14.3.2. By Deployment
14.3.3. By End user
14.3.4. By Country
14.3.4.1. U.S.
14.3.4.2. Canada
14.4. Market Attractiveness Analysis
14.4.1. By Component
14.4.2. By Deployment
14.4.3. By End user
14.4.4. By Country
14.5. Market Trends
14.6. Key Market Participants - Dashboard
15. Latin America Retail Automation Market Analysis 2016-2020 and Forecast 2021-2031
15.1. Introduction
15.2. Historical Market Size (US$ Mn) and Volume (‘000 Units) Trend Analysis By Market Taxonomy, 2016 - 2020
15.3. Market Size (US$ Mn) and Volume (‘000 Units) Forecast By Market Taxonomy, 2021 - 2031
15.3.1. By Component
15.3.2. By Deployment
15.3.3. By End user
15.3.4. By Country
15.3.4.1. Brazil
15.3.4.2. Mexico
15.3.4.3. Rest of Latin America
15.4. Market Attractiveness Analysis
15.4.1. By Component
15.4.2. By Deployment
15.4.3. By End user
15.4.4. By Country
15.5. Market Trends
15.6. Key Market Participants - Dashboard
16. Europe Retail Automation Market Analysis 2016-2020 and Forecast 2021-2031
16.1. Introduction
16.2. Historical Market Size (US$ Mn) and Volume (‘000 Units) Trend Analysis By Market Taxonomy, 2016 - 2020
16.3. Market Size (US$ Mn) and Volume (‘000 Units) Forecast By Market Taxonomy, 2021 - 2031
16.3.1. By Component
16.3.2. By Deployment
16.3.3. By End user
16.3.4. By Country
16.3.4.1. Germany
16.3.4.2. Italy
16.3.4.3. France
16.3.4.4. U.K.
16.3.4.5. Spain
16.3.4.6. BENELUX
16.3.4.7. Russia
16.3.4.8. Rest of Europe
16.4. Market Attractiveness Analysis
16.4.1. By Component
16.4.2. By Deployment
16.4.3. By End user
16.4.4. By Country
16.5. Market Trends
16.6. Key Market Participants - Dashboard
17. South Asia & Pacific Retail Automation Market Analysis 2016-2020 and Forecast 2021-2031
17.1. Introduction
17.2. Historical Market Size (US$ Mn) and Volume (‘000 Units) Trend Analysis By Market Taxonomy, 2016 - 2020
17.3. Market Size (US$ Mn) and Volume (‘000 Units) Forecast By Market Taxonomy, 2021 - 2031
17.3.1. By Component
17.3.2. By Deployment
17.3.3. By End user
17.3.4. By Country
17.3.4.1. India
17.3.4.2. Thailand
17.3.4.3. Indonesia
17.3.4.4. Malaysia
17.3.4.5. Oceania
17.3.4.6. Rest of South Asia & Pacific
17.4. Market Attractiveness Analysis
17.4.1. By Component
17.4.2. By Deployment
17.4.3. By End user
17.4.4. By Country
17.5. Market Trends
17.6. Key Market Participants - Dashboard
18. East Asia Retail Automation Market Analysis 2016-2020 and Forecast 2021-2031
18.1. Introduction
18.2. Historical Market Size (US$ Mn) and Volume (‘000 Units) Trend Analysis By Market Taxonomy, 2016 - 2020
18.3. Market Size (US$ Mn) and Volume (‘000 Units) Forecast By Market Taxonomy, 2021 - 2031
18.3.1. By Component
18.3.2. By Deployment
18.3.3. By End user
18.3.4. By Country
18.3.4.1. China
18.3.4.2. Japan
18.3.4.3. South Korea
18.4. Market Attractiveness Analysis
18.4.1. By Component
18.4.2. By Deployment
18.4.3. By End user
18.4.4. By Country
18.5. Market Trends
18.6. Key Market Participants - Dashboard
19. Middle East and Africa Retail Automation Market Analysis 2016-2020 and Forecast 2021-2031
19.1. Introduction
19.2. Historical Market Size (US$ Mn) and Volume (‘000 Units) Trend Analysis By Market Taxonomy, 2016 - 2020
19.3. Market Size (US$ Mn) and Volume (‘000 Units) Forecast By Market Taxonomy, 2021 - 2031
19.3.1. By Component
19.3.2. By Deployment
19.3.3. By End user
19.3.4. By Country
19.3.4.1. GCC Countries
19.3.4.2. Turkey
19.3.4.3. Northern Africa
19.3.4.4. South Africa
19.3.4.5. Rest of Middle East and Africa
19.4. Market Attractiveness Analysis
19.4.1. By Component
19.4.2. By Deployment
19.4.3. By End user
19.4.4. By Country
19.5. Market Trends
19.6. Key Market Participants - Dashboard
20. Key and Emerging Countries Analysis- Retail Automation Market
20.1. U.S. Retail Automation Market Analysis
20.1.1. By Component
20.1.2. By Deployment
20.1.3. By End user
20.2. Canada Retail Automation Market Analysis
20.2.1. By Component
20.2.2. By Deployment
20.2.3. By End user
20.3. Mexico Retail Automation Market Analysis
20.3.1. By Component
20.3.2. By Deployment
20.3.3. By End user
20.4. Brazil Retail Automation Market Analysis
20.4.1. By Component
20.4.2. By Deployment
20.4.3. By End user
20.5. Germany Retail Automation Market Analysis
20.5.1. By Component
20.5.2. By Deployment
20.5.3. By End user
20.6. Italy Retail Automation Market Analysis
20.6.1. By Component
20.6.2. By Deployment
20.6.3. By End user
20.7. France Retail Automation Market Analysis
20.7.1. By Component
20.7.2. By Deployment
20.7.3. By End user
20.8. U.K. Retail Automation Market Analysis
20.8.1. By Component
20.8.2. By Deployment
20.8.3. By End user
20.9. Spain Retail Automation Market Analysis
20.9.1. By Component
20.9.2. By Deployment
20.9.3. By End user
20.10. BENELUX Retail Automation Market Analysis
20.10.1. By Component
20.10.2. By Deployment
20.10.3. By End user
20.11. Russia Retail Automation Market Analysis
20.11.1. By Component
20.11.2. By Deployment
20.11.3. By End user
20.12. China Retail Automation Market Analysis
20.12.1. By Component
20.12.2. By Deployment
20.12.3. By End user
20.13. Japan Retail Automation Market Analysis
20.13.1. By Component
20.13.2. By Deployment
20.13.3. By End user
20.14. South Korea Retail Automation Market Analysis
20.14.1. By Component
20.14.2. By Deployment
20.14.3. By End user
20.15. India Retail Automation Market Analysis
20.15.1. By Component
20.15.2. By Deployment
20.15.3. By End user
20.16. ASEAN Retail Automation Market Analysis
20.16.1. By Component
20.16.2. By Deployment
20.16.3. By End user
20.17. Australia and New Zealand Retail Automation Market Analysis
20.17.1. By Component
20.17.2. By Deployment
20.17.3. By End user
20.18. GCC Countries Retail Automation Market Analysis
20.18.1. By Component
20.18.2. By Deployment
20.18.3. By End user
20.19. Turkey Retail Automation Market Analysis
20.19.1. By Component
20.19.2. By Deployment
20.19.3. By End user
20.20. South Africa Retail Automation Market Analysis
20.20.1. By Component
20.20.2. By Deployment
20.20.3. By End user
21. Competition Analysis
21.1. Competition Dashboard
21.2. Pricing Analysis, by Competition
21.3. Leading WMS System Vendor Matrix
21.3.1. Hardware Vendors
21.3.2. Software Vendors
21.4. Competition Deep Dive
21.4.1. Datalogic S.p.A
21.4.1.1. Business Overview
21.4.1.2. Product & Services Portfolio
21.4.1.3. Profitability by Market Segments (Product/Channel/Region)
21.4.1.4. Sales Footprint
21.4.1.5. Strategy Overview
21.4.1.5.1. Marketing Strategy
21.4.1.5.2. Product Strategy
21.4.1.5.3. Channel Strategy
21.4.2. NCR Corporation
21.4.2.1. Business Overview
21.4.2.2. Product & Services Portfolio
21.4.2.3. Profitability by Market Segments (Product/Channel/Region)
21.4.2.4. Sales Footprint
21.4.2.5. Strategy Overview
21.4.2.5.1. Marketing Strategy
21.4.2.5.2. Product Strategy
21.4.2.5.3. Channel Strategy
21.4.3. Honeywell International Inc.
21.4.3.1. Business Overview
21.4.3.2. Product & Services Portfolio
21.4.3.3. Profitability by Market Segments (Product/Channel/Region)
21.4.3.4. Sales Footprint
21.4.3.5. Strategy Overview
21.4.3.5.1. Marketing Strategy
21.4.3.5.2. Product Strategy
21.4.3.5.3. Channel Strategy
21.4.4. KUKA AG
21.4.4.1. Business Overview
21.4.4.2. Product & Services Portfolio
21.4.4.3. Profitability by Market Segments (Product/Channel/Region)
21.4.4.4. Sales Footprint
21.4.4.5. Strategy Overview
21.4.4.5.1. Marketing Strategy
21.4.4.5.2. Product Strategy
21.4.4.5.3. Channel Strategy
21.4.5. Zebra Technologies Corporation
21.4.5.1. Business Overview
21.4.5.2. Product & Services Portfolio
21.4.5.3. Profitability by Market Segments (Product/Channel/Region)
21.4.5.4. Sales Footprint
21.4.5.5. Strategy Overview
21.4.5.5.1. Marketing Strategy
21.4.5.5.2. Product Strategy
21.4.5.5.3. Channel Strategy
21.4.6. Fujitsu Limited
21.4.6.1. Business Overview
21.4.6.2. Product & Services Portfolio
21.4.6.3. Profitability by Market Segments (Product/Channel/Region)
21.4.6.4. Sales Footprint
21.4.6.5. Strategy Overview
21.4.6.5.1. Marketing Strategy
21.4.6.5.2. Product Strategy
21.4.6.5.3. Channel Strategy
21.4.7. Samsung Electronics Co. Ltd.
21.4.7.1. Business Overview
21.4.7.2. Product & Services Portfolio
21.4.7.3. Profitability by Market Segments (Product/Channel/Region)
21.4.7.4. Sales Footprint
21.4.7.5. Strategy Overview
21.4.7.5.1. Marketing Strategy
21.4.7.5.2. Product Strategy
21.4.7.5.3. Channel Strategy
21.4.8. Posiflex Technology, Inc.
21.4.8.1. Business Overview
21.4.8.2. Product & Services Portfolio
21.4.8.3. Profitability by Market Segments (Product/Channel/Region)
21.4.8.4. Sales Footprint
21.4.8.5. Strategy Overview
21.4.8.5.1. Marketing Strategy
21.4.8.5.2. Product Strategy
21.4.8.5.3. Channel Strategy
21.4.9. Tecsys Inc.
21.4.9.1. Business Overview
21.4.9.2. Product & Services Portfolio
21.4.9.3. Profitability by Market Segments (Product/Channel/Region)
21.4.9.4. Sales Footprint
21.4.9.5. Strategy Overview
21.4.9.5.1. Marketing Strategy
21.4.9.5.2. Product Strategy
21.4.9.5.3. Channel Strategy
21.4.10. Optimove Inc.
21.4.10.1. Business Overview
21.4.10.2. Product & Services Portfolio
21.4.10.3. Profitability by Market Segments (Product/Channel/Region)
21.4.10.4. Sales Footprint
21.4.10.5. Strategy Overview
21.4.10.5.1. Marketing Strategy
21.4.10.5.2. Product Strategy
21.4.10.5.3. Channel Strategy
21.4.11. Capillary Technologies
21.4.11.1. Business Overview
21.4.11.2. Product & Services Portfolio
21.4.11.3. Profitability by Market Segments (Product/Channel/Region)
21.4.11.4. Sales Footprint
21.4.11.5. Strategy Overview
21.4.11.5.1. Marketing Strategy
21.4.11.5.2. Product Strategy
21.4.11.5.3. Channel Strategy
21.4.12. Focus Softnet FZ LLC
21.4.12.1. Business Overview
21.4.12.2. Product & Services Portfolio
21.4.12.3. Profitability by Market Segments (Product/Channel/Region)
21.4.12.4. Sales Footprint
21.4.12.5. Strategy Overview
21.4.12.5.1. Marketing Strategy
21.4.12.5.2. Product Strategy
21.4.12.5.3. Channel Strategy
21.4.13. Future Way Technical Services LLC
21.4.13.1. Business Overview
21.4.13.2. Product & Services Portfolio
21.4.13.3. Profitability by Market Segments (Product/Channel/Region)
21.4.13.4. Sales Footprint
21.4.13.5. Strategy Overview
21.4.13.5.1. Marketing Strategy
21.4.13.5.2. Product Strategy
21.4.13.5.3. Channel Strategy
21.4.14. QR Retail Automation (Asia) Sdn Bhd
21.4.14.1. Business Overview
21.4.14.2. Product & Services Portfolio
21.4.14.3. Profitability by Market Segments (Product/Channel/Region)
21.4.14.4. Sales Footprint
21.4.14.5. Strategy Overview
21.4.14.5.1. Marketing Strategy
21.4.14.5.2. Product Strategy
21.4.14.5.3. Channel Strategy
21.4.15. Microlistics
21.4.15.1. Business Overview
21.4.15.2. Product & Services Portfolio
21.4.15.3. Profitability by Market Segments (Product/Channel/Region)
21.4.15.4. Sales Footprint
21.4.15.5. Strategy Overview
21.4.15.5.1. Marketing Strategy
21.4.15.5.2. Product Strategy
21.4.15.5.3. Channel Strategy
21.4.16. First Data Corporation
21.4.16.1. Business Overview
21.4.16.2. Product & Services Portfolio
21.4.16.3. Profitability by Market Segments (Product/Channel/Region)
21.4.16.4. Sales Footprint
21.4.16.5. Strategy Overview
21.4.16.5.1. Marketing Strategy
21.4.16.5.2. Product Strategy
21.4.16.5.3. Channel Strategy
21.4.17. E&K Automation GmbH
21.4.17.1. Business Overview
21.4.17.2. Product & Services Portfolio
21.4.17.3. Profitability by Market Segments (Product/Channel/Region)
21.4.17.4. Sales Footprint
21.4.17.5. Strategy Overview
21.4.17.5.1. Marketing Strategy
21.4.17.5.2. Product Strategy
21.4.17.5.3. Channel Strategy
21.4.18. Napse
21.4.18.1. Business Overview
21.4.18.2. Product & Services Portfolio
21.4.18.3. Profitability by Market Segments (Product/Channel/Region)
21.4.18.4. Sales Footprint
21.4.18.5. Strategy Overview
21.4.18.5.1. Marketing Strategy
21.4.18.5.2. Product Strategy
21.4.18.5.3. Channel Strategy
21.4.19. Vinculum Solutions Pvt. Ltd.
21.4.19.1. Business Overview
21.4.19.2. Product & Services Portfolio
21.4.19.3. Profitability by Market Segments (Product/Channel/Region)
21.4.19.4. Sales Footprint
21.4.19.5. Strategy Overview
21.4.19.5.1. Marketing Strategy
21.4.19.5.2. Product Strategy
21.4.19.5.3. Channel Strategy
21.4.20. Infoplus
21.4.20.1. Business Overview
21.4.20.2. Product & Services Portfolio
21.4.20.3. Profitability by Market Segments (Product/Channel/Region)
21.4.20.4. Sales Footprint
21.4.20.5. Strategy Overview
21.4.20.5.1. Marketing Strategy
21.4.20.5.2. Product Strategy
21.4.20.5.3. Channel Strategy
22. Assumptions and Acronyms Used
23. Research Methodology
Let us know your requirement to get
100% FREE customization
List of Tables
Table 01: Region-wise Retail Automation Market Average Pricing (US$) Analysis by Hardware, 2020
Table 02: Global Retail Automation Market Value (US$ Mn) Analysis by Component, 2016-2031
Table 03: Global Retail Automation Market Value (US$ Mn) Analysis by Component, 2016-2031
Table 04: Global Retail Automation Market Value (US$ Mn) Analysis by Component, 2016-2031
Table 05: Global Retail Automation Market Volume (US$ Mn) Analysis by Component, 2021-2031
Table 06: Global Retail Automation Market Value (US$ Mn) Analysis by Deployment, 2016-2031
Table 07: Global Retail Automation Market Value (US$ Mn) Analysis by End user, 2016-2031
Table 08: Global Retail Automation Market Value (US$ Mn) Analysis by Region, 2016-2031
Table 09: North America Retail Automation Market Value (US$ Mn) Analysis by Component, 2016-2031
Table 10: North America Retail Automation Market Value (US$ Mn) Analysis by Component, 2016-2031
Table 11: North America Retail Automation Market Value (US$ Mn) Analysis by Component, 2016-2031
Table 12: North America Retail Automation Market Volume (US$ Mn) Analysis by Component, 2021-2031
Table 13: North America Retail Automation Market Value (US$ Mn) Analysis by Deployment, 2016-2031
Table 14: North America Retail Automation Market Value (US$ Mn) Analysis by End user, 2016-2031
Table 15: North America Retail Automation Market Value (US$ Mn) Analysis by Country, 2016-2031
Table 16: Latin America Retail Automation Market Value (US$ Mn) Analysis by Component, 2016-2031
Table 17: Latin America Retail Automation Market Value (US$ Mn) Analysis by Component, 2016-2031
Table 18: Latin America Retail Automation Market Value (US$ Mn) Analysis by Component, 2016-2031
Table 19: Latin America Retail Automation Market Volume (US$ Mn) Analysis by Component, 2021-2031
Table 20: Latin America Retail Automation Market Value (US$ Mn) Analysis by Deployment, 2016-2031
Table 21: Latin America Retail Automation Market Value (US$ Mn) Analysis by End user, 2016-2031
Table 22: Latin America Retail Automation Market Value (US$ Mn) Analysis by Country, 2016-2031
Table 23: Europe Retail Automation Market Value (US$ Mn) Analysis by Component, 2016-2031
Table 24: Europe Retail Automation Market Value (US$ Mn) Analysis by Component, 2016-2031
Table 25: Europe Retail Automation Market Value (US$ Mn) Analysis by Component, 2016-2031
Table 26: Europe Retail Automation Market Volume (US$ Mn) Analysis by Component, 2021-2031
Table 27: Europe Retail Automation Market Value (US$ Mn) Analysis by Deployment, 2016-2031
Table 28: Europe Retail Automation Market Value (US$ Mn) Analysis by End user, 2016-2031
Table 29: Europe Retail Automation Market Value (US$ Mn) Analysis by Country, 2016-2031
Table 30: East Asia Retail Automation Market Value (US$ Mn) Analysis by Component, 2016-2031
Table 31: East Asia Retail Automation Market Value (US$ Mn) Analysis by Component, 2016-2031
Table 32: East Asia Retail Automation Market Value (US$ Mn) Analysis by Component, 2016-2031
Table 33: East Asia Retail Automation Market Volume (US$ Mn) Analysis by Component, 2021-2031
Table 34: East Asia Retail Automation Market Value (US$ Mn) Analysis by Deployment, 2016-2031
Table 35: East Asia Retail Automation Market Value (US$ Mn) Analysis by End user, 2016-2031
Table 36: East Asia Retail Automation Market Value (US$ Mn) Analysis by Country, 2016-2031
Table 37: South Asia & Pacific Retail Automation Market Value (US$ Mn) Analysis by Component, 2016-2031
Table 38: South Asia & Pacific Retail Automation Market Value (US$ Mn) Analysis by Component, 2016-2031
Table 39: South Asia & Pacific Retail Automation Market Value (US$ Mn) Analysis by Component, 2016-2031
Table 40: South Asia & Pacific Retail Automation Market Volume (US$ Mn) Analysis by Component, 2021-2031
Table 41: South Asia & Pacific Retail Automation Market Value (US$ Mn) Analysis by Deployment, 2016-2031
Table 42: South Asia & Pacific Retail Automation Market Value (US$ Mn) Analysis by End user, 2016-2031
Table 43: South Asia & Pacific Retail Automation Market Value (US$ Mn) Analysis by Country, 2016-2031
Table 44: Middle East & Africa Retail Automation Market Value (US$ Mn) Analysis by Component, 2016-2031
Table 45: Middle East & Africa Retail Automation Market Value (US$ Mn) Analysis by Component, 2016-2031
Table 46: Middle East & Africa Retail Automation Market Value (US$ Mn) Analysis by Component, 2016-2031
Table 47: Middle East & Africa Retail Automation Market Volume (US$ Mn) Analysis by Component, 2021-2031
Table 48: Middle East & Africa Retail Automation Market Value (US$ Mn) Analysis by Deployment, 2016-2031
Table 49: Middle East & Africa Retail Automation Market Value (US$ Mn) Analysis by End user, 2016-2031
Table 50: Middle East & Africa Retail Automation Market Value (US$ Mn) Analysis by Country, 2016-2031
Find your sweet spots for generating winning opportunities in this market.
Talk to AnalystList of Charts
Figure 01: Global Retail Automation Market Size (in Volume ‘000 Units) and Y-o-Y Growth Rate from 2021 – 2031
Figure 02: Global Retail Automation Market Size (in Value US$ Mn) and Y-o-Y Growth Rate from 2021 – 2031
Figure 03: Global Retail Automation Market Absolute $ Opportunity (US$ Mn), 2020 – 2031
Figure 04: Global Retail Automation Market Share Analysis by Component– 2021 & 2031
Figure 05: Global Retail Automation Market Y-o-Y Growth by Component, 2021 – 2031
Figure 06: Global Retail Automation Market Attractiveness Analysis by Component, 2021 – 2031
Figure 07: Global Retail Automation Market Share Analysis by Deployment– 2021 & 2031
Figure 08: Global Retail Automation Market Y-o-Y Growth by Deployment, 2021 – 2031
Figure 09: Global Retail Automation Market Attractiveness Analysis by Deployment, 2021 – 2031
Figure 10: Global Retail Automation Market Share Analysis by End user – 2021 & 2031
Figure 11: Global Retail Automation Market Y-o-Y Growth by End user, 2021 – 2031
Figure 12: Global Retail Automation Market Attractiveness Analysis by End user, 2021 – 2031
Figure 13: Global Retail Automation Market Value (US$ Mn), 2016-2020
Figure 14: Global Retail Automation Market Value (US$ Mn), 2021-2031
Figure 15: Global Retail Automation Market Share Analysis by Region – 2021 & 2031
Figure 16: Global Retail Automation Market Y-o-Y Growth by Region, 2021 – 2031
Figure 17: Global Retail Automation Market Attractiveness Analysis by Region, 2021 – 2031
Figure 18: North America Retail Automation Market Absolute $ Opportunity (US$ Mn), 2016-2031
Figure 19: Latin America Retail Automation Market Absolute $ Opportunity (US$ Mn), 2016-2031
Figure 20: Europe Retail Automation Market Absolute $ Opportunity (US$ Mn), 2016-2031
Figure 21: East Asia Retail Automation Market Absolute $ Opportunity (US$ Mn), 2016-2031
Figure 22: South Asia & Pacific Retail Automation Market Absolute $ Opportunity (US$ Mn), 2016-2031
Figure 23: Middle East & Africa Retail Automation Market Absolute $ Opportunity (US$ Mn), 2016-2031
Figure 24: North America Retail Automation Market Value (US$ Mn), 2016-2020
Figure 25: North America Retail Automation Market Value (US$ Mn), 2021-2031
Figure 26: North America Retail Automation Market Share Analysis by Component– 2021 & 2031
Figure 27: North America Retail Automation Market Y-o-Y Growth by Component, 2021 – 2031
Figure 28: North America Retail Automation Market Attractiveness Analysis by Component, 2021 – 2031
Figure 29: North America Retail Automation Market Share Analysis by Deployment– 2021 & 2031
Figure 30: North America Retail Automation Market Y-o-Y Growth by Deployment, 2021 – 2031
Figure 31: North America Retail Automation Market Attractiveness Analysis by Deployment, 2021 – 2031
Figure 32: North America Retail Automation Market Share Analysis by End user – 2021 & 2031
Figure 33: North America Retail Automation Market Y-o-Y Growth by End user, 2021 – 2031
Figure 34: North America Retail Automation Market Attractiveness Analysis by End user, 2021 – 2031
Figure 35: North America Retail Automation Market Share Analysis by Country – 2021 & 2031
Figure 36: North America Retail Automation Market Y-o-Y Growth by Country, 2021 – 2031
Figure 37: North America Retail Automation Market Attractiveness Analysis by Country, 2021 – 2031
Figure 38: U.S. Retail Automation Market Absolute $ Opportunity (US$ Mn), 2016-2031
Figure 39: Canada Retail Automation Market Absolute $ Opportunity (US$ Mn), 2016-2031
Figure 40: Latin America Retail Automation Market Value (US$ Mn), 2016-2020
Figure 41: Latin America Retail Automation Market Value (US$ Mn), 2021-2031
Figure 42: Latin America Retail Automation Market Share Analysis by Component– 2021 & 2031
Figure 43: Latin America Retail Automation Market Y-o-Y Growth by Component, 2021 – 2031
Figure 44: Latin America Retail Automation Market Attractiveness Analysis by Component, 2021 – 2031
Figure 45: Latin America Retail Automation Market Share Analysis by Deployment– 2021 & 2031
Figure 46: Latin America Retail Automation Market Y-o-Y Growth by Deployment, 2021 – 2031
Figure 47: Latin America Retail Automation Market Attractiveness Analysis by Deployment, 2021 – 2031
Figure 48: Latin America Retail Automation Market Share Analysis by End user – 2021 & 2031
Figure 49: Latin America Retail Automation Market Y-o-Y Growth by End user, 2021 – 2031
Figure 50: Latin America Retail Automation Market Attractiveness Analysis by End user, 2021 – 2031
Figure 51: Latin America Retail Automation Market Share Analysis by Country – 2021 & 2031
Figure 52: Latin America Retail Automation Market Y-o-Y Growth by Country, 2021 – 2031
Figure 53: Latin America Retail Automation Market Attractiveness Analysis by Country, 2021 – 2031
Figure 54: Brazil Retail Automation Market Absolute $ Opportunity (US$ Mn), 2016-2031
Figure 55: Mexico Retail Automation Market Absolute $ Opportunity (US$ Mn), 2016-2031
Figure 56: Rest of Latin America Retail Automation Market Absolute $ Opportunity (US$ Mn), 2016-2031
Figure 57: Europe Retail Automation Market Value (US$ Mn), 2016-2020
Figure 58: Europe Retail Automation Market Value (US$ Mn), 2021-2031
Figure 59: Europe Retail Automation Market Share Analysis by Component– 2021 & 2031
Figure 60: Europe Retail Automation Market Y-o-Y Growth by Component, 2021 – 2031
Figure 61: Europe Retail Automation Market Attractiveness Analysis by Component, 2021 – 2031
Figure 62: Europe Retail Automation Market Share Analysis by Deployment– 2021 & 2031
Figure 63: Europe Retail Automation Market Y-o-Y Growth by Deployment, 2021 – 2031
Figure 64: Europe Retail Automation Market Attractiveness Analysis by Deployment, 2021 – 2031
Figure 65: Europe Retail Automation Market Share Analysis by End user – 2021 & 2031
Figure 66: Europe Retail Automation Market Y-o-Y Growth by End user, 2021 – 2031
Figure 67: Europe Retail Automation Market Attractiveness Analysis by End user, 2021 – 2031
Figure 68: Europe Retail Automation Market Share Analysis by Country – 2021 & 2031
Figure 69: Europe Retail Automation Market Y-o-Y Growth by Country, 2021 – 2031
Figure 70: Europe Retail Automation Market Attractiveness Analysis by Country, 2021 – 2031
Figure 71: Germany Retail Automation Market Absolute $ Opportunity (US$ Mn), 2016 – 2031
Figure 72: Italy Retail Automation Market Absolute $ Opportunity (US$ Mn), 2016 – 2031
Figure 73: France Retail Automation Market Absolute $ Opportunity (US$ Mn), 2016 – 2031
Figure 74: U.K. Retail Automation Market Absolute $ Opportunity (US$ Mn), 2016 – 2031
Figure 75: Spain Retail Automation Market Absolute $ Opportunity (US$ Mn), 2016 – 2031
Figure 76: BENELUX Retail Automation Market Absolute $ Opportunity (US$ Mn), 2016 – 2031
Figure 77: Russia Retail Automation Market Absolute $ Opportunity (US$ Mn), 2016 – 2031
Figure 78: Rest of Europe Retail Automation Market Absolute $ Opportunity (US$ Mn), 2016 – 2031
Figure 79: East Asia Retail Automation Market Value (US$ Mn), 2016-2020
Figure 80: East Asia Retail Automation Market Value (US$ Mn), 2021-2031
Figure 81: East Asia Retail Automation Market Share Analysis by Component– 2021 & 2031
Figure 82: East Asia Retail Automation Market Y-o-Y Growth by Component, 2021 – 2031
Figure 83: East Asia Retail Automation Market Attractiveness Analysis by Component, 2021 – 2031
Figure 84: East Asia Retail Automation Market Share Analysis by Deployment– 2021 & 2031
Figure 85: East Asia Retail Automation Market Y-o-Y Growth by Deployment, 2021 – 2031
Figure 86: East Asia Retail Automation Market Attractiveness Analysis by Deployment, 2021 – 2031
Figure 87: East Asia Retail Automation Market Share Analysis by End user – 2021 & 2031
Figure 88: East Asia Retail Automation Market Y-o-Y Growth by End user, 2021 – 2031
Figure 89: East Asia Retail Automation Market Attractiveness Analysis by End user, 2021 – 2031
Figure 90: East Asia Retail Automation Market Share Analysis by Country – 2021 & 2031
Figure 91: East Asia Retail Automation Market Y-o-Y Growth by Country, 2021 – 2031
Figure 92: East Asia Retail Automation Market Attractiveness Analysis by Country, 2021 – 2031
Figure 93: China Retail Automation Market Absolute $ Opportunity (US$ Mn), 2016 – 2031
Figure 94: Japan Retail Automation Market Absolute $ Opportunity (US$ Mn), 2016 – 2031
Figure 95: South Korea Retail Automation Market Absolute $ Opportunity (US$ Mn), 2016 – 2031
Figure 96: South Asia & Pacific Retail Automation Market Value (US$ Mn), 2016-2020
Figure 97: South Asia & Pacific Retail Automation Market Value (US$ Mn), 2021-2031
Figure 98: South Asia & Pacific Retail Automation Market Share Analysis by Component– 2021 & 2031
Figure 99: South Asia & Pacific Retail Automation Market Y-o-Y Growth by Component, 2021 – 2031
Figure 100: South Asia & Pacific Retail Automation Market Attractiveness Analysis by Component, 2021 – 2031
Figure 101: South Asia & Pacific Retail Automation Market Share Analysis by Deployment– 2021 & 2031
Figure 102: South Asia & Pacific Retail Automation Market Y-o-Y Growth by Deployment, 2021 – 2031
Figure 103: South Asia & Pacific Retail Automation Market Attractiveness Analysis by Deployment, 2021 – 2031
Figure 104: South Asia & Pacific Retail Automation Market Share Analysis by End user – 2021 & 2031
Figure 105: South Asia & Pacific Retail Automation Market Y-o-Y Growth by End user, 2021 – 2031
Figure 106: South Asia & Pacific Retail Automation Market Attractiveness Analysis by End user, 2021 – 2031
Figure 107: South Asia & Pacific Retail Automation Market Share Analysis by Country – 2021 & 2031
Figure 108: South Asia & Pacific Retail Automation Market Y-o-Y Growth by Country, 2021 – 2031
Figure 109: South Asia & Pacific Retail Automation Market Attractiveness Analysis by Country, 2021 – 2031
Figure 110: India Retail Automation Market Absolute $ Opportunity (US$ Mn), 2016 – 2031
Figure 111: ASEAN Retail Automation Market Absolute $ Opportunity (US$ Mn), 2016 – 2031
Figure 112: Australia & New Zealand Retail Automation Market Absolute $ Opportunity (US$ Mn), 2016 – 2031
Figure 113: Rest of South Asia & Pacific Retail Automation Market Absolute $ Opportunity (US$ Mn), 2016 – 2031
Figure 114: Middle East & Africa Retail Automation Market Value (US$ Mn), 2016-2020
Figure 115: Middle East & Africa Retail Automation Market Value (US$ Mn), 2021-2031
Figure 116: Middle East & Africa Retail Automation Market Share Analysis by Component– 2021 & 2031
Figure 117: Middle East & Africa Retail Automation Market Y-o-Y Growth by Component, 2021 – 2031
Figure 118: Middle East & Africa Retail Automation Market Attractiveness Analysis by Component, 2021 – 2031
Figure 119: Middle East & Africa Retail Automation Market Share Analysis by Deployment– 2021 & 2031
Figure 120: Middle East & Africa Retail Automation Market Y-o-Y Growth by Deployment, 2021 – 2031
Figure 121: Middle East & Africa Retail Automation Market Attractiveness Analysis by Deployment, 2021 – 2031
Figure 122: Middle East & Africa Retail Automation Market Share Analysis by End user – 2021 & 2031
Figure 123: Middle East & Africa Retail Automation Market Y-o-Y Growth by End user, 2021 – 2031
Figure 124: Middle East & Africa Retail Automation Market Attractiveness Analysis by End user, 2021 – 2031
Figure 125: Middle East & Africa Retail Automation Market Share Analysis by Country – 2021 & 2031
Figure 126: Middle East & Africa Retail Automation Market Y-o-Y Growth by Country, 2021 – 2031
Figure 127: Middle East & Africa Retail Automation Market Attractiveness Analysis by Country, 2021 – 2031
Figure 128: GCC Countries Retail Automation Market Absolute $ Opportunity (US$ Mn), 2016 – 2031
Figure 129: Turkey Retail Automation Market Absolute $ Opportunity (US$ Mn), 2016 – 2031
Figure 130: South Africa Retail Automation Market Absolute $ Opportunity (US$ Mn), 2016 – 2031
Figure 131: Rest of Middle East & Africa Retail Automation Market Absolute $ Opportunity (US$ Mn), 2016 – 2031
Figure 132: U.S. Incremental Opportunity Share Analysis, by Component
Figure 133: U.S. Incremental Opportunity Share Analysis, by Deployment
Figure 134: U.S. Incremental Opportunity Share Analysis, by End user
Figure 135: Canada Incremental Opportunity Share Analysis, by Component
Figure 136: Canada Incremental Opportunity Share Analysis, by Deployment
Figure 137: Canada Incremental Opportunity Share Analysis, by End user
Figure 138: Brazil Incremental Opportunity Share Analysis, by Component
Figure 139: Brazil Incremental Opportunity Share Analysis, by Deployment
Figure 140: Brazil Incremental Opportunity Share Analysis, by End user
Figure 141: Mexico Incremental Opportunity Share Analysis, by Component
Figure 142: Mexico Incremental Opportunity Share Analysis, by Deployment
Figure 143: Mexico Incremental Opportunity Share Analysis, by End user
Figure 144: Germany Incremental Opportunity Share Analysis, by Component
Figure 145: Germany Incremental Opportunity Share Analysis, by Deployment
Figure 146: Germany Incremental Opportunity Share Analysis, by End user
Figure 147: Italy Incremental Opportunity Share Analysis, by Component
Figure 148: Italy Incremental Opportunity Share Analysis, by Deployment
Figure 149: Italy Incremental Opportunity Share Analysis, by End user
Figure 150: France Incremental Opportunity Share Analysis, by Component
Figure 151: France Incremental Opportunity Share Analysis, by Deployment
Figure 152: France Incremental Opportunity Share Analysis, by End user
Figure 153: U.K. Incremental Opportunity Share Analysis, by Component
Figure 154: U.K. Incremental Opportunity Share Analysis, by Deployment
Figure 155: U.K. Incremental Opportunity Share Analysis, by End user
Figure 156: Spain Incremental Opportunity Share Analysis, by Component
Figure 157: Spain Incremental Opportunity Share Analysis, by Deployment
Figure 158: Spain Incremental Opportunity Share Analysis, by End user
Figure 159: BENELUX Incremental Opportunity Share Analysis, by Component
Figure 160: BENELUX Incremental Opportunity Share Analysis, by Deployment
Figure 161: BENELUX Incremental Opportunity Share Analysis, by End user
Figure 162: Russia Incremental Opportunity Share Analysis, by Component
Figure 163: Russia Incremental Opportunity Share Analysis, by Deployment
Figure 164: Russia Incremental Opportunity Share Analysis, by End user
Figure 165: China Incremental Opportunity Share Analysis, by Component
Figure 166: China Incremental Opportunity Share Analysis, by Deployment
Figure 167: China Incremental Opportunity Share Analysis, by End user
Figure 168: Japan Incremental Opportunity Share Analysis, by Component
Figure 169: Japan Incremental Opportunity Share Analysis, by Deployment
Figure 170: Japan Incremental Opportunity Share Analysis, by End user
Figure 171: South Korea Incremental Opportunity Share Analysis, by Component
Figure 172: South Korea Incremental Opportunity Share Analysis, by Deployment
Figure 173: South Korea Incremental Opportunity Share Analysis, by End user
Figure 174: India Incremental Opportunity Share Analysis, by Component
Figure 175: India Incremental Opportunity Share Analysis, by Deployment
Figure 176: India Incremental Opportunity Share Analysis, by End user
Figure 177: ASEAN Incremental Opportunity Share Analysis, by Component
Figure 178: ASEAN Incremental Opportunity Share Analysis, by Deployment
Figure 179: ASEAN Incremental Opportunity Share Analysis, by End user
Figure 180: Australia & New Zealand Incremental Opportunity Share Analysis, by Component
Figure 181: Australia & New Zealand Incremental Opportunity Share Analysis, by Deployment
Figure 182: Australia & New Zealand Incremental Opportunity Share Analysis, by End user
Figure 183: GCC Countries Incremental Opportunity Share Analysis, by Component
Figure 184: GCC Countries Incremental Opportunity Share Analysis, by Deployment
Figure 185: GCC Countries Incremental Opportunity Share Analysis, by End user
Figure 186: Turkey Incremental Opportunity Share Analysis, by Component
Figure 187: Turkey Incremental Opportunity Share Analysis, by Deployment
Figure 188: Turkey Incremental Opportunity Share Analysis, by End user
Figure 189: South Africa Incremental Opportunity Share Analysis, by Component
Figure 190: South Africa Incremental Opportunity Share Analysis, by Deployment
Figure 191: South Africa Incremental Opportunity Share Analysis, by End user
Need specific information?
Request CustomizationExplore Technology Insights
View Reports