Reports

- Global Locations -

Headquarters

Future Market Insights, Inc.

Christiana Corporate, 200
Continental Drive, Suite 401,
Newark, Delaware - 19713,
United States

T: +1-845-579-5705

Americas

Future Market Insights, Inc.

616 Corporate Way, Suite 2-9018,
Valley Cottage, NY 10989, United States

T: +1-347-918-3531

MEA

Future Market Insights

1602-6 Jumeirah Bay X2 Tower, Plot No: JLT-PH2-X2A,
Jumeirah Lakes Towers, Dubai,
United Arab Emirates

Europe

Future Market Insights

3rd Floor, 207 Regent Street,
W1B 3HH London
United Kingdom

T: + 44 (0) 20 8123 9659
D: +44 (0) 20 3287 4268

Asia Pacific

Future Market Insights

IndiaLand Global Tech Park, Unit UG-1, Behind Grand HighStreet, Phase 1, Hinjawadi, MH, Pune – 411057, India

Retail Clinic Market Outlook for 2024 to 2034

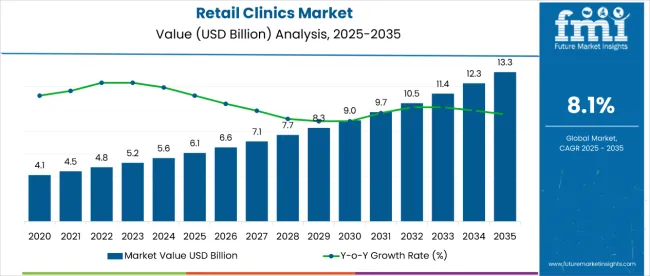
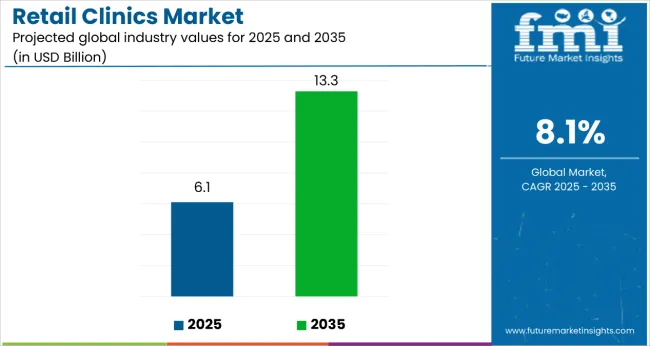
The retail clinic market is expected to be valued at US$ 5,659.2 million in 2024 and reach US$ 12,308.7 million by 2034. The market is projected to grow at a CAGR of 8.1% during the forecast period.

Key Market Drivers

  • The market is growing due to the rising demand for convenient and accessible healthcare services in retail settings. Retail clinics offer cost-effective healthcare services for common illnesses and preventive care.
  • The increasing trend of routine and preventive healthcare services like vaccination and wellness checks are provided by retail clinics, which operate with extended hours and provide walk-in services for busy schedules.
  • Technological advancements contribute to the efficiency and accessibility of services.
  • Partnerships with established retail chains expand the market’s reach, facilitating on-demand healthcare services without prior appointments.
  • Retail clinics promote a proactive approach to health by offering services that align with wellness goals. They help alleviate the pressure on traditional primary care resources for non-emergent health issues.
  • Retail clinics collaborate with public health initiatives such as vaccination campaigns and promoting preventive care within communities.
Attributes Key Statistics
Retail Clinic Market Value (2024) US$ 5,659.2 million
Anticipated Market Value (2034) US$ 12,308.7 million
Value-based CAGR (2024 to 2034) 8.1%

Don't pay for what you don't need

Customize your report by selecting specific countries or regions and save 30%!

Consumption Analysis of the Retail Clinic Market

The retail clinic market is experiencing substantial growth driven by increasing demand for convenient and accessible healthcare options.

  • Consumers prefer retail clinics because of their walk-in nature, extended hours, and cost-effectiveness. Retail clinics are becoming popular for routine and preventive care services due to their on-demand nature.
  • The demand for retail clinics is fueled by a shift in consumer behavior towards seeking immediate healthcare solutions that align with busy schedules and the desire for transparent and affordable services.
  • Retail clinics in familiar retail settings like pharmacies and supermarkets offer the convenience of finding healthcare services in places people visit frequently.
  • Collaborative efforts between healthcare providers and retail chains have expanded retail clinics' services beyond common illnesses to include wellness checks, vaccinations, and other preventive care offerings.
  • Integrating technology, such as online appointment scheduling and telehealth consultations, enhances the overall patient experience, further propelling the popularity and adoption of retail clinics.
  • Retail clinics are gaining popularity as they address the need for on-demand healthcare, aligning with modern consumers' expectations for immediate access to routine medical services.

Factors Adversely Affecting the Retail Clinic Market

The retail clinic market is anticipated to surpass a valuation of US$ 12,308.7 million by 2034, expanding at an 8.1% CAGR over the forecast period. While the retail clinics market is experiencing growth, several restraining factors can adversely affect its development and expansion:

  • Retail clinics mainly offer basic and routine healthcare services, which may not cover complex medical issues or chronic conditions. This may limit their appeal to a broader patient population. Retail clinics provide a different continuity of care than traditional primary care physicians.
  • The episodic nature of retail clinic visits can make it difficult to establish long-term patient-provided relationships, which can impact the management of chronic conditions.
  • Compliance with healthcare regulations can pose challenges for retail clinics. These regulations vary from state to state, impacting the uniformity and scalability of retail clinic operations across different regions.
  • Integrating retail clinics with healthcare systems and EHR platforms can be challenging. Ensuring seamless information exchange and coordination with primary healthcare providers needs help to provide effective collaboration and comprehensive patient care.
  • Retail clinics need help recruiting and retaining qualified healthcare professionals. The need for healthcare providers, such as nurse practitioners and physician assistants, may limit the availability and quality of services provided by retail clinics.
Sabyasachi Ghosh
Sabyasachi Ghosh

Principal Consultant

Talk to Analyst

Find your sweet spots for generating winning opportunities in this market.

Comparative View of Adjacent Markets

The section deals with two other markets that have the potential to give rigorous competition to the retail clinic market. These markets are the outpatient clinic market and the mobile clinic market. The respective markets' growth factors and critical challenges are also discussed below in the tables. Retail Clinic Market

Retail Clinic Market:

Attributes Retail Clinic Market
CAGR (2024 to 2034) 8.1%
Growth Factor
  • Lack of healthcare sectors to cater to a larger patient pool
  • Cost-effective healthcare services for common illnesses and preventive care
  • Increasing Use of Retail Care Clinics for Vaccine Delivery
Key Challenges
  • Complex medical issues or chronic conditions are not covered
  • Compliance with healthcare regulations

Outpatient Clinic Market:

Attributes Outpatient Clinic Market
CAGR (2023 to 2033) 4.2%
Growth Factor
  • Growing need for wellness and preventative care initiative
  • Wearable technology and remote monitoring are becoming crucial for managing chronic diseases in outpatient settings
Key Challenges Reimbursement Issues and Regulatory Compliance

Mobile Clinic Market:

Attributes Mobile Clinic Market
CAGR (2022 to 2032) 11.3%
Growth Factor Access populations in remote, difficult areas, as well as groups, cut off from mainstream medical care due to geography and climatic factors
Key Challenges Maintaining continuity of care

Category-wise Insights

Integration of Healthcare Services into Retail Business Models

Attributes Details
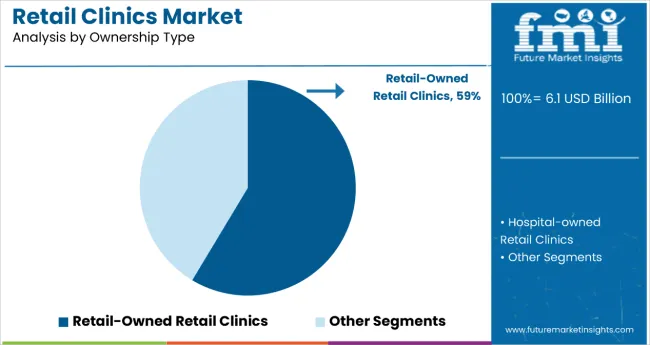
Ownership Type Retail-owned
Market Share in 2024 58.6%

Based on the ownership type, the retail-owned segment dominates the market with a share of 58.6% in 2024. The segment’s rising popularity is attributed to the following factors:

  • The trend of retailers directly owning and operating healthcare facilities such as clinics and pharmacies is on the rise globally. Retailers recognize revenue growth and diversification potential by integrating healthcare services into their business models.
  • The changing dynamics of the healthcare industry, where there is rising demand for easily accessible and cost-effective healthcare solutions, has led retailers to expand into healthcare services.
  • The retail-owned segment aligns with the evolving consumer preferences and helps retailers to play a significant role in shaping the future of integrated healthcare delivery on a global scale.

Drug Stores Fuel Market Growth Due to their Convenience and Accessibility

Attributes Details
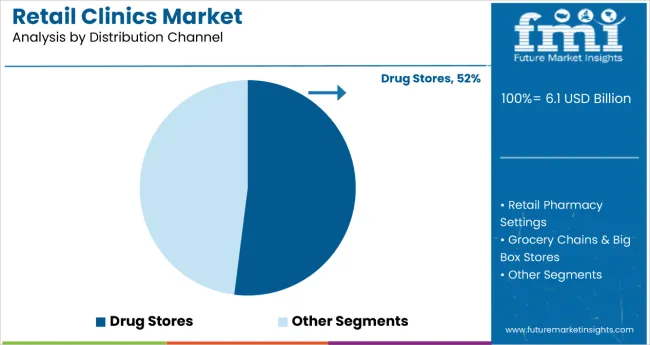
Distribution Channel Drug Store
Market Share 52.0%

Based on the distribution channel, drug stores dominate the market by distribution channel, holding a share of 52.0%. This rising popularity of the segment is attributed to the following reasons:

  • Drug stores provide a well-established infrastructure, convenience, and accessibility for consumers seeking basic healthcare services. By leveraging their existing networks, healthcare providers can tap into a readily available customer base, increasing the reach of retail clinics and making healthcare services more accessible to a larger population.
  • The healthcare delivery landscape is evolving, driving collaborations between traditional providers and retail establishments. As the demand for cost-effective and convenient healthcare options grows, drugstores are positioning themselves as essential partners in delivering primary care services.

Get the data you need at a Fraction of the cost

Personalize your report by choosing insights you need
and save 40%!

Country-wise Insights

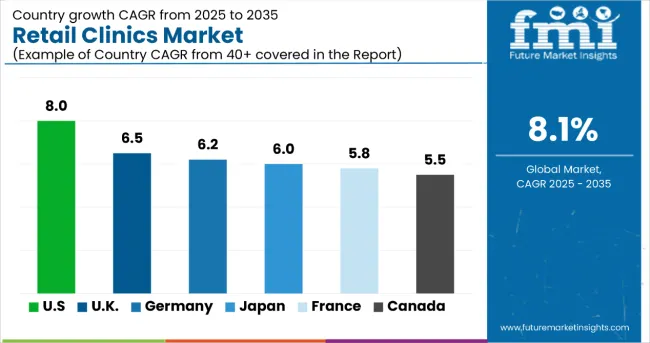
The section analyzes the retail clinic market by country, including the United States, China, Germany, France, and Japan. The table presents the CAGRs for each country, indicating the expected market growth in that country through 2034.

Countries CAGR (2024 to 2034)
United States 10.9%
China 11.4%
Germany 10.6%
France 10.2%
Japan 10.3%

China aligns with Government's Ongoing Efforts to Improve Healthcare System

China is a leading Asian country in the retail clinic market. The Chinese market is anticipated to register a CAGR of 13.6% through 2034.

  • The vast population, rapid urbanization, and increasing demand for healthcare services have boosted the growth of retail clinics.
  • Retail clinics offer basic healthcare services in easily accessible locations, reducing the burden on larger hospitals and improving overall healthcare access.
  • Retail clinics in China provide a practical and cost-effective solution to healthcare needs, especially in underserved areas.

Demand for Affordable and Accessible Healthcare Services in the United States

The United States dominates the retail clinic market in the North American region. The United States retail clinic market is anticipated to exhibit a CAGR of 10.9% through 2034.

  • The convenience of retail clinics, coupled with a focus on preventive care, has made them an attractive option for patients seeking non-emergency care.
  • Due to the complexity and fragmentation of the United States healthcare system, retail clinics offer a practical and efficient solution for patients seeking an alternative care delivery model.

Germany’s Commitment to Enhancing Healthcare Accessibility and Efficiency

In the European region, Germany leads the retail clinic market. Over the coming ten years, the demand for retail clinics in Germany is expected to rise at a 10.6% CAGR.

  • The well-regulated healthcare environment and a focus on patient-centered care have enabled German retail clinic operators to export their successful models to other countries.
  • The global expansion is fueled by the recognition that retail clinics can contribute to a more streamlined and convenient healthcare experience, meeting the growing demand for accessible primary care services worldwide.

Japan’s Aging Population and Increasing Burden on Traditional Healthcare Facilities

The Japanese retail clinics market is anticipated to register a CAGR of 10.3% through 2034.

  • The government has supported initiatives to improve primary care access, and retail clinics are seen as a practical solution to the strain on hospitals.
  • With an emphasis on preventive care and the management of common ailments, retail clinics align well with Japan's healthcare goals.
  • Retail clinics offer patients a convenient and efficient alternative to traditional healthcare facilities, especially for routine check-ups and minor illnesses.

Focus on Improving Healthcare Outcomes and Patient Satisfaction in France

Over the coming ten years, the market in France is expected to rise at a 10.2% CAGR through 2034.

  • France's foray into the global retail clinic market is driven by its dedication to improving healthcare outcomes and patient satisfaction.
  • French retail clinic operators are leveraging their expertise in delivering efficient, patient-focused services to tap into international markets.
  • By offering quality primary care outside traditional hospital settings, the French retail clinic model presents a compelling approach to addressing healthcare challenges faced by different countries worldwide.

Competitive Landscape

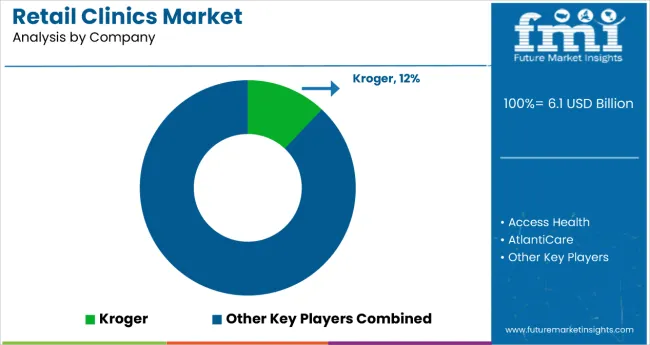
The global retail clinic market is highly fragmented, with key players such as Kroger Co., CVS Health, Rite Aid Corp, Walmart Inc., Walgreens Co., and Nextcare Holdings, Inc. dominating the landscape.

By embedding healthcare services within retail settings, these companies have contributed significantly to the ongoing transformation of healthcare delivery, making essential services more accessible, affordable, and patient-centric for a broader population. Through their strategic location within retail settings, these companies have made accessing healthcare services more convenient, especially for those living in underserved areas. They have also reduced the cost of healthcare services, making them more affordable for the general public.

Recent Developments

  • In December 2024, Walmart implemented plans to provide mammogram services at a clinic in Delaware, signaling an expansion initiative to offer additional healthcare services catering to the diverse needs of its customers.
  • On May 17, 2023, a survey by Wolters Kluwer revealed that over 50% of adult patients preferred visiting retail health clinics in pharmacies, reflecting the growing influence of healthcare consumerism on care access trends.
  • On June 20, 2023, retail health clinics garnered attention as shifting consumer demand fueled rapid and sustained growth. Definitive Healthcare reported a 200% increase in retail clinic claim volumes over the past five years.

Key Companies in the Market

  • The Kroger Co.
  • CVS Health
  • Rite Aid Corp
  • Walmart Inc.
  • Walgreens co.
  • Nextcare Holdings, Inc.
  • MedExpress
  • Doctors care
  • Bellin Health Systems
  • Concentra, Inc.

Market Segmentation

By Application:

  • Point-of-Care Diagnostics
  • Clinical Chemistry & Immunoassays
  • Vaccinations
  • Others

By Distribution Channel:

  • Retail Pharmacy Settings
  • Drug Stores
  • Grocery Chains & Big Box Stores

By Ownership Type:

  • Hospital-owned Retail Clinics
  • Retail-owned Retail Clinics

By Region:

  • Asia Pacific
  • Europe
  • North America
  • Middle East & Africa
  • Latin America

Frequently Asked Questions

How Big is the Retail Clinic Market in 2024?

The retail clinic market is expected to be worth US$ 5,659.2 million in 2024.

What is the Demand Forecast for Retail Clinics by 2034?

The market for retail clinics is expected to reach US$ 12,308.7 million by 2034.

At What Rate is the Retail Clinic Market Projected to Grow through 2034?

The retail clinic market is expected to grow at a CAGR of 8.1% from 2024 to 2034.

Who are the Key Market Players?

Some key players in the market are Kroger Co., CVS Health, Rite Aid Corp, Walmart Inc., Walgreens Co., and Nextcare Holdings, Inc.

Which is the Highly Preferred Distribution Channel in the Retail Clinic Market?

The drug store segment dominates the market, with a 52.0% share in 2024.

Table of Content

1. Executive Summary

    1.1. Global Market Outlook

    1.2. Demand-side Trends

    1.3. Supply-side Trends

    1.4. Technology Roadmap Analysis

    1.5. Analysis and Recommendations

2. Market Overview

    2.1. Market Coverage / Taxonomy

    2.2. Market Definition / Scope / Limitations

3. Market Background

    3.1. Market Dynamics

        3.1.1. Drivers

        3.1.2. Restraints

        3.1.3. Opportunity

        3.1.4. Trends

    3.2. Scenario Forecast

        3.2.1. Demand in Optimistic Scenario

        3.2.2. Demand in Likely Scenario

        3.2.3. Demand in Conservative Scenario

    3.3. Opportunity Map Analysis

    3.4. Investment Feasibility Matrix

    3.5. PESTLE and Porter’s Analysis

    3.6. Regulatory Landscape

        3.6.1. By Key Regions

        3.6.2. By Key Countries

    3.7. Regional Parent Market Outlook

4. Global Market Analysis 2019 to 2023 and Forecast, 2024 to 2034

    4.1. Historical Market Size Value (US$ Million) Analysis, 2019 to 2023

    4.2. Current and Future Market Size Value (US$ Million) Projections, 2024 to 2034

        4.2.1. Y-o-Y Growth Trend Analysis

        4.2.2. Absolute $ Opportunity Analysis

5. Global Market Analysis 2019 to 2023 and Forecast 2024 to 2034, By Application

    5.1. Introduction / Key Findings

    5.2. Historical Market Size Value (US$ Million) Analysis By Application, 2019 to 2023

    5.3. Current and Future Market Size Value (US$ Million) Analysis and Forecast By Application, 2024 to 2034

        5.3.1. Point-of-Care Diagnostics

        5.3.2. Clinical Chemistry & Immunoassays

        5.3.3. Vaccinations

        5.3.4. Others

    5.4. Y-o-Y Growth Trend Analysis By Application, 2019 to 2023

    5.5. Absolute $ Opportunity Analysis By Application, 2024 to 2034

6. Global Market Analysis 2019 to 2023 and Forecast 2024 to 2034, By Distribution Channel

    6.1. Introduction / Key Findings

    6.2. Historical Market Size Value (US$ Million) Analysis By Distribution Channel, 2019 to 2023

    6.3. Current and Future Market Size Value (US$ Million) Analysis and Forecast By Distribution Channel, 2024 to 2034

        6.3.1. Retail Pharmacy Settings

        6.3.2. Drug Stores

        6.3.3. Grocery Chains & Big Box Stores

    6.4. Y-o-Y Growth Trend Analysis By Distribution Channel, 2019 to 2023

    6.5. Absolute $ Opportunity Analysis By Distribution Channel, 2024 to 2034

7. Global Market Analysis 2019 to 2023 and Forecast 2024 to 2034, By Ownership Type 

    7.1. Introduction / Key Findings

    7.2. Historical Market Size Value (US$ Million) Analysis By Ownership Type , 2019 to 2023

    7.3. Current and Future Market Size Value (US$ Million) Analysis and Forecast By Ownership Type , 2024 to 2034

        7.3.1. Hospital-owned Retail Clinics

        7.3.2. Retail-owned Retail Clinics

    7.4. Y-o-Y Growth Trend Analysis By Ownership Type , 2019 to 2023

    7.5. Absolute $ Opportunity Analysis By Ownership Type , 2024 to 2034

8. Global Market Analysis 2019 to 2023 and Forecast 2024 to 2034, By Region

    8.1. Introduction

    8.2. Historical Market Size Value (US$ Million) Analysis By Region, 2019 to 2023

    8.3. Current Market Size Value (US$ Million) Analysis and Forecast By Region, 2024 to 2034

        8.3.1. North America

        8.3.2. Latin America

        8.3.3. Western Europe

        8.3.4. Eastern Europe

        8.3.5. South Asia and Pacific

        8.3.6. East Asia

        8.3.7. Middle East and Africa

    8.4. Market Attractiveness Analysis By Region

9. North America Market Analysis 2019 to 2023 and Forecast 2024 to 2034, By Country

    9.1. Historical Market Size Value (US$ Million) Trend Analysis By Market Taxonomy, 2019 to 2023

    9.2. Market Size Value (US$ Million) Forecast By Market Taxonomy, 2024 to 2034

        9.2.1. By Country

            9.2.1.1. USA

            9.2.1.2. Canada

        9.2.2. By Application

        9.2.3. By Distribution Channel

        9.2.4. By Ownership Type

    9.3. Market Attractiveness Analysis

        9.3.1. By Country

        9.3.2. By Application

        9.3.3. By Distribution Channel

        9.3.4. By Ownership Type

    9.4. Key Takeaways

10. Latin America Market Analysis 2019 to 2023 and Forecast 2024 to 2034, By Country

    10.1. Historical Market Size Value (US$ Million) Trend Analysis By Market Taxonomy, 2019 to 2023

    10.2. Market Size Value (US$ Million) Forecast By Market Taxonomy, 2024 to 2034

        10.2.1. By Country

            10.2.1.1. Brazil

            10.2.1.2. Mexico

            10.2.1.3. Rest of Latin America

        10.2.2. By Application

        10.2.3. By Distribution Channel

        10.2.4. By Ownership Type

    10.3. Market Attractiveness Analysis

        10.3.1. By Country

        10.3.2. By Application

        10.3.3. By Distribution Channel

        10.3.4. By Ownership Type

    10.4. Key Takeaways

11. Western Europe Market Analysis 2019 to 2023 and Forecast 2024 to 2034, By Country

    11.1. Historical Market Size Value (US$ Million) Trend Analysis By Market Taxonomy, 2019 to 2023

    11.2. Market Size Value (US$ Million) Forecast By Market Taxonomy, 2024 to 2034

        11.2.1. By Country

            11.2.1.1. Germany

            11.2.1.2. UK

            11.2.1.3. France

            11.2.1.4. Spain

            11.2.1.5. Italy

            11.2.1.6. Rest of Western Europe

        11.2.2. By Application

        11.2.3. By Distribution Channel

        11.2.4. By Ownership Type

    11.3. Market Attractiveness Analysis

        11.3.1. By Country

        11.3.2. By Application

        11.3.3. By Distribution Channel

        11.3.4. By Ownership Type

    11.4. Key Takeaways

12. Eastern Europe Market Analysis 2019 to 2023 and Forecast 2024 to 2034, By Country

    12.1. Historical Market Size Value (US$ Million) Trend Analysis By Market Taxonomy, 2019 to 2023

    12.2. Market Size Value (US$ Million) Forecast By Market Taxonomy, 2024 to 2034

        12.2.1. By Country

            12.2.1.1. Poland

            12.2.1.2. Russia

            12.2.1.3. Czech Republic

            12.2.1.4. Romania

            12.2.1.5. Rest of Eastern Europe

        12.2.2. By Application

        12.2.3. By Distribution Channel

        12.2.4. By Ownership Type

    12.3. Market Attractiveness Analysis

        12.3.1. By Country

        12.3.2. By Application

        12.3.3. By Distribution Channel

        12.3.4. By Ownership Type

    12.4. Key Takeaways

13. South Asia and Pacific Market Analysis 2019 to 2023 and Forecast 2024 to 2034, By Country

    13.1. Historical Market Size Value (US$ Million) Trend Analysis By Market Taxonomy, 2019 to 2023

    13.2. Market Size Value (US$ Million) Forecast By Market Taxonomy, 2024 to 2034

        13.2.1. By Country

            13.2.1.1. India

            13.2.1.2. Bangladesh

            13.2.1.3. Australia

            13.2.1.4. New Zealand

            13.2.1.5. Rest of South Asia and Pacific

        13.2.2. By Application

        13.2.3. By Distribution Channel

        13.2.4. By Ownership Type

    13.3. Market Attractiveness Analysis

        13.3.1. By Country

        13.3.2. By Application

        13.3.3. By Distribution Channel

        13.3.4. By Ownership Type

    13.4. Key Takeaways

14. East Asia Market Analysis 2019 to 2023 and Forecast 2024 to 2034, By Country

    14.1. Historical Market Size Value (US$ Million) Trend Analysis By Market Taxonomy, 2019 to 2023

    14.2. Market Size Value (US$ Million) Forecast By Market Taxonomy, 2024 to 2034

        14.2.1. By Country

            14.2.1.1. China

            14.2.1.2. Japan

            14.2.1.3. South Korea

        14.2.2. By Application

        14.2.3. By Distribution Channel

        14.2.4. By Ownership Type

    14.3. Market Attractiveness Analysis

        14.3.1. By Country

        14.3.2. By Application

        14.3.3. By Distribution Channel

        14.3.4. By Ownership Type

    14.4. Key Takeaways

15. Middle East and Africa Market Analysis 2019 to 2023 and Forecast 2024 to 2034, By Country

    15.1. Historical Market Size Value (US$ Million) Trend Analysis By Market Taxonomy, 2019 to 2023

    15.2. Market Size Value (US$ Million) Forecast By Market Taxonomy, 2024 to 2034

        15.2.1. By Country

            15.2.1.1. GCC Countries

            15.2.1.2. South Africa

            15.2.1.3. Israel

            15.2.1.4. Rest of MEA

        15.2.2. By Application

        15.2.3. By Distribution Channel

        15.2.4. By Ownership Type

    15.3. Market Attractiveness Analysis

        15.3.1. By Country

        15.3.2. By Application

        15.3.3. By Distribution Channel

        15.3.4. By Ownership Type

    15.4. Key Takeaways

16. Key Countries Market Analysis

    16.1. USA

        16.1.1. Pricing Analysis

        16.1.2. Market Share Analysis, 2023

            16.1.2.1. By Application

            16.1.2.2. By Distribution Channel

            16.1.2.3. By Ownership Type

    16.2. Canada

        16.2.1. Pricing Analysis

        16.2.2. Market Share Analysis, 2023

            16.2.2.1. By Application

            16.2.2.2. By Distribution Channel

            16.2.2.3. By Ownership Type

    16.3. Brazil

        16.3.1. Pricing Analysis

        16.3.2. Market Share Analysis, 2023

            16.3.2.1. By Application

            16.3.2.2. By Distribution Channel

            16.3.2.3. By Ownership Type

    16.4. Mexico

        16.4.1. Pricing Analysis

        16.4.2. Market Share Analysis, 2023

            16.4.2.1. By Application

            16.4.2.2. By Distribution Channel

            16.4.2.3. By Ownership Type

    16.5. Germany

        16.5.1. Pricing Analysis

        16.5.2. Market Share Analysis, 2023

            16.5.2.1. By Application

            16.5.2.2. By Distribution Channel

            16.5.2.3. By Ownership Type

    16.6. UK

        16.6.1. Pricing Analysis

        16.6.2. Market Share Analysis, 2023

            16.6.2.1. By Application

            16.6.2.2. By Distribution Channel

            16.6.2.3. By Ownership Type

    16.7. France

        16.7.1. Pricing Analysis

        16.7.2. Market Share Analysis, 2023

            16.7.2.1. By Application

            16.7.2.2. By Distribution Channel

            16.7.2.3. By Ownership Type

    16.8. Spain

        16.8.1. Pricing Analysis

        16.8.2. Market Share Analysis, 2023

            16.8.2.1. By Application

            16.8.2.2. By Distribution Channel

            16.8.2.3. By Ownership Type

    16.9. Italy

        16.9.1. Pricing Analysis

        16.9.2. Market Share Analysis, 2023

            16.9.2.1. By Application

            16.9.2.2. By Distribution Channel

            16.9.2.3. By Ownership Type

    16.10. Poland

        16.10.1. Pricing Analysis

        16.10.2. Market Share Analysis, 2023

            16.10.2.1. By Application

            16.10.2.2. By Distribution Channel

            16.10.2.3. By Ownership Type

    16.11. Russia

        16.11.1. Pricing Analysis

        16.11.2. Market Share Analysis, 2023

            16.11.2.1. By Application

            16.11.2.2. By Distribution Channel

            16.11.2.3. By Ownership Type

    16.12. Czech Republic

        16.12.1. Pricing Analysis

        16.12.2. Market Share Analysis, 2023

            16.12.2.1. By Application

            16.12.2.2. By Distribution Channel

            16.12.2.3. By Ownership Type

    16.13. Romania

        16.13.1. Pricing Analysis

        16.13.2. Market Share Analysis, 2023

            16.13.2.1. By Application

            16.13.2.2. By Distribution Channel

            16.13.2.3. By Ownership Type

    16.14. India

        16.14.1. Pricing Analysis

        16.14.2. Market Share Analysis, 2023

            16.14.2.1. By Application

            16.14.2.2. By Distribution Channel

            16.14.2.3. By Ownership Type

    16.15. Bangladesh

        16.15.1. Pricing Analysis

        16.15.2. Market Share Analysis, 2023

            16.15.2.1. By Application

            16.15.2.2. By Distribution Channel

            16.15.2.3. By Ownership Type

    16.16. Australia

        16.16.1. Pricing Analysis

        16.16.2. Market Share Analysis, 2023

            16.16.2.1. By Application

            16.16.2.2. By Distribution Channel

            16.16.2.3. By Ownership Type

    16.17. New Zealand

        16.17.1. Pricing Analysis

        16.17.2. Market Share Analysis, 2023

            16.17.2.1. By Application

            16.17.2.2. By Distribution Channel

            16.17.2.3. By Ownership Type

    16.18. China

        16.18.1. Pricing Analysis

        16.18.2. Market Share Analysis, 2023

            16.18.2.1. By Application

            16.18.2.2. By Distribution Channel

            16.18.2.3. By Ownership Type

    16.19. Japan

        16.19.1. Pricing Analysis

        16.19.2. Market Share Analysis, 2023

            16.19.2.1. By Application

            16.19.2.2. By Distribution Channel

            16.19.2.3. By Ownership Type

    16.20. South Korea

        16.20.1. Pricing Analysis

        16.20.2. Market Share Analysis, 2023

            16.20.2.1. By Application

            16.20.2.2. By Distribution Channel

            16.20.2.3. By Ownership Type

    16.21. GCC Countries

        16.21.1. Pricing Analysis

        16.21.2. Market Share Analysis, 2023

            16.21.2.1. By Application

            16.21.2.2. By Distribution Channel

            16.21.2.3. By Ownership Type

    16.22. South Africa

        16.22.1. Pricing Analysis

        16.22.2. Market Share Analysis, 2023

            16.22.2.1. By Application

            16.22.2.2. By Distribution Channel

            16.22.2.3. By Ownership Type

    16.23. Israel

        16.23.1. Pricing Analysis

        16.23.2. Market Share Analysis, 2023

            16.23.2.1. By Application

            16.23.2.2. By Distribution Channel

            16.23.2.3. By Ownership Type

17. Market Structure Analysis

    17.1. Competition Dashboard

    17.2. Competition Benchmarking

    17.3. Market Share Analysis of Top Players

        17.3.1. By Regional

        17.3.2. By Application

        17.3.3. By Distribution Channel

        17.3.4. By Ownership Type

18. Competition Analysis

    18.1. Competition Deep Dive

        18.1.1. Access Health

            18.1.1.1. Overview

            18.1.1.2. Product Portfolio

            18.1.1.3. Profitability by Market Segments

            18.1.1.4. Sales Footprint

            18.1.1.5. Strategy Overview

                18.1.1.5.1. Marketing Strategy

        18.1.2. AtlantiCare

            18.1.2.1. Overview

            18.1.2.2. Product Portfolio

            18.1.2.3. Profitability by Market Segments

            18.1.2.4. Sales Footprint

            18.1.2.5. Strategy Overview

                18.1.2.5.1. Marketing Strategy

        18.1.3. Aurora Quick Care

            18.1.3.1. Overview

            18.1.3.2. Product Portfolio

            18.1.3.3. Profitability by Market Segments

            18.1.3.4. Sales Footprint

            18.1.3.5. Strategy Overview

                18.1.3.5.1. Marketing Strategy

        18.1.4. Target Brands Inc.

            18.1.4.1. Overview

            18.1.4.2. Product Portfolio

            18.1.4.3. Profitability by Market Segments

            18.1.4.4. Sales Footprint

            18.1.4.5. Strategy Overview

                18.1.4.5.1. Marketing Strategy

        18.1.5. Kroger

            18.1.5.1. Overview

            18.1.5.2. Product Portfolio

            18.1.5.3. Profitability by Market Segments

            18.1.5.4. Sales Footprint

            18.1.5.5. Strategy Overview

                18.1.5.5.1. Marketing Strategy

        18.1.6. Wellness Express

            18.1.6.1. Overview

            18.1.6.2. Product Portfolio

            18.1.6.3. Profitability by Market Segments

            18.1.6.4. Sales Footprint

            18.1.6.5. Strategy Overview

                18.1.6.5.1. Marketing Strategy

        18.1.7. Walgreens Boots Alliance

            18.1.7.1. Overview

            18.1.7.2. Product Portfolio

            18.1.7.3. Profitability by Market Segments

            18.1.7.4. Sales Footprint

            18.1.7.5. Strategy Overview

                18.1.7.5.1. Marketing Strategy

        18.1.8. Target Clinic Medical Associates

            18.1.8.1. Overview

            18.1.8.2. Product Portfolio

            18.1.8.3. Profitability by Market Segments

            18.1.8.4. Sales Footprint

            18.1.8.5. Strategy Overview

                18.1.8.5.1. Marketing Strategy

        18.1.9. RediClinic

            18.1.9.1. Overview

            18.1.9.2. Product Portfolio

            18.1.9.3. Profitability by Market Segments

            18.1.9.4. Sales Footprint

            18.1.9.5. Strategy Overview

                18.1.9.5.1. Marketing Strategy

        18.1.10. Now Medical Centers

            18.1.10.1. Overview

            18.1.10.2. Product Portfolio

            18.1.10.3. Profitability by Market Segments

            18.1.10.4. Sales Footprint

            18.1.10.5. Strategy Overview

                18.1.10.5.1. Marketing Strategy

19. Assumptions & Acronyms Used

20. Research Methodology

Don't pay for what you don't need

Customize your report by selecting specific countries or regions and save 30%!

List of Tables

Table 1: Global Market Value (US$ Million) Forecast by Region, 2019 to 2034

Table 2: Global Market Value (US$ Million) Forecast by Application, 2019 to 2034

Table 3: Global Market Value (US$ Million) Forecast by Distribution Channel, 2019 to 2034

Table 4: Global Market Value (US$ Million) Forecast by Ownership Type , 2019 to 2034

Table 5: North America Market Value (US$ Million) Forecast by Country, 2019 to 2034

Table 6: North America Market Value (US$ Million) Forecast by Application, 2019 to 2034

Table 7: North America Market Value (US$ Million) Forecast by Distribution Channel, 2019 to 2034

Table 8: North America Market Value (US$ Million) Forecast by Ownership Type , 2019 to 2034

Table 9: Latin America Market Value (US$ Million) Forecast by Country, 2019 to 2034

Table 10: Latin America Market Value (US$ Million) Forecast by Application, 2019 to 2034

Table 11: Latin America Market Value (US$ Million) Forecast by Distribution Channel, 2019 to 2034

Table 12: Latin America Market Value (US$ Million) Forecast by Ownership Type , 2019 to 2034

Table 13: Western Europe Market Value (US$ Million) Forecast by Country, 2019 to 2034

Table 14: Western Europe Market Value (US$ Million) Forecast by Application, 2019 to 2034

Table 15: Western Europe Market Value (US$ Million) Forecast by Distribution Channel, 2019 to 2034

Table 16: Western Europe Market Value (US$ Million) Forecast by Ownership Type , 2019 to 2034

Table 17: Eastern Europe Market Value (US$ Million) Forecast by Country, 2019 to 2034

Table 18: Eastern Europe Market Value (US$ Million) Forecast by Application, 2019 to 2034

Table 19: Eastern Europe Market Value (US$ Million) Forecast by Distribution Channel, 2019 to 2034

Table 20: Eastern Europe Market Value (US$ Million) Forecast by Ownership Type , 2019 to 2034

Table 21: South Asia and Pacific Market Value (US$ Million) Forecast by Country, 2019 to 2034

Table 22: South Asia and Pacific Market Value (US$ Million) Forecast by Application, 2019 to 2034

Table 23: South Asia and Pacific Market Value (US$ Million) Forecast by Distribution Channel, 2019 to 2034

Table 24: South Asia and Pacific Market Value (US$ Million) Forecast by Ownership Type , 2019 to 2034

Table 25: East Asia Market Value (US$ Million) Forecast by Country, 2019 to 2034

Table 26: East Asia Market Value (US$ Million) Forecast by Application, 2019 to 2034

Table 27: East Asia Market Value (US$ Million) Forecast by Distribution Channel, 2019 to 2034

Table 28: East Asia Market Value (US$ Million) Forecast by Ownership Type , 2019 to 2034

Table 29: Middle East and Africa Market Value (US$ Million) Forecast by Country, 2019 to 2034

Table 30: Middle East and Africa Market Value (US$ Million) Forecast by Application, 2019 to 2034

Table 31: Middle East and Africa Market Value (US$ Million) Forecast by Distribution Channel, 2019 to 2034

Table 32: Middle East and Africa Market Value (US$ Million) Forecast by Ownership Type , 2019 to 2034
Sabyasachi Ghosh
Sabyasachi Ghosh

Principal Consultant

Talk to Analyst

Find your sweet spots for generating winning opportunities in this market.

List of Charts

Figure 1: Global Market Value (US$ Million) by Application, 2024 to 2034

Figure 2: Global Market Value (US$ Million) by Distribution Channel, 2024 to 2034

Figure 3: Global Market Value (US$ Million) by Ownership Type , 2024 to 2034

Figure 4: Global Market Value (US$ Million) by Region, 2024 to 2034

Figure 5: Global Market Value (US$ Million) Analysis by Region, 2019 to 2034

Figure 6: Global Market Value Share (%) and BPS Analysis by Region, 2024 to 2034

Figure 7: Global Market Y-o-Y Growth (%) Projections by Region, 2024 to 2034

Figure 8: Global Market Value (US$ Million) Analysis by Application, 2019 to 2034

Figure 9: Global Market Value Share (%) and BPS Analysis by Application, 2024 to 2034

Figure 10: Global Market Y-o-Y Growth (%) Projections by Application, 2024 to 2034

Figure 11: Global Market Value (US$ Million) Analysis by Distribution Channel, 2019 to 2034

Figure 12: Global Market Value Share (%) and BPS Analysis by Distribution Channel, 2024 to 2034

Figure 13: Global Market Y-o-Y Growth (%) Projections by Distribution Channel, 2024 to 2034

Figure 14: Global Market Value (US$ Million) Analysis by Ownership Type , 2019 to 2034

Figure 15: Global Market Value Share (%) and BPS Analysis by Ownership Type , 2024 to 2034

Figure 16: Global Market Y-o-Y Growth (%) Projections by Ownership Type , 2024 to 2034

Figure 17: Global Market Attractiveness by Application, 2024 to 2034

Figure 18: Global Market Attractiveness by Distribution Channel, 2024 to 2034

Figure 19: Global Market Attractiveness by Ownership Type , 2024 to 2034

Figure 20: Global Market Attractiveness by Region, 2024 to 2034

Figure 21: North America Market Value (US$ Million) by Application, 2024 to 2034

Figure 22: North America Market Value (US$ Million) by Distribution Channel, 2024 to 2034

Figure 23: North America Market Value (US$ Million) by Ownership Type , 2024 to 2034

Figure 24: North America Market Value (US$ Million) by Country, 2024 to 2034

Figure 25: North America Market Value (US$ Million) Analysis by Country, 2019 to 2034

Figure 26: North America Market Value Share (%) and BPS Analysis by Country, 2024 to 2034

Figure 27: North America Market Y-o-Y Growth (%) Projections by Country, 2024 to 2034

Figure 28: North America Market Value (US$ Million) Analysis by Application, 2019 to 2034

Figure 29: North America Market Value Share (%) and BPS Analysis by Application, 2024 to 2034

Figure 30: North America Market Y-o-Y Growth (%) Projections by Application, 2024 to 2034

Figure 31: North America Market Value (US$ Million) Analysis by Distribution Channel, 2019 to 2034

Figure 32: North America Market Value Share (%) and BPS Analysis by Distribution Channel, 2024 to 2034

Figure 33: North America Market Y-o-Y Growth (%) Projections by Distribution Channel, 2024 to 2034

Figure 34: North America Market Value (US$ Million) Analysis by Ownership Type , 2019 to 2034

Figure 35: North America Market Value Share (%) and BPS Analysis by Ownership Type , 2024 to 2034

Figure 36: North America Market Y-o-Y Growth (%) Projections by Ownership Type , 2024 to 2034

Figure 37: North America Market Attractiveness by Application, 2024 to 2034

Figure 38: North America Market Attractiveness by Distribution Channel, 2024 to 2034

Figure 39: North America Market Attractiveness by Ownership Type , 2024 to 2034

Figure 40: North America Market Attractiveness by Country, 2024 to 2034

Figure 41: Latin America Market Value (US$ Million) by Application, 2024 to 2034

Figure 42: Latin America Market Value (US$ Million) by Distribution Channel, 2024 to 2034

Figure 43: Latin America Market Value (US$ Million) by Ownership Type , 2024 to 2034

Figure 44: Latin America Market Value (US$ Million) by Country, 2024 to 2034

Figure 45: Latin America Market Value (US$ Million) Analysis by Country, 2019 to 2034

Figure 46: Latin America Market Value Share (%) and BPS Analysis by Country, 2024 to 2034

Figure 47: Latin America Market Y-o-Y Growth (%) Projections by Country, 2024 to 2034

Figure 48: Latin America Market Value (US$ Million) Analysis by Application, 2019 to 2034

Figure 49: Latin America Market Value Share (%) and BPS Analysis by Application, 2024 to 2034

Figure 50: Latin America Market Y-o-Y Growth (%) Projections by Application, 2024 to 2034

Figure 51: Latin America Market Value (US$ Million) Analysis by Distribution Channel, 2019 to 2034

Figure 52: Latin America Market Value Share (%) and BPS Analysis by Distribution Channel, 2024 to 2034

Figure 53: Latin America Market Y-o-Y Growth (%) Projections by Distribution Channel, 2024 to 2034

Figure 54: Latin America Market Value (US$ Million) Analysis by Ownership Type , 2019 to 2034

Figure 55: Latin America Market Value Share (%) and BPS Analysis by Ownership Type , 2024 to 2034

Figure 56: Latin America Market Y-o-Y Growth (%) Projections by Ownership Type , 2024 to 2034

Figure 57: Latin America Market Attractiveness by Application, 2024 to 2034

Figure 58: Latin America Market Attractiveness by Distribution Channel, 2024 to 2034

Figure 59: Latin America Market Attractiveness by Ownership Type , 2024 to 2034

Figure 60: Latin America Market Attractiveness by Country, 2024 to 2034

Figure 61: Western Europe Market Value (US$ Million) by Application, 2024 to 2034

Figure 62: Western Europe Market Value (US$ Million) by Distribution Channel, 2024 to 2034

Figure 63: Western Europe Market Value (US$ Million) by Ownership Type , 2024 to 2034

Figure 64: Western Europe Market Value (US$ Million) by Country, 2024 to 2034

Figure 65: Western Europe Market Value (US$ Million) Analysis by Country, 2019 to 2034

Figure 66: Western Europe Market Value Share (%) and BPS Analysis by Country, 2024 to 2034

Figure 67: Western Europe Market Y-o-Y Growth (%) Projections by Country, 2024 to 2034

Figure 68: Western Europe Market Value (US$ Million) Analysis by Application, 2019 to 2034

Figure 69: Western Europe Market Value Share (%) and BPS Analysis by Application, 2024 to 2034

Figure 70: Western Europe Market Y-o-Y Growth (%) Projections by Application, 2024 to 2034

Figure 71: Western Europe Market Value (US$ Million) Analysis by Distribution Channel, 2019 to 2034

Figure 72: Western Europe Market Value Share (%) and BPS Analysis by Distribution Channel, 2024 to 2034

Figure 73: Western Europe Market Y-o-Y Growth (%) Projections by Distribution Channel, 2024 to 2034

Figure 74: Western Europe Market Value (US$ Million) Analysis by Ownership Type , 2019 to 2034

Figure 75: Western Europe Market Value Share (%) and BPS Analysis by Ownership Type , 2024 to 2034

Figure 76: Western Europe Market Y-o-Y Growth (%) Projections by Ownership Type , 2024 to 2034

Figure 77: Western Europe Market Attractiveness by Application, 2024 to 2034

Figure 78: Western Europe Market Attractiveness by Distribution Channel, 2024 to 2034

Figure 79: Western Europe Market Attractiveness by Ownership Type , 2024 to 2034

Figure 80: Western Europe Market Attractiveness by Country, 2024 to 2034

Figure 81: Eastern Europe Market Value (US$ Million) by Application, 2024 to 2034

Figure 82: Eastern Europe Market Value (US$ Million) by Distribution Channel, 2024 to 2034

Figure 83: Eastern Europe Market Value (US$ Million) by Ownership Type , 2024 to 2034

Figure 84: Eastern Europe Market Value (US$ Million) by Country, 2024 to 2034

Figure 85: Eastern Europe Market Value (US$ Million) Analysis by Country, 2019 to 2034

Figure 86: Eastern Europe Market Value Share (%) and BPS Analysis by Country, 2024 to 2034

Figure 87: Eastern Europe Market Y-o-Y Growth (%) Projections by Country, 2024 to 2034

Figure 88: Eastern Europe Market Value (US$ Million) Analysis by Application, 2019 to 2034

Figure 89: Eastern Europe Market Value Share (%) and BPS Analysis by Application, 2024 to 2034

Figure 90: Eastern Europe Market Y-o-Y Growth (%) Projections by Application, 2024 to 2034

Figure 91: Eastern Europe Market Value (US$ Million) Analysis by Distribution Channel, 2019 to 2034

Figure 92: Eastern Europe Market Value Share (%) and BPS Analysis by Distribution Channel, 2024 to 2034

Figure 93: Eastern Europe Market Y-o-Y Growth (%) Projections by Distribution Channel, 2024 to 2034

Figure 94: Eastern Europe Market Value (US$ Million) Analysis by Ownership Type , 2019 to 2034

Figure 95: Eastern Europe Market Value Share (%) and BPS Analysis by Ownership Type , 2024 to 2034

Figure 96: Eastern Europe Market Y-o-Y Growth (%) Projections by Ownership Type , 2024 to 2034

Figure 97: Eastern Europe Market Attractiveness by Application, 2024 to 2034

Figure 98: Eastern Europe Market Attractiveness by Distribution Channel, 2024 to 2034

Figure 99: Eastern Europe Market Attractiveness by Ownership Type , 2024 to 2034

Figure 100: Eastern Europe Market Attractiveness by Country, 2024 to 2034

Figure 101: South Asia and Pacific Market Value (US$ Million) by Application, 2024 to 2034

Figure 102: South Asia and Pacific Market Value (US$ Million) by Distribution Channel, 2024 to 2034

Figure 103: South Asia and Pacific Market Value (US$ Million) by Ownership Type , 2024 to 2034

Figure 104: South Asia and Pacific Market Value (US$ Million) by Country, 2024 to 2034

Figure 105: South Asia and Pacific Market Value (US$ Million) Analysis by Country, 2019 to 2034

Figure 106: South Asia and Pacific Market Value Share (%) and BPS Analysis by Country, 2024 to 2034

Figure 107: South Asia and Pacific Market Y-o-Y Growth (%) Projections by Country, 2024 to 2034

Figure 108: South Asia and Pacific Market Value (US$ Million) Analysis by Application, 2019 to 2034

Figure 109: South Asia and Pacific Market Value Share (%) and BPS Analysis by Application, 2024 to 2034

Figure 110: South Asia and Pacific Market Y-o-Y Growth (%) Projections by Application, 2024 to 2034

Figure 111: South Asia and Pacific Market Value (US$ Million) Analysis by Distribution Channel, 2019 to 2034

Figure 112: South Asia and Pacific Market Value Share (%) and BPS Analysis by Distribution Channel, 2024 to 2034

Figure 113: South Asia and Pacific Market Y-o-Y Growth (%) Projections by Distribution Channel, 2024 to 2034

Figure 114: South Asia and Pacific Market Value (US$ Million) Analysis by Ownership Type , 2019 to 2034

Figure 115: South Asia and Pacific Market Value Share (%) and BPS Analysis by Ownership Type , 2024 to 2034

Figure 116: South Asia and Pacific Market Y-o-Y Growth (%) Projections by Ownership Type , 2024 to 2034

Figure 117: South Asia and Pacific Market Attractiveness by Application, 2024 to 2034

Figure 118: South Asia and Pacific Market Attractiveness by Distribution Channel, 2024 to 2034

Figure 119: South Asia and Pacific Market Attractiveness by Ownership Type , 2024 to 2034

Figure 120: South Asia and Pacific Market Attractiveness by Country, 2024 to 2034

Figure 121: East Asia Market Value (US$ Million) by Application, 2024 to 2034

Figure 122: East Asia Market Value (US$ Million) by Distribution Channel, 2024 to 2034

Figure 123: East Asia Market Value (US$ Million) by Ownership Type , 2024 to 2034

Figure 124: East Asia Market Value (US$ Million) by Country, 2024 to 2034

Figure 125: East Asia Market Value (US$ Million) Analysis by Country, 2019 to 2034

Figure 126: East Asia Market Value Share (%) and BPS Analysis by Country, 2024 to 2034

Figure 127: East Asia Market Y-o-Y Growth (%) Projections by Country, 2024 to 2034

Figure 128: East Asia Market Value (US$ Million) Analysis by Application, 2019 to 2034

Figure 129: East Asia Market Value Share (%) and BPS Analysis by Application, 2024 to 2034

Figure 130: East Asia Market Y-o-Y Growth (%) Projections by Application, 2024 to 2034

Figure 131: East Asia Market Value (US$ Million) Analysis by Distribution Channel, 2019 to 2034

Figure 132: East Asia Market Value Share (%) and BPS Analysis by Distribution Channel, 2024 to 2034

Figure 133: East Asia Market Y-o-Y Growth (%) Projections by Distribution Channel, 2024 to 2034

Figure 134: East Asia Market Value (US$ Million) Analysis by Ownership Type , 2019 to 2034

Figure 135: East Asia Market Value Share (%) and BPS Analysis by Ownership Type , 2024 to 2034

Figure 136: East Asia Market Y-o-Y Growth (%) Projections by Ownership Type , 2024 to 2034

Figure 137: East Asia Market Attractiveness by Application, 2024 to 2034

Figure 138: East Asia Market Attractiveness by Distribution Channel, 2024 to 2034

Figure 139: East Asia Market Attractiveness by Ownership Type , 2024 to 2034

Figure 140: East Asia Market Attractiveness by Country, 2024 to 2034

Figure 141: Middle East and Africa Market Value (US$ Million) by Application, 2024 to 2034

Figure 142: Middle East and Africa Market Value (US$ Million) by Distribution Channel, 2024 to 2034

Figure 143: Middle East and Africa Market Value (US$ Million) by Ownership Type , 2024 to 2034

Figure 144: Middle East and Africa Market Value (US$ Million) by Country, 2024 to 2034

Figure 145: Middle East and Africa Market Value (US$ Million) Analysis by Country, 2019 to 2034

Figure 146: Middle East and Africa Market Value Share (%) and BPS Analysis by Country, 2024 to 2034

Figure 147: Middle East and Africa Market Y-o-Y Growth (%) Projections by Country, 2024 to 2034

Figure 148: Middle East and Africa Market Value (US$ Million) Analysis by Application, 2019 to 2034

Figure 149: Middle East and Africa Market Value Share (%) and BPS Analysis by Application, 2024 to 2034

Figure 150: Middle East and Africa Market Y-o-Y Growth (%) Projections by Application, 2024 to 2034

Figure 151: Middle East and Africa Market Value (US$ Million) Analysis by Distribution Channel, 2019 to 2034

Figure 152: Middle East and Africa Market Value Share (%) and BPS Analysis by Distribution Channel, 2024 to 2034

Figure 153: Middle East and Africa Market Y-o-Y Growth (%) Projections by Distribution Channel, 2024 to 2034

Figure 154: Middle East and Africa Market Value (US$ Million) Analysis by Ownership Type , 2019 to 2034

Figure 155: Middle East and Africa Market Value Share (%) and BPS Analysis by Ownership Type , 2024 to 2034

Figure 156: Middle East and Africa Market Y-o-Y Growth (%) Projections by Ownership Type , 2024 to 2034

Figure 157: Middle East and Africa Market Attractiveness by Application, 2024 to 2034

Figure 158: Middle East and Africa Market Attractiveness by Distribution Channel, 2024 to 2034

Figure 159: Middle East and Africa Market Attractiveness by Ownership Type , 2024 to 2034

Figure 160: Middle East and Africa Market Attractiveness by Country, 2024 to 2034

Recommendations

Healthcare

Mobile Clinic Market

Published : March 2024

Healthcare

Outpatient Clinics Market

Published : October 2023

Explore Healthcare Insights

View Reports