The Retail E-Commerce Packaging Market is estimated to be valued at USD 19.4 billion in 2025 and is projected to reach USD 30.9 billion by 2035, registering a compound annual growth rate (CAGR) of 4.8% over the forecast period.
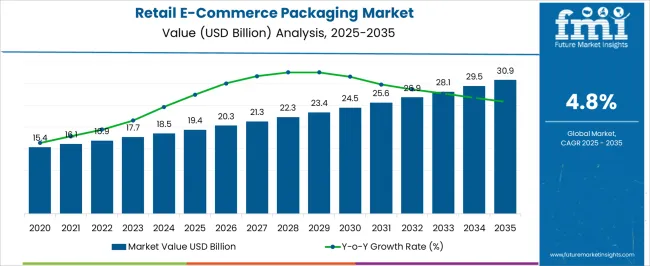
| Metric | Value |
|---|---|
| Retail E-Commerce Packaging Market Estimated Value in (2025 E) | USD 19.4 billion |
| Retail E-Commerce Packaging Market Forecast Value in (2035 F) | USD 30.9 billion |
| Forecast CAGR (2025 to 2035) | 4.8% |
The Retail E-Commerce Packaging market is experiencing rapid growth due to the accelerating expansion of online retail, rising consumer expectations for timely and safe deliveries, and increasing adoption of sustainable and innovative packaging solutions. The current market scenario reflects significant demand from sectors requiring protective and functional packaging that ensures product integrity throughout the logistics chain. Technological advancements in packaging materials, combined with smart packaging designs, have enhanced operational efficiency and reduced damages during transit.
The growth of third-party fulfillment and logistics services has further amplified the need for standardized, scalable packaging solutions that can support high-volume operations. Rising investments in warehouse automation, supply chain digitization, and omnichannel retail strategies are shaping the future outlook for the market.
As e-commerce penetration continues to deepen across emerging and developed regions, opportunities are expected in specialized packaging solutions tailored to different merchandise types and in cost-effective protective materials that balance sustainability with durability Overall, the market is positioned for long-term expansion driven by evolving consumer behavior and logistics innovation.
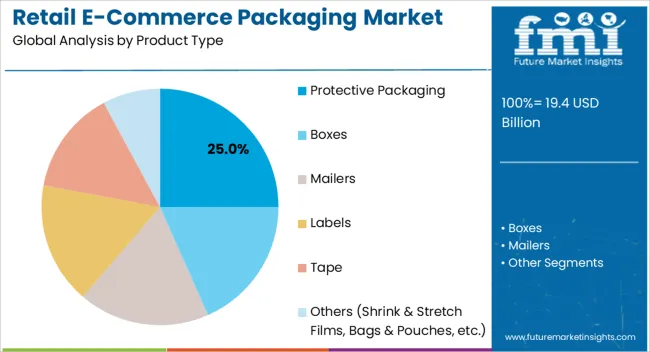
The protective packaging product type is projected to hold 25.0% of the Retail E-Commerce Packaging market revenue share in 2025, establishing it as the leading product type. This dominance is being driven by the critical need to safeguard products during storage, handling, and transportation in increasingly complex supply chains. Protective packaging is favored because it minimizes the risk of product damage, reduces returns, and enhances customer satisfaction, which is crucial in the competitive e-commerce environment.
The segment has grown rapidly due to the increasing shipment of fragile and high-value items that demand reliable cushioning and protective materials. Furthermore, the adaptability of protective packaging to different product sizes and formats has made it a versatile solution for e-commerce operators.
The rising focus on sustainable and recyclable protective materials has also contributed to its adoption As the e-commerce ecosystem continues to expand, the protective packaging segment is expected to maintain its leading position by offering durability, customization, and operational efficiency for large-scale distribution networks.
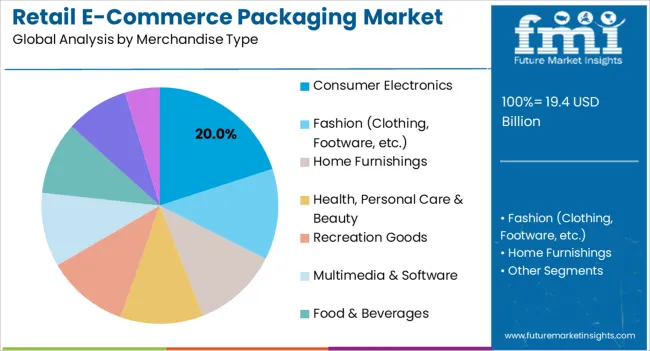
The consumer electronics merchandise type is anticipated to account for 20.0% of the Retail E-Commerce Packaging market revenue share in 2025, positioning it as the top merchandise type in terms of revenue contribution. This growth is being fueled by the increasing online sales of smartphones, computers, home appliances, and wearable devices, which require specialized packaging to prevent damage and ensure safe delivery.
Consumer electronics packaging is highly dependent on materials that provide shock absorption, anti-static properties, and structural integrity during transit. The segment’s growth has been supported by evolving consumer expectations for premium unboxing experiences, combined with the need to protect high-value products against theft and mishandling.
The flexibility of packaging solutions that can be customized for varying product dimensions and operational efficiency has reinforced the adoption of this segment With continuous technological advancements in both packaging materials and logistics solutions, consumer electronics packaging is expected to sustain its leading revenue share by addressing safety, durability, and consumer satisfaction in online retail transactions.
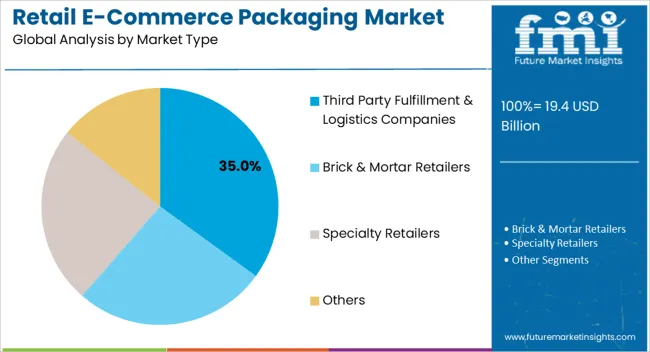
The third-party fulfillment and logistics companies market type is expected to hold 35.0% of the Retail E-Commerce Packaging market revenue share in 2025, emerging as the largest end-user segment. This leadership is being driven by the rapid outsourcing of warehousing, fulfillment, and delivery operations to specialized logistics providers to manage growing e-commerce volumes.
The segment has been favored because third-party operators require standardized, scalable, and cost-effective packaging solutions to optimize efficiency, reduce damages, and ensure timely deliveries. The growth has been supported by rising investments in automated sorting, inventory management, and packaging technologies within fulfillment centers.
Additionally, the need to handle diverse merchandise types across multiple e-commerce platforms has reinforced the adoption of versatile packaging materials and designs As the e-commerce ecosystem continues to grow and global logistics networks expand, third-party fulfillment and logistics companies are expected to remain the primary driver of packaging demand due to their central role in high-volume, reliable distribution operations.
The global demand for retail e-commerce packaging is projected to increase at a CAGR of 2.6% during the forecast period between 2020 and 2025, reaching a total of USD 30.9 billion in 2035.
According to Future Market Insights, a market research and competitive intelligence provider, the retail e-commerce packaging market was valued at USD 19.4 billion in 2025.
Consumers are increasingly conscious of the environmental impact of packaging waste. They expect retailers to adopt sustainable packaging solutions that minimize waste and utilize eco-friendly materials. Environmentally conscious consumers favor packaging that is recyclable, made from recycled content, biodegradable, or compostable. Retailers are responding by investing in sustainable packaging options, such as corrugated boxes made from recycled materials, paper-based alternatives to plastic packaging, and minimalistic designs that reduce material usage. Retailers can appeal to environmentally conscious consumers and strengthen their brand image, by aligning packaging with sustainability preferences.
Visual appeal is another aspect of evolving consumer expectations. Modern consumers seek visually appealing packaging that enhances the overall unboxing experience. They appreciate thoughtful and aesthetically pleasing designs that create a memorable first impression. Retailers invest in high-quality printing techniques, custom branding, and unique packaging designs to create visually engaging packaging solutions. Customized packaging with eye-catching visuals, vibrant colors, and engaging graphics can leave a lasting impression on consumers, fostering brand loyalty and positive word-of-mouth.
Functionality is also critical in meeting consumer expectations. Consumers expect packaging that not only looks good but also serves a practical purpose. They want packaging that protects their purchases during transit and ensures the products arrive in perfect condition. Retailers are mindful of this and invest in packaging materials that offer durability and shock resistance. Easy-to-open packaging designs and intuitive assembly instructions contribute to a positive consumer experience. Retailers understand that functional packaging instills confidence in consumers, reducing the risk of damaged products and increasing customer satisfaction.
Customization and personalization are further elements of evolving consumer expectations. Consumers appreciate packaging solutions that make them feel valued and offer a personalized touch. Retailers can achieve this by incorporating personalized messages, thank-you notes, or even small gifts in the packaging. Customization options, such as allowing customers to choose specific packaging designs or add personalized messages, further enhance the personalization aspect. Retailers can create a sense of connection and build stronger relationships with their audience, by tailoring the packaging experience to individual customers.
Increased Online Shopping Penetration is Likely to be Beneficial for Market Growth
Increased online shopping penetration has been a prominent trend in recent years. Consumers are increasingly embracing the convenience, accessibility, and variety offered by online retail, resulting in a surge in e-commerce sales. The substantial growth in online shopping penetration has significant implications for the retail e-commerce packaging market.
One of the primary impacts of increased online shopping is the surge in the volume of orders being placed online. Retailers and e-commerce platforms are experiencing a higher influx of orders to fulfill, with more consumers opting for online purchases. The surge in demand necessitates efficient and reliable packaging solutions that can accommodate the growing volume of online orders. Retailers must ensure that their packaging can effectively protect the products during transit, reducing the risk of damage or returns.
Efficiency in packaging becomes crucial as retailers strive to meet the demand for timely order fulfillment. Streamlining the packaging process and optimizing packaging materials can help improve operational efficiency, reduce packaging time, and enable faster order processing, which may involve investing in automated packaging systems, right-sizing packaging to minimize waste, and implementing standardized packaging processes. The need for efficient packaging solutions aligns with the goal of retailers to provide a seamless online shopping experience to their customers.
Advancements in Packaging Technology to Fuel the Market Growth
Advancements in packaging materials have led to the development of lightweight, high-strength, and eco-friendly options. For instance, the introduction of corrugated boards made from recycled fibers or renewable resources has reduced the environmental impact of packaging. Lightweight materials not only reduce shipping costs but also contribute to lower carbon emissions during transportation. Materials with enhanced barrier properties improve product protection, reducing the risk of damage during transit.
Packaging technology has played a crucial role in addressing the growing demand for sustainable packaging in the retail e-commerce sector. Innovations in materials, such as bio-based plastics, compostable films, and recyclable options, have enabled retailers to adopt more eco-friendly packaging alternatives. The sustainable packaging solutions help reduce waste, lower carbon footprint, and align with consumer preferences for environmentally conscious practices.
Packaging technology advancements have also enhanced the design and customization capabilities of retail e-commerce packaging. Computer-aided design (CAD) software and digital printing technologies allow for intricate designs, vibrant colors, and personalized branding options. Retailers can now create visually appealing packaging solutions that reflect their brand identity, engage customers, and differentiate themselves in a competitive market. Customization options enable retailers to tailor packaging to specific product requirements and customer preferences, further enhancing the consumer experience.
Protective Packaging to Take the Lion’s Share
The protective packaging segment followed by the boxes segment is majorly preferred retail e-commerce packaging type by the end-users. Both segments collectively hold approximately 5/8th portion of the retail e-commerce packaging market by the end of 2035, and is estimated to create an incremental opportunity of USD 3.8 billion during the forecast period. The segment is expected to hold a CAGR of 4.9% during the forecast period.
Fashion to Take the Lion’s Share
The fashion segment under the merchandise type generates heavy demand for retail e-commerce packaging. The same segment is estimated to hold around 30% of the market value share by the end of 2035, and is projected to expand 1.3 times the current market value by the end of 2035. The segment is expected to hold a CAGR of 4.8% during the forecast period.
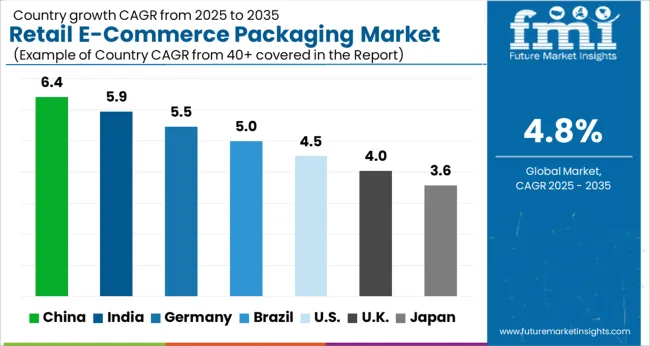
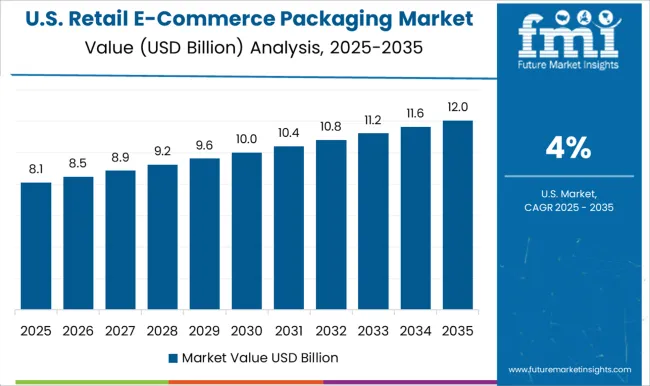
Increasing Sales of eCommerce Sector to Boost the Market Growth
The major portion of the North American retail e-commerce packaging market is captured by the United States, which accounts for 3/4th of the North American retail e-commerce packaging market, and is expected to create an incremental opportunity of USD 645 million during the forecast period.
The global e-commerce sales jumped to USD 26.7 trillion in 2020, according to the United Nations Conference on Trade and Development (UNCTAD), and the United States remained at the leading position in the e-commerce market.
The total e-commerce sales in the United States were USD 9.6 trillion. The retail sales in the United States grew by around 6.7% in 2024, according to the National Retail Federation (NRF), which indicates the growth opportunity for the retail e-commerce packaging market in the United States. The country is expected to hold a CAGR of 4.9% over the analysis period.
Growing eCommerce Sector to Boost the Market Growth
Mexico is anticipated to remains the growing country generating revenue across Latin America for the retail e-commerce market. Mexico retail e-commerce packaging market is projected to expand 1.4 times the current market value by the end of 2035.
According to the Mexican Online Sales Association, in 2024, domestic e-commerce in Mexico valued at USD 15.4 billion saw an increase of over 80 per cent from 2020. E-commerce users in Mexico also increased by 9% in 2024 from 2020. The expanding e-commerce sector in Mexico is bolstering the growth of the retail e-commerce packaging market. The country is expected to hold a CAGR of 4.8% over the analysis period.
Retail e-commerce packaging market startup players are adopting various marketing strategies such as new product launches, geographical expansion, merger and acquisitions, partnerships and collaboration to create a larger customer base. For instance,
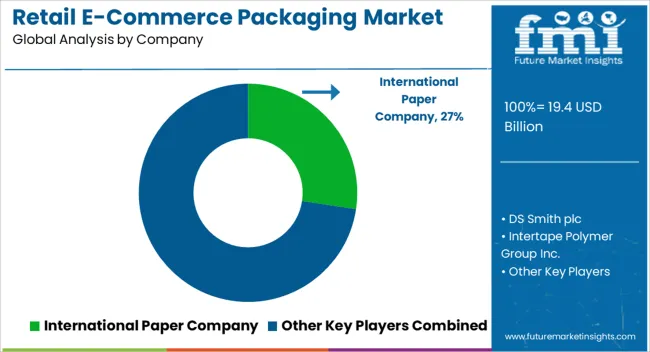
Key players in the retail e-commerce packaging market are strongly focusing on profit generation from their existing product portfolios along while exploring potential new applications. The players are emphasizing on increasing their retail e-commerce packaging production capacities, to cater to the demand from numerous end use industries. Prominent players are also pushing for geographical expansion to decrease the dependency on imported retail e-commerce packaging.
Recent Developments:
| Attribute | Details |
|---|---|
| Forecast Period | 2025 to 2035 |
| Historical Data Available for | 2020 to 2025 |
| Market Analysis | USD Million for value and Tons for Volume |
| Key Regions Covered | North America; Latin America; Western Europe; Eastern Europe; South Asia & Pacific; East Asia; and Middle East & Africa |
| Key Countries Covered | United States, Canada, Brazil, Mexico, Germany, United Kingdom, France, Spain, Italy, Poland, Russia, Czech Republic, Romania, India, Bangladesh, Australia, New Zealand, China, Japan, South Korea, GCC Countries, South Africa, Israel. |
| Key Segments Covered | Product Type, Merchandise Type, Market Type and Region |
| Key Companies Profiled | DS Smith plc; Intertape Polymer Group Inc.; Georgic-Pacific LLC; International Paper Company; Mondi plc.; Sealed Air Corporation; 3M Company; WestRock Company; Pregis Corporation; Smurfit Kappa Group; Packaging Corporation of America; Ventapel; NIPPON PAPER INDUSTRIES CO., LTD.; DynaCorp; Orora Packaging Australia Pty Ltd. |
| Report Coverage | Market Forecast, brand share analysis, competition intelligence, DROT analysis, Market Dynamics and Challenges, Strategic Growth Initiatives |
| Customization & Pricing | Available upon Request |
The global retail e-commerce packaging market is estimated to be valued at USD 19.4 billion in 2025.
The market size for the retail e-commerce packaging market is projected to reach USD 30.9 billion by 2035.
The retail e-commerce packaging market is expected to grow at a 4.8% CAGR between 2025 and 2035.
The key product types in retail e-commerce packaging market are protective packaging, boxes, mailers, labels, tape and others (shrink & stretch films, bags & pouches, etc.).
In terms of merchandise type, consumer electronics segment to command 20.0% share in the retail e-commerce packaging market in 2025.


Our Research Products

The "Full Research Suite" delivers actionable market intel, deep dives on markets or technologies, so clients act faster, cut risk, and unlock growth.

The Leaderboard benchmarks and ranks top vendors, classifying them as Established Leaders, Leading Challengers, or Disruptors & Challengers.

Locates where complements amplify value and substitutes erode it, forecasting net impact by horizon

We deliver granular, decision-grade intel: market sizing, 5-year forecasts, pricing, adoption, usage, revenue, and operational KPIs—plus competitor tracking, regulation, and value chains—across 60 countries broadly.

Spot the shifts before they hit your P&L. We track inflection points, adoption curves, pricing moves, and ecosystem plays to show where demand is heading, why it is changing, and what to do next across high-growth markets and disruptive tech

Real-time reads of user behavior. We track shifting priorities, perceptions of today’s and next-gen services, and provider experience, then pace how fast tech moves from trial to adoption, blending buyer, consumer, and channel inputs with social signals (#WhySwitch, #UX).

Partner with our analyst team to build a custom report designed around your business priorities. From analysing market trends to assessing competitors or crafting bespoke datasets, we tailor insights to your needs.
Supplier Intelligence
Discovery & Profiling
Capacity & Footprint
Performance & Risk
Compliance & Governance
Commercial Readiness
Who Supplies Whom
Scorecards & Shortlists
Playbooks & Docs
Category Intelligence
Definition & Scope
Demand & Use Cases
Cost Drivers
Market Structure
Supply Chain Map
Trade & Policy
Operating Norms
Deliverables
Buyer Intelligence
Account Basics
Spend & Scope
Procurement Model
Vendor Requirements
Terms & Policies
Entry Strategy
Pain Points & Triggers
Outputs
Pricing Analysis
Benchmarks
Trends
Should-Cost
Indexation
Landed Cost
Commercial Terms
Deliverables
Brand Analysis
Positioning & Value Prop
Share & Presence
Customer Evidence
Go-to-Market
Digital & Reputation
Compliance & Trust
KPIs & Gaps
Outputs
Full Research Suite comprises of:
Market outlook & trends analysis
Interviews & case studies
Strategic recommendations
Vendor profiles & capabilities analysis
5-year forecasts
8 regions and 60+ country-level data splits
Market segment data splits
12 months of continuous data updates
DELIVERED AS:
PDF EXCEL ONLINE
Retail Paper Bag Market Size and Share Forecast Outlook 2025 to 2035
Retail Automation Market Size and Share Forecast Outlook 2025 to 2035
Retail Clinics Market Analysis – Size, Share, and Forecast Outlook 2025 to 2035
Retail Logistics Market Size and Share Forecast Outlook 2025 to 2035
Retail Displays Market Size and Share Forecast Outlook 2025 to 2035
Retail Sales of Legume Snacks in the UK Analysis - Size, Share & Forecast 2025 to 2035
Retail Sales of Kvass in Russia and CIS countries Analysis - Size, Share & Forecast 2025 to 2035
Retail Sales of Layered Verrine‑Style Desserts in France Analysis - Size, Share & Forecast 2025 to 2035
US Convenience Confectionery Retail Sales Analysis - Size, Share & Forecast 2025 to 2035
Retail Sales of Bergamot from Calabria in Italy Analysis - Size, Share & Forecast 2025 to 2035
Retail Sourcing And Procurement Market Size and Share Forecast Outlook 2025 to 2035
Retail Colocation Market Size and Share Forecast Outlook 2025 to 2035
Retail Warehouse Management Systems Market Size and Share Forecast Outlook 2025 to 2035
Retail Printers Market Growth - Trends & Forecast 2025 to 2035
Retail Vending Machine Market Analysis - Size, Share, and Forecast 2025 to 2035
Retail Analytics Market Analysis by Solution, Function, Enterprise Size, Deployment Model, Field Crowdsourcing, and Region Through 2035
Retail Printers and Consumables Market Growth - Trends & Forecast 2025 to 2035
Examining Market Share Trends in the Retail Paper Bag Industry
Market Share Distribution Among Retail Vending Machine Suppliers
India Retail Mineral Turpentine Oil Market Growth – Trends & Forecast 2024-2034

Thank you!
You will receive an email from our Business Development Manager. Please be sure to check your SPAM/JUNK folder too.
Chat With
MaRIA