Confectionery Coating Market Size and Share Forecast Outlook 2025 to 2035

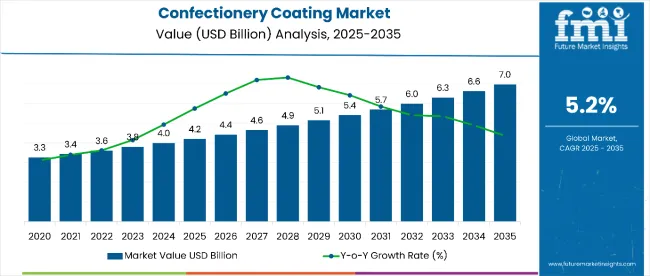
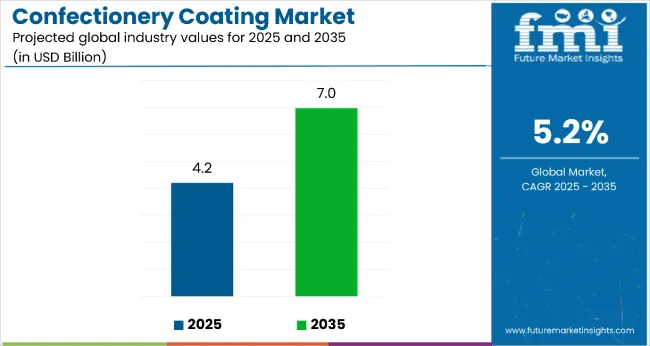
The confectionery coating market is estimated to be valued at USD 4.2 billion in 2025 and is projected to reach USD 7.0 billion by 2035, registering a CAGR of 5.2% over the forecast period. The confectionery coating market is projected to add an absolute dollar opportunity of USD 3.6 billion over the forecast period.
Confectionery Coating Market

Quick Stats for Confectionery Coating Market

  • Confectionery Coating Market Value (2025): USD 4.2 billion
  • Confectionery Coating Market Forecast Value (2035): USD 7.0 billion
  • Confectionery Coating Market Forecast CAGR:5.2%
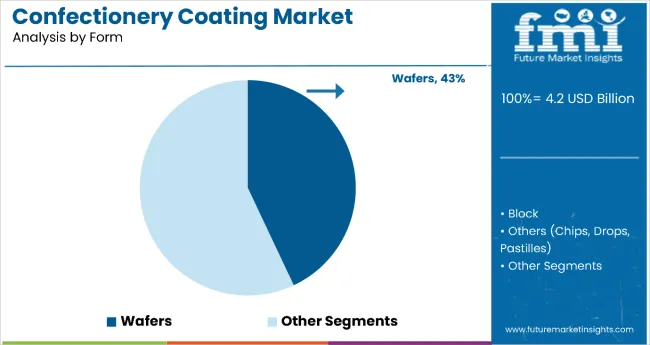
  • Leading Form Segment in Confectionery Coating Market in 2025: Wafers (43.0%)
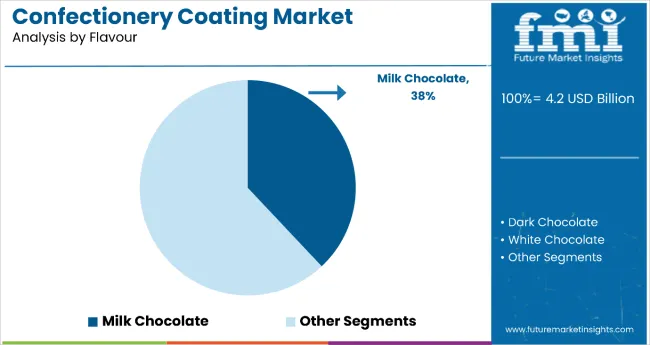
  • Leading Flavour Segment in Confectionery Coating Market in 2035: Milk Chocolate (38.0%)
  • Key Growth Regions in Confectionery Coating Market:South Asia, Sub-Saharan Africa, East Asia
  • Top Key Players in Confectionery Coating Market: Barry Callebaut AG, Cargill Incorporated, The Hershey Company, Mars Incorporated, and Ferrero Group

Confectionery Coating Market 1

This reflects 1.62 times growth at a compound annual growth rate of 4.9%. The market's evolution is expected to be shaped by rising demand for premium confectionery products, innovative flavor profiles, and indulgent treats, particularly where enhanced visual appeal and extended shelf life are required.

By 2030, the market is likely to reach approximately USD 7.3 billion, accounting for USD 1.5 billion in incremental value over the first half of the decade. The remaining USD 2.1 billion is expected during the second half, suggesting a moderately front-loaded growth pattern. Product innovation in compound coatings and functional ingredients is gaining traction due to confectionery coating's favorable cost-effectiveness and processing advantages.

Companies such as Barry Callebaut and Cargill are advancing their competitive positions through investment in advanced coating technologies and sustainable sourcing systems. Health-conscious formulation models are supporting expansion into sugar-free applications, organic variants, and clean-label products. Market performance will remain anchored in flavor innovation, coating efficiency, and regulatory compliance benchmarks.

The market holds approximately 45% of the chocolate and confectionery ingredients market, driven by its essential role in product differentiation, flavor enhancement, and visual appeal across confectionery applications. It accounts for around 38% of the food coating and glazing agents market, supported by its functional properties and compatibility with various confectionery manufacturing processes.

The market contributes nearly 32% to the specialty food ingredients market, particularly for applications requiring premium appearance and taste enhancement. It holds close to 28% of the bakery and confectionery processing aids market, where coatings are essential for product finishing and consumer appeal. The share in the indulgent food products market reaches about 35%, reflecting its preference among manufacturers seeking to create premium confectionery experiences.

The market is undergoing structural change driven by rising demand for premium, indulgent, and visually appealing confectionery products. Advanced coating technologies using compound formulations, natural colorants, and flavor innovations have enhanced product aesthetics, shelf stability, and consumer acceptance, making confectionery coatings viable alternatives to traditional chocolate coatings.

Manufacturers are introducing specialized formulations and customized coating solutions tailored for specific applications, expanding their role beyond basic chocolate alternatives. Strategic collaborations between coating suppliers and confectionery manufacturers have accelerated adoption in premium and artisanal products. Health-conscious positioning and clean-label trends have widened market acceptance, reshaping traditional coating formulations and forcing conventional suppliers to adapt.

Why is the Confectionery Coating Market Growing?

Confectionery coating's cost-effectiveness, processing convenience, and ability to enhance product appeal make it an attractive alternative to traditional chocolate for confectionery manufacturers seeking to balance quality with economic efficiency.

Growing consumer demand for indulgent treats and premium confectionery experiences is further propelling adoption, especially in chocolate alternatives, seasonal products, and artisanal confections. Innovation in coating formulations, along with improvements in flavor profiles and visual aesthetics, is also enhancing product quality and market acceptance.

As confectionery consumption increases globally and premium product positioning becomes critical, the market outlook remains favorable. With manufacturers and consumers prioritizing taste innovation, visual appeal, and cost-effective premium experiences, confectionery coatings are well-positioned to expand across various sweet treat and bakery applications.

Confectionery Coating Market Analysis by Top Investment Segments

The market segments include nature, form, flavour, product type, and region. The nature segment comprises organic confectionery coating and conventional confectionery coating. The form segment includes wafers, blocks, and others (chips, pastilles, buttons, and slabs).

The flavour segment covers dark chocolate, white chocolate, milk chocolate, yoghurt, caramel, fudge, citrus, berries, and others (spice, nut butter). The product type segment includes candies, biscuits & cookies, dried fruits & nuts, soft candies, bars, lollipops, canes, toffees, and others (cereal snacks, marshmallows, ice cream coatings). The regional segment includes North America, Latin America, Western Europe, Eastern Europe, Asia Pacific, and the Middle East & Africa.
By Form, Wafers Segment Accounts for 43.0% of the Market Share

Confectionery Coating Market Analysis By Form

The wafers form segment holds a dominant position with 43.0% of the market share in 2025, primarily due to its wide application in chocolate bars, layered biscuits, and novelty snack items. The lightweight, crispy texture of wafers provides a complementary contrast to thick confectionery coatings such as milk or dark chocolate, enhancing sensory appeal and consumer satisfaction.

Wafers help manufacturers reduce overall product weight while maintaining volume and visual appeal, which is especially advantageous in cost-sensitive markets. The segment is also benefiting from innovations in wafer-based formats, including multi-layered bars, filled wafers, and protein-enriched variants that meet both indulgent and functional snacking trends.

Coated wafers are increasingly featured in seasonal launches and gift packs, boosting their visibility in the market. In emerging economies, rising disposable incomes and the growth of modern retail channels are driving higher demand for affordable luxury snacks, a segment where wafers are particularly well suited.
By Flavour, Milk Chocolate Segment Accounts for 38.0% of the Market Share

Confectionery Coating Market Analysis By Flavour

Milk chocolate leads the flavour category with a 38.0% market share in 2025, attributed to its smooth, creamy texture and moderate sweetness that appeals widely to children and families. Unlike dark chocolate, which can be bitter, or white chocolate, which may be overly sweet, milk chocolate offers a balanced taste that suits mainstream preferences.

Its dominance is supported by strong placement in mass-market offerings and seasonal confectionery products. Milk chocolate-coated items are core offerings across major supermarket and convenience store chains in countries such as the USA, UK, Germany, and India.

Although consumer interest in dark and niche flavours is increasing, milk chocolate continues to evolve through premium and hybrid formats. Manufacturers are introducing enhanced milk chocolate products that feature single-origin cocoa, added protein, reduced sugar, and organic milk to align with health and sustainability demands while retaining broad appeal.
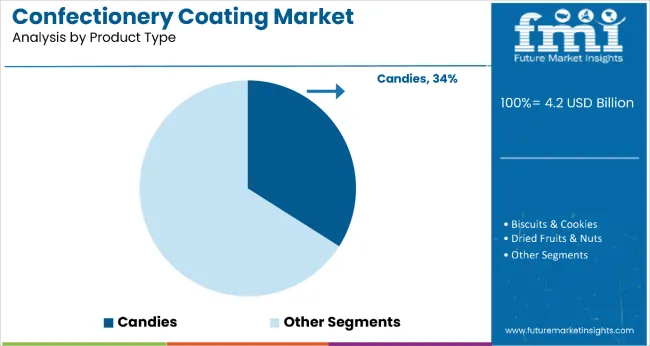
By Product Type, Candies Segment Accounts for 34.0% of the Market Share

Confectionery Coating Market Analysis By Product Type

Candies hold the largest share among product types with 34.0% of the global confectionery coating market in 2025. Their leadership is supported by universal consumer appeal, affordability, and ongoing innovation in flavours, packaging, and formats. Chocolate-coated candies are a significant part of this segment, including milk chocolate shells, dark chocolate-covered centers, and dual-flavour options.

Candies appeal to a wide demographic. While sugar-based variants continue to attract children, an increasing number of premium or functional options target adults, featuring attributes such as added vitamins, exotic fruit fillings, and dark chocolate coatings. Brands are also focusing on reduced sugar content, organic coatings, and plant-based inclusions to cater to evolving health-conscious preferences.

North America and Europe represent mature yet profitable markets through strategies such as nostalgia marketing and premiumization. In contrast, the Asia Pacific region is experiencing the fastest growth, driven by increasing disposable incomes, western-influenced snacking habits, and a youthful consumer base. In these markets, coated candies serve both as daily treats and as gifting options during festivals and celebrations.

What are the Drivers, Restraints, and Key Trends of the Confectionery Coating Market?

In 2024, global confectionery coating consumption increased by 12% year-on-year, with North America accounting for 35% of total demand. Applications include cost-effective chocolate alternatives, seasonal confectionery coatings, and premium finishing solutions for high-value products.

Manufacturers are investing in advanced compound formulations and natural ingredient blends to achieve superior taste profiles and processing efficiency. The market is witnessing an emphasis on clean-label solutions to support transparent ingredient positioning, while technology providers offer ready-to-use coatings with integrated flavor systems to simplify formulation and reduce processing complexity.

Cost-Effectiveness and Processing Efficiency Drive Market Adoption

Confectionery coatings are being increasingly adopted for their ability to deliver cost savings and operational advantages without compromising sensory quality. Compound coatings can reduce costs by up to 40% compared to pure chocolate while maintaining consumer acceptance levels above 85%.

These formulations ensure flavor stability and aesthetic appeal across production and distribution stages. High-volume manufacturers benefit from reduced processing times, as coating lines can lower production cycles by nearly 35% compared to traditional chocolate tempering. Such benefits make confectionery coatings essential for scaling operations while controlling raw material expenditure.

Ingredient Cost Volatility, Health Concerns, and Premium Positioning Challenges Restrict Expansion

The market faces constraints from raw material price fluctuations, rising health concerns, and brand positioning complexities. Cocoa and sugar costs range between USD 2,200 and USD 3,800 per metric ton, creating pricing instability and prompting frequent reformulation, sometimes increasing operational costs by up to 8%.

Additionally, the clean-label movement has lengthened product development timelines by 3 to 5 months due to regulatory and sourcing challenges for natural ingredients. Premium market segments present another hurdle, as consumer expectations for authentic chocolate experiences increase rejection rates for compound coatings by 15-25% compared to traditional products.

Key Trends Reshaping the Confectionery Coating Market

The industry is moving toward natural ingredient blends, clean-label certifications, and ready-to-use coating solutions to meet evolving consumer expectations. Functional inclusions, such as protein or fiber fortification, are emerging in premium coating applications, reflecting the convergence of indulgence and health.

Technological advancements in flavor encapsulation and heat-stable formulations are enhancing performance during processing and storage. Additionally, growing demand for seasonal and limited-edition offerings is pushing manufacturers to adopt versatile coating systems capable of delivering differentiated sensory experiences. These trends indicate a shift toward value-added solutions that balance cost control with premiumization and health-driven innovation.
Analysis of Confectionery Coating Market By Key Countries

Country Wise Analysis Of Confectionery Coating Market

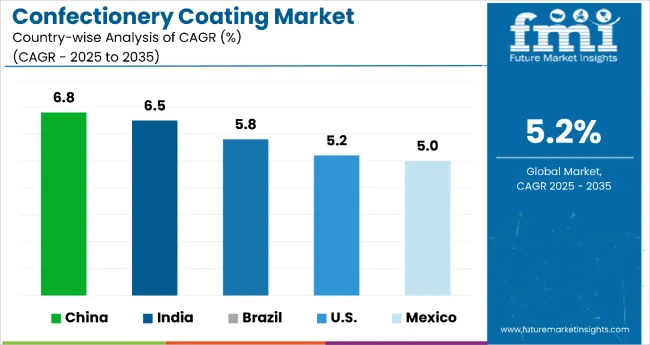
Between 2025 and 2035, China leads the confectionery coating market with a 6.8% CAGR, driven by large-scale manufacturing and strong export growth. India follows at 6.5%, supported by government investment and modernization of traditional sweets. Brazil grows at 5.8%, fueled by sustainable innovations and tropical flavour development.

The USA posts a 5.2% CAGR, focusing on advanced technologies like sugar-free and vegan coatings. Mexico, at 5.0%, emphasizes traditional sweet adaptations and export-ready solutions. While China and India dominate in scale, Brazil and the USA lead in innovation, and Mexico offers culturally tailored growth opportunities.

Manufacturing Scale Expansion in Confectionery Coating Market in China

Sales of confectionery coating in China are projected to grow at a CAGR of 6.8% from 2025 to 2035, outperforming the global average by 1.9%. The growth is linked to rapid confectionery manufacturing expansion, rising urban consumption, and increasing adoption of western-style treats in Beijing, Shanghai, and Guangzhou metropolitan areas.

Compound coating production and chocolate alternative manufacturing are widely supported by domestic food processing investments and international technology partnerships. Market expansion has been driven by cost-effective production capabilities and growing export opportunities to Southeast Asian markets.

  • 1.8 million tons of confectionery coating ingredients processed in China in 2024
  • 73% of Chinese confectionery coating production focused on compound chocolate alternatives in 2024
  • 52% of Chinese confectionery manufacturers have adopted automated coating systems in 2024

Market Development in Confectionery Coating Market in India

Sales of confectionery coating in India is forecast to grow at a CAGR of 6.5% from 2025 to 2035, ahead of the global average by 1.4%. Traditional sweet manufacturing regions, particularly Maharashtra, Gujarat, and Tamil Nadu, have expanded confectionery coating adoption for both domestic consumption and value-added confection production. Government support for food processing and increasing urbanization have supported coating technology development in commercial sweet manufacturing.

  • 8.7 billion USD invested in confectionery and food processing infrastructure during FY 2024
  • 41% increase in western-style confection consumption between 2023-2024
  • 124 confectionery coating processing facilities operational across six states in 2024

Technology Innovation in Confectionery Coating Market in Brazil

Demand for confectionery coating in Brazil is projected to grow at a CAGR of 5.8% from 2025 to 2035, outperforming the global average due to robust domestic demand and increasing investments in sustainable and functional confectionery coatings. Innovation is particularly strong in the São Paulo, Curitiba, and Belo Horizonte regions, where manufacturers are developing tropical fruit-flavoured coatings, reduced-sugar chocolate layers, and heat-resistant formulations suitable for the local climate.

  • 29 certified confectionery coating facilities meeting Brazilian organic and sustainability criteria in 2024
  • 91% of coating products produced in Brazil aligned with clean-label standards in 2024
  • 512 professionals employed in confectionery coating R&D nationwide in 2024

Market Integration in Confectionery Coating Market in USA

The USA confectionery coating market is expected to expand at a CAGR of 5.2% from 2025 to 2035, driven by rapid advancements in coating machinery, allergen-free formulations, and sugar alternatives. Regions such as California, Illinois, and Pennsylvania are at the forefront of deploying microencapsulation, protein-infused coatings, and shelf-stable innovations for functional snacks and confectionery items.

  • USD 5.8 million allocated to federal and private R&D initiatives for confectionery coating in 2024
  • 85% of USA confectionery coatings meet low-sugar or sugar-free compliance standards
  • 678 partnerships established between ingredient tech companies and USA confectionery producers in 2024

Growth Outlook for Confectionery Coating Market in Mexico

Sales of confectionery coating in Mexico are projected to grow at a CAGR of 5.0% from 2025 to 2035, fueled by rising middle-class consumption and the modernization of traditional confections with new coating technologies.

Growth is concentrated in Mexico City, Monterrey, and Guadalajara, where local brands are adopting chocolate, yoghurt, and spiced coatings for both domestic and export markets. Emphasis is being placed on enhancing shelf stability for tropical climates, using ingredients like tamarind, chili, and cinnamon for culturally relevant coated products.

  • 37% of Mexico’s confectionery coating applications in 2024 focused on traditional sweet adaptations
  • 276 collaborative projects between local food labs and coating manufacturers initiated in 2024
  • 3.7 million MXN invested in coating formulation upgrades for export-focused confectionery in 2024

Competitive Landscape of Confectionery Coating Market

The market is moderately consolidated, featuring a mix of global chocolate giants, specialized coating manufacturers, and regional ingredient suppliers with varying degrees of processing technology, product innovation, and application expertise. Barry Callebaut AG and Cargill Incorporated lead the chocolate-based coating segment, supplying comprehensive coating solutions for confectionery manufacturers, bakeries, and food service operations. Their strength lies in extensive cocoa processing capabilities, global supply chain networks, and established relationships with major confectionery brands.

The Hershey Company and Mars Incorporated differentiate through brand-integrated coating solutions, proprietary formulations, and application-specific products that cater to both industrial manufacturing and consumer retail applications. Ferrero Group and Nestlé S.A. focus on premium coating development, addressing growing demand for high-quality alternatives and specialized formulations in luxury confection markets.

Regional specialists such as Blommer Chocolate Company, Clasen Quality Coatings Inc., and Puratos Group emphasize processing innovation, custom formulation services, and sustainable sourcing, creating value in artisanal markets and specialized coating applications.

Entry barriers remain significant, driven by challenges in ingredient sourcing, processing technology, and compliance with food safety and labeling standards across multiple application categories. Competitiveness increasingly depends on formulation flexibility, cost efficiency, and application development expertise for diverse confectionery manufacturing environments.

Scope of the Report

Item Value
Quantitative Units USD 4.2 Billion
Product Type wafers, blocks, and others (chips, drops, pastilles)
Application Confectionery, Bakery, Ice Cream, Nutritional Bars, and Others
End-user Large-Scale Manufacturers, Artisanal Producers, and Food Service
Form Liquid, Solid, and Powder
Regions Covered North America, Latin America, Western Europe, Eastern Europe, Asia Pacific, and Middle East & Africa
Country Covered United States, Canada, Germany, France, United Kingdom, China, Japan, India, Brazil, South Africa, Australia, and 40+ countries
Key Companies Profiled Barry Callebaut AG, Cargill Incorporated, The Hershey Company, Mars Incorporated, Ferrero Group, Nestlé S.A., Mondelez International, Lindt & Sprüngli AG, Blommer Chocolate Company, Clasen Quality Coatings Inc., ADM Company, Fuji Oil Holdings Inc., Puratos Group, Chocoladefabriken Lindt & Sprüngli AG, and Kerry Group plc
Additional Attributes Dollar sales by coating type and application method, regional demand trends, competitive landscape, buyer preferences for liquid versus solid formats, integration with clean-label positioning and natural ingredient sourcing, innovations in compound formulations, sustainable processing, and flavor enhancement technologies for improved taste profiles and cost-effectiveness.

Key Segmentation

By Nature:

  • Organic Confectionery Coating
  • Conventional Confectionery Coating

By Form:

  • Wafers
  • Blocks
  • Others

By Flavour:

  • Dark Chocolate
  • White Chocolate
  • Milk Chocolate
  • Yoghurt
  • Caramel
  • Fudge
  • Citrus
  • Berries
  • Others (Spice, Nut Butter)

By Product Type:

  • Candies
  • Biscuits & Cookies
  • Dried Fruits & Nuts
  • Soft Candies
  • Bars
  • Lollipops
  • Canes
  • Toffies
  • Others

By Region:

  • North America
  • Latin America
  • Western Europe
  • Eastern Europe
  • Asia Pacific
  • Middle East & Africa

Table of Content

  1. Executive Summary
    • Global Market Outlook
    • Demand-side Trends
    • Supply-side Trends
    • Technology Roadmap Analysis
    • Analysis and Recommendations
  2. Market Overview
    • Market Coverage / Taxonomy
    • Market Definition / Scope / Limitations
  3. Market Background
    • Market Dynamics
      • Drivers
      • Restraints
      • Opportunity
      • Trends
    • Scenario Forecast
      • Demand in Optimistic Scenario
      • Demand in Likely Scenario
      • Demand in Conservative Scenario
    • Opportunity Map Analysis
    • Product Life Cycle Analysis
    • Supply Chain Analysis
      • Supply Side Participants and their Roles
        • Producers
        • Mid-Level Participants (Traders/ Agents/ Brokers)
        • Wholesalers and Distributors
      • Value Added and Value Created at Node in the Supply Chain
      • List of Raw Material Suppliers
      • List of Existing and Potential Buyer’s
    • Investment Feasibility Matrix
    • Value Chain Analysis
      • Profit Margin Analysis
      • Wholesalers and Distributors
      • Retailers
    • PESTLE and Porter’s Analysis
    • Regulatory Landscape
      • By Key Regions
      • By Key Countries
    • Regional Parent Market Outlook
    • Production and Consumption Statistics
    • Import and Export Statistics
  4. Global Market Analysis 2020 to 2024 and Forecast, 2025 to 2035
    • Historical Market Size Value (USD Billion) & Volume (Metric Tons) Analysis, 2020 to 2024
    • Current and Future Market Size Value (USD Billion) & Volume (Metric Tons) Projections, 2025 to 2035
      • Y-o-Y Growth Trend Analysis
      • Absolute $ Opportunity Analysis
  5. Global Market Pricing Analysis 2020 to 2024 and Forecast 2025 to 2035
  6. Global Market Analysis 2020 to 2024 and Forecast 2025 to 2035, By Nature
    • Introduction / Key Findings
    • Historical Market Size Value (USD Billion) & Volume (Metric Tons) Analysis By Nature, 2020 to 2024
    • Current and Future Market Size Value (USD Billion) & Volume (Metric Tons) Analysis and Forecast By Nature, 2025 to 2035
      • Organic Confectionery Coating
      • Conventional Confectionery Coating
    • Y-o-Y Growth Trend Analysis By Nature, 2020 to 2024
    • Absolute $ Opportunity Analysis By Nature, 2025 to 2035
  7. Global Market Analysis 2020 to 2024 and Forecast 2025 to 2035, By Form
    • Introduction / Key Findings
    • Historical Market Size Value (USD Billion) & Volume (Metric Tons) Analysis By Form, 2020 to 2024
    • Current and Future Market Size Value (USD Billion) & Volume (Metric Tons) Analysis and Forecast By Form, 2025 to 2035
      • Wafers
      • Blocks
      • Others (chips, drops, pastilles)
    • Y-o-Y Growth Trend Analysis By Form, 2020 to 2024
    • Absolute $ Opportunity Analysis By Form, 2025 to 2035
  8. Global Market Analysis 2020 to 2024 and Forecast 2025 to 2035, By Flavour
    • Introduction / Key Findings
    • Historical Market Size Value (USD Billion) & Volume (Metric Tons) Analysis By Flavour, 2020 to 2024
    • Current and Future Market Size Value (USD Billion) & Volume (Metric Tons) Analysis and Forecast By Flavour, 2025 to 2035
      • Dark Chocolate
      • White Chocolate
      • Milk Chocolate
      • Yoghurt
      • Caramel
      • Fudge
      • Citrus
      • Berries
      • Others (Spice, Nut Butter)
    • Y-o-Y Growth Trend Analysis By Flavour, 2020 to 2024
    • Absolute $ Opportunity Analysis By Flavour, 2025 to 2035
  9. Global Market Analysis 2020 to 2024 and Forecast 2025 to 2035, By Product Type
    • Introduction / Key Findings
    • Historical Market Size Value (USD Billion) & Volume (Metric Tons) Analysis By Product Type, 2020 to 2024
    • Current and Future Market Size Value (USD Billion) & Volume (Metric Tons) Analysis and Forecast By Product Type, 2025 to 2035
      • Candies
      • Biscuits & Cookies
      • Dried Fruits & Nuts
      • Soft Candies
      • Bars
      • Lollipops
      • Canes
      • Toffees
      • Others (Cereal Snacks, Marshmallows, Ice Cream Coatings, Baked Goods)
    • Y-o-Y Growth Trend Analysis By Product Type, 2020 to 2024
    • Absolute $ Opportunity Analysis By Product Type, 2025 to 2035
  10. Global Market Analysis 2020 to 2024 and Forecast 2025 to 2035, By Region
    • Introduction
    • Historical Market Size Value (USD Billion) & Volume (Metric Tons) Analysis By Region, 2020 to 2024
    • Current Market Size Value (USD Billion) & Volume (Metric Tons) Analysis and Forecast By Region, 2025 to 2035
      • North America
      • Latin America
      • Western Europe
      • Eastern Europe
      • East Asia
      • South Asia & Pacific
      • Middle East and Africa
    • Market Attractiveness Analysis By Region
  11. North America Market Analysis 2020 to 2024 and Forecast 2025 to 2035, By Country
    • Historical Market Size Value (USD Billion) & Volume (Metric Tons) Trend Analysis By Market Taxonomy, 2020 to 2024
    • Market Size Value (USD Billion) & Volume (Metric Tons) Forecast By Market Taxonomy, 2025 to 2035
      • By Country
        • USA
        • Canada
        • Mexico
      • By Nature
      • By Form
      • By Flavour
      • By Product Type
    • Market Attractiveness Analysis
      • By Country
      • By Nature
      • By Form
      • By Flavour
      • By Product Type
    • Key Takeaways
  12. Latin America Market Analysis 2020 to 2024 and Forecast 2025 to 2035, By Country
    • Historical Market Size Value (USD Billion) & Volume (Metric Tons) Trend Analysis By Market Taxonomy, 2020 to 2024
    • Market Size Value (USD Billion) & Volume (Metric Tons) Forecast By Market Taxonomy, 2025 to 2035
      • By Country
        • Brazil
        • Argentina
        • Rest of LATAM
      • By Nature
      • By Form
      • By Flavour
      • By Product Type
    • Market Attractiveness Analysis
      • By Country
      • By Nature
      • By Form
      • By Flavour
      • By Product Type
    • Key Takeaways
  13. Western Europe Market Analysis 2020 to 2024 and Forecast 2025 to 2035, By Country
    • Historical Market Size Value (USD Billion) & Volume (Metric Tons) Trend Analysis By Market Taxonomy, 2020 to 2024
    • Market Size Value (USD Billion) & Volume (Metric Tons) Forecast By Market Taxonomy, 2025 to 2035
      • By Country
        • Germany
        • Italy
        • France
        • UK
        • Spain
        • BENELUX
        • Nordic
        • Rest of W.Europe
      • By Nature
      • By Form
      • By Flavour
      • By Product Type
    • Market Attractiveness Analysis
      • By Country
      • By Nature
      • By Form
      • By Flavour
      • By Product Type
    • Key Takeaways
  14. Eastern Europe Market Analysis 2020 to 2024 and Forecast 2025 to 2035, By Country
    • Historical Market Size Value (USD Billion) & Volume (Metric Tons) Trend Analysis By Market Taxonomy, 2020 to 2024
    • Market Size Value (USD Billion) & Volume (Metric Tons) Forecast By Market Taxonomy, 2025 to 2035
      • By Country
        • Russia
        • Hungary
        • Poland
        • Balkan & Baltics
        • Rest of E. Europe
      • By Nature
      • By Form
      • By Flavour
      • By Product Type
    • Market Attractiveness Analysis
      • By Country
      • By Nature
      • By Form
      • By Flavour
      • By Product Type
    • Key Takeaways
  15. East Asia Market Analysis 2020 to 2024 and Forecast 2025 to 2035, By Country
    • Historical Market Size Value (USD Billion) & Volume (Metric Tons) Trend Analysis By Market Taxonomy, 2020 to 2024
    • Market Size Value (USD Billion) & Volume (Metric Tons) Forecast By Market Taxonomy, 2025 to 2035
      • By Country
        • China
        • Japan
        • South Korea
      • By Nature
      • By Form
      • By Flavour
      • By Product Type
    • Market Attractiveness Analysis
      • By Country
      • By Nature
      • By Form
      • By Flavour
      • By Product Type
    • Key Takeaways
  16. South Asia & Pacific Market Analysis 2020 to 2024 and Forecast 2025 to 2035, By Country
    • Historical Market Size Value (USD Billion) & Volume (Metric Tons) Trend Analysis By Market Taxonomy, 2020 to 2024
    • Market Size Value (USD Billion) & Volume (Metric Tons) Forecast By Market Taxonomy, 2025 to 2035
      • By Country
        • India
        • Australia & New Zealand
        • ASEAN
        • Rest of SAP
      • By Nature
      • By Form
      • By Flavour
      • By Product Type
    • Market Attractiveness Analysis
      • By Country
      • By Nature
      • By Form
      • By Flavour
      • By Product Type
    • Key Takeaways
  17. Middle East and Africa Market Analysis 2020 to 2024 and Forecast 2025 to 2035, By Country
    • Historical Market Size Value (USD Billion) & Volume (Metric Tons) Trend Analysis By Market Taxonomy, 2020 to 2024
    • Market Size Value (USD Billion) & Volume (Metric Tons) Forecast By Market Taxonomy, 2025 to 2035
      • By Country
        • GCC Countries
        • Northern Africa
        • South Africa
        • Turkiye
        • Rest of MEA
      • By Nature
      • By Form
      • By Flavour
      • By Product Type
    • Market Attractiveness Analysis
      • By Country
      • By Nature
      • By Form
      • By Flavour
      • By Product Type
    • Key Takeaways
  18. Key Countries Market Analysis
    • USA
      • Pricing Analysis
      • Market Share Analysis, 2024
        • By Nature
        • By Form
        • By Flavour
        • By Product Type
    • Canada
      • Pricing Analysis
      • Market Share Analysis, 2024
        • By Nature
        • By Form
        • By Flavour
        • By Product Type
    • Brazil
      • Pricing Analysis
      • Market Share Analysis, 2024
        • By Nature
        • By Form
        • By Flavour
        • By Product Type
    • Mexico
      • Pricing Analysis
      • Market Share Analysis, 2024
        • By Nature
        • By Form
        • By Flavour
        • By Product Type
    • Argentina
      • Pricing Analysis
      • Market Share Analysis, 2024
        • By Nature
        • By Form
        • By Flavour
        • By Product Type
  19. Market Structure Analysis
    • Competition Dashboard
    • Competition Benchmarking
    • Market Share Analysis of Top Players
      • By Regional
      • By Nature
      • By Form
      • By Flavour
      • By Product Type
  20. Competition Analysis
    • Competition Deep Dive
      • LorAnn Oils
        • Overview
        • Product Portfolio
        • Profitability by Market Segments (Product/Age /Sales Channel/Region)
        • Sales Footprint
        • Strategy Overview
          • Marketing Strategy
          • Product Strategy
          • Channel Strategy
      • Soyuzsnab
        • Overview
        • Product Portfolio
        • Profitability by Market Segments (Product/Age /Sales Channel/Region)
        • Sales Footprint
        • Strategy Overview
          • Marketing Strategy
          • Product Strategy
          • Channel Strategy
      • Group of Companies
        • Overview
        • Product Portfolio
        • Profitability by Market Segments (Product/Age /Sales Channel/Region)
        • Sales Footprint
        • Strategy Overview
          • Marketing Strategy
          • Product Strategy
          • Channel Strategy
      • Capol LLC
        • Overview
        • Product Portfolio
        • Profitability by Market Segments (Product/Age /Sales Channel/Region)
        • Sales Footprint
        • Strategy Overview
          • Marketing Strategy
          • Product Strategy
          • Channel Strategy
      • Norevo GmbH
        • Overview
        • Product Portfolio
        • Profitability by Market Segments (Product/Age /Sales Channel/Region)
        • Sales Footprint
        • Strategy Overview
          • Marketing Strategy
          • Product Strategy
          • Channel Strategy
      • Blommer Chocolate Company
        • Overview
        • Product Portfolio
        • Profitability by Market Segments (Product/Age /Sales Channel/Region)
        • Sales Footprint
        • Strategy Overview
          • Marketing Strategy
          • Product Strategy
          • Channel Strategy
      • Cargill
        • Overview
        • Product Portfolio
        • Profitability by Market Segments (Product/Age /Sales Channel/Region)
        • Sales Footprint
        • Strategy Overview
          • Marketing Strategy
          • Product Strategy
          • Channel Strategy
      • Incorporated
        • Overview
        • Product Portfolio
        • Profitability by Market Segments (Product/Age /Sales Channel/Region)
        • Sales Footprint
        • Strategy Overview
          • Marketing Strategy
          • Product Strategy
          • Channel Strategy
      • Mantrose-Haeuser Co. Inc.
        • Overview
        • Product Portfolio
        • Profitability by Market Segments (Product/Age /Sales Channel/Region)
        • Sales Footprint
        • Strategy Overview
          • Marketing Strategy
          • Product Strategy
          • Channel Strategy
      • Alvas Group and Bunge Loders Croklaan Sweetdreams Limited
        • Overview
        • Product Portfolio
        • Profitability by Market Segments (Product/Age /Sales Channel/Region)
        • Sales Footprint
        • Strategy Overview
          • Marketing Strategy
          • Product Strategy
          • Channel Strategy
      • Kauffman's Fruit Farm & Market
        • Overview
        • Product Portfolio
        • Profitability by Market Segments (Product/Age /Sales Channel/Region)
        • Sales Footprint
        • Strategy Overview
          • Marketing Strategy
          • Product Strategy
          • Channel Strategy
      • Barry Callebaut AG
        • Overview
        • Product Portfolio
        • Profitability by Market Segments (Product/Age /Sales Channel/Region)
        • Sales Footprint
        • Strategy Overview
          • Marketing Strategy
          • Product Strategy
          • Channel Strategy
      • CK Products
        • Overview
        • Product Portfolio
        • Profitability by Market Segments (Product/Age /Sales Channel/Region)
        • Sales Footprint
        • Strategy Overview
          • Marketing Strategy
          • Product Strategy
          • Channel Strategy
      • Clasen Quality Coatings, Inc.
        • Overview
        • Product Portfolio
        • Profitability by Market Segments (Product/Age /Sales Channel/Region)
        • Sales Footprint
        • Strategy Overview
          • Marketing Strategy
          • Product Strategy
          • Channel Strategy
      • The Warrell Corporation
        • Overview
        • Product Portfolio
        • Profitability by Market Segments (Product/Age /Sales Channel/Region)
        • Sales Footprint
        • Strategy Overview
          • Marketing Strategy
          • Product Strategy
          • Channel Strategy
      • Rascal Confectionery Ltd.
        • Overview
        • Product Portfolio
        • Profitability by Market Segments (Product/Age /Sales Channel/Region)
        • Sales Footprint
        • Strategy Overview
          • Marketing Strategy
          • Product Strategy
          • Channel Strategy
      • Thew Arnott & Co Ltd
        • Overview
        • Product Portfolio
        • Profitability by Market Segments (Product/Age /Sales Channel/Region)
        • Sales Footprint
        • Strategy Overview
          • Marketing Strategy
          • Product Strategy
          • Channel Strategy
      • Fancy Flours
        • Overview
        • Product Portfolio
        • Profitability by Market Segments (Product/Age /Sales Channel/Region)
        • Sales Footprint
        • Strategy Overview
          • Marketing Strategy
          • Product Strategy
          • Channel Strategy
  21. Assumptions & Acronyms Used
  22. Research Methodology

List of Tables

  • Table 1: Global Market Value (USD Billion) Forecast by Region, 2020-2035
  • Table 2: Global Market Volume (Metric Tons) Forecast by Region, 2020-2035
  • Table 3: Global Market Value (USD Billion) Forecast by Nature, 2020-2035
  • Table 4: Global Market Volume (Metric Tons) Forecast by Nature, 2020-2035
  • Table 5: Global Market Value (USD Billion) Forecast by Form, 2020-2035
  • Table 6: Global Market Volume (Metric Tons) Forecast by Form, 2020-2035
  • Table 7: Global Market Value (USD Billion) Forecast by Flavour, 2020-2035
  • Table 8: Global Market Volume (Metric Tons) Forecast by Flavour, 2020-2035
  • Table 9: Global Market Value (USD Billion) Forecast by Product Type, 2020-2035
  • Table 10: Global Market Volume (Metric Tons) Forecast by Product Type, 2020-2035
  • Table 11: North America Market Value (USD Billion) Forecast by Country, 2020-2035
  • Table 12: North America Market Volume (Metric Tons) Forecast by Country, 2020-2035
  • Table 13: North America Market Value (USD Billion) Forecast by Nature, 2020-2035
  • Table 14: North America Market Volume (Metric Tons) Forecast by Nature, 2020-2035
  • Table 15: North America Market Value (USD Billion) Forecast by Form, 2020-2035
  • Table 16: North America Market Volume (Metric Tons) Forecast by Form, 2020-2035
  • Table 17: North America Market Value (USD Billion) Forecast by Flavour, 2020-2035
  • Table 18: North America Market Volume (Metric Tons) Forecast by Flavour, 2020-2035
  • Table 19: North America Market Value (USD Billion) Forecast by Product Type, 2020-2035
  • Table 20: North America Market Volume (Metric Tons) Forecast by Product Type, 2020-2035
  • Table 21: Latin America Market Value (USD Billion) Forecast by Country, 2020-2035
  • Table 22: Latin America Market Volume (Metric Tons) Forecast by Country, 2020-2035
  • Table 23: Latin America Market Value (USD Billion) Forecast by Nature, 2020-2035
  • Table 24: Latin America Market Volume (Metric Tons) Forecast by Nature, 2020-2035
  • Table 25: Latin America Market Value (USD Billion) Forecast by Form, 2020-2035
  • Table 26: Latin America Market Volume (Metric Tons) Forecast by Form, 2020-2035
  • Table 27: Latin America Market Value (USD Billion) Forecast by Flavour, 2020-2035
  • Table 28: Latin America Market Volume (Metric Tons) Forecast by Flavour, 2020-2035
  • Table 29: Latin America Market Value (USD Billion) Forecast by Product Type, 2020-2035
  • Table 30: Latin America Market Volume (Metric Tons) Forecast by Product Type, 2020-2035
  • Table 31: Western Europe Market Value (USD Billion) Forecast by Country, 2020-2035
  • Table 32: Western Europe Market Volume (Metric Tons) Forecast by Country, 2020-2035
  • Table 33: Western Europe Market Value (USD Billion) Forecast by Nature, 2020-2035
  • Table 34: Western Europe Market Volume (Metric Tons) Forecast by Nature, 2020-2035
  • Table 35: Western Europe Market Value (USD Billion) Forecast by Form, 2020-2035
  • Table 36: Western Europe Market Volume (Metric Tons) Forecast by Form, 2020-2035
  • Table 37: Western Europe Market Value (USD Billion) Forecast by Flavour, 2020-2035
  • Table 38: Western Europe Market Volume (Metric Tons) Forecast by Flavour, 2020-2035
  • Table 39: Western Europe Market Value (USD Billion) Forecast by Product Type, 2020-2035
  • Table 40: Western Europe Market Volume (Metric Tons) Forecast by Product Type, 2020-2035
  • Table 41: Eastern Europe Market Value (USD Billion) Forecast by Country, 2020-2035
  • Table 42: Eastern Europe Market Volume (Metric Tons) Forecast by Country, 2020-2035
  • Table 43: Eastern Europe Market Value (USD Billion) Forecast by Nature, 2020-2035
  • Table 44: Eastern Europe Market Volume (Metric Tons) Forecast by Nature, 2020-2035
  • Table 45: Eastern Europe Market Value (USD Billion) Forecast by Form, 2020-2035
  • Table 46: Eastern Europe Market Volume (Metric Tons) Forecast by Form, 2020-2035
  • Table 47: Eastern Europe Market Value (USD Billion) Forecast by Flavour, 2020-2035
  • Table 48: Eastern Europe Market Volume (Metric Tons) Forecast by Flavour, 2020-2035
  • Table 49: Eastern Europe Market Value (USD Billion) Forecast by Product Type, 2020-2035
  • Table 50: Eastern Europe Market Volume (Metric Tons) Forecast by Product Type, 2020-2035
  • Table 51: East Asia Market Value (USD Billion) Forecast by Country, 2020-2035
  • Table 52: East Asia Market Volume (Metric Tons) Forecast by Country, 2020-2035
  • Table 53: East Asia Market Value (USD Billion) Forecast by Nature, 2020-2035
  • Table 54: East Asia Market Volume (Metric Tons) Forecast by Nature, 2020-2035
  • Table 55: East Asia Market Value (USD Billion) Forecast by Form, 2020-2035
  • Table 56: East Asia Market Volume (Metric Tons) Forecast by Form, 2020-2035
  • Table 57: East Asia Market Value (USD Billion) Forecast by Flavour, 2020-2035
  • Table 58: East Asia Market Volume (Metric Tons) Forecast by Flavour, 2020-2035
  • Table 59: East Asia Market Value (USD Billion) Forecast by Product Type, 2020-2035
  • Table 60: East Asia Market Volume (Metric Tons) Forecast by Product Type, 2020-2035
  • Table 61: South Asia & Pacific Market Value (USD Billion) Forecast by Country, 2020-2035
  • Table 62: South Asia & Pacific Market Volume (Metric Tons) Forecast by Country, 2020-2035
  • Table 63: South Asia & Pacific Market Value (USD Billion) Forecast by Nature, 2020-2035
  • Table 64: South Asia & Pacific Market Volume (Metric Tons) Forecast by Nature, 2020-2035
  • Table 65: South Asia & Pacific Market Value (USD Billion) Forecast by Form, 2020-2035
  • Table 66: South Asia & Pacific Market Volume (Metric Tons) Forecast by Form, 2020-2035
  • Table 67: South Asia & Pacific Market Value (USD Billion) Forecast by Flavour, 2020-2035
  • Table 68: South Asia & Pacific Market Volume (Metric Tons) Forecast by Flavour, 2020-2035
  • Table 69: South Asia & Pacific Market Value (USD Billion) Forecast by Product Type, 2020-2035
  • Table 70: South Asia & Pacific Market Volume (Metric Tons) Forecast by Product Type, 2020-2035
  • Table 71: Middle East and Africa Market Value (USD Billion) Forecast by Country, 2020-2035
  • Table 72: Middle East and Africa Market Volume (Metric Tons) Forecast by Country, 2020-2035
  • Table 73: Middle East and Africa Market Value (USD Billion) Forecast by Nature, 2020-2035
  • Table 74: Middle East and Africa Market Volume (Metric Tons) Forecast by Nature, 2020-2035
  • Table 75: Middle East and Africa Market Value (USD Billion) Forecast by Form, 2020-2035
  • Table 76: Middle East and Africa Market Volume (Metric Tons) Forecast by Form, 2020-2035
  • Table 77: Middle East and Africa Market Value (USD Billion) Forecast by Flavour, 2020-2035
  • Table 78: Middle East and Africa Market Volume (Metric Tons) Forecast by Flavour, 2020-2035
  • Table 79: Middle East and Africa Market Value (USD Billion) Forecast by Product Type, 2020-2035
  • Table 80: Middle East and Africa Market Volume (Metric Tons) Forecast by Product Type, 2020-2035

List of Figures

  • Figure 1: Global Market Volume (Metric Tons) Forecast 2020-2035
  • Figure 2: Global Market Pricing Analysis
  • Figure 3: Global Market Value (USD Billion) Forecast 2020-2035
  • Figure 4: Global Market Value Share and BPS Analysis by Nature, 2025 and 2035
  • Figure 5: Global Market Y-o-Y Growth Comparison by Nature, 2025-2035
  • Figure 6: Global Market Attractiveness Analysis by Nature
  • Figure 7: Global Market Value Share and BPS Analysis by Form, 2025 and 2035
  • Figure 8: Global Market Y-o-Y Growth Comparison by Form, 2025-2035
  • Figure 9: Global Market Attractiveness Analysis by Form
  • Figure 10: Global Market Value Share and BPS Analysis by Flavour, 2025 and 2035
  • Figure 11: Global Market Y-o-Y Growth Comparison by Flavour, 2025-2035
  • Figure 12: Global Market Attractiveness Analysis by Flavour
  • Figure 13: Global Market Value Share and BPS Analysis by Product Type, 2025 and 2035
  • Figure 14: Global Market Y-o-Y Growth Comparison by Product Type, 2025-2035
  • Figure 15: Global Market Attractiveness Analysis by Product Type
  • Figure 16: Global Market Value (USD Billion) Share and BPS Analysis by Region, 2025 and 2035
  • Figure 17: Global Market Y-o-Y Growth Comparison by Region, 2025-2035
  • Figure 18: Global Market Attractiveness Analysis by Region
  • Figure 19: North America Market Incremental $ Opportunity, 2025-2035
  • Figure 20: Latin America Market Incremental $ Opportunity, 2025-2035
  • Figure 21: Western Europe Market Incremental $ Opportunity, 2025-2035
  • Figure 22: Eastern Europe Market Incremental $ Opportunity, 2025-2035
  • Figure 23: East Asia Market Incremental $ Opportunity, 2025-2035
  • Figure 24: South Asia & Pacific Market Incremental $ Opportunity, 2025-2035
  • Figure 25: Middle East and Africa Market Incremental $ Opportunity, 2025-2035
  • Figure 26: North America Market Value Share and BPS Analysis by Country, 2025 and 2035
  • Figure 27: North America Market Value Share and BPS Analysis by Nature, 2025 and 2035
  • Figure 28: North America Market Y-o-Y Growth Comparison by Nature, 2025-2035
  • Figure 29: North America Market Attractiveness Analysis by Nature
  • Figure 30: North America Market Value Share and BPS Analysis by Form, 2025 and 2035
  • Figure 31: North America Market Y-o-Y Growth Comparison by Form, 2025-2035
  • Figure 32: North America Market Attractiveness Analysis by Form
  • Figure 33: North America Market Value Share and BPS Analysis by Flavour, 2025 and 2035
  • Figure 34: North America Market Y-o-Y Growth Comparison by Flavour, 2025-2035
  • Figure 35: North America Market Attractiveness Analysis by Flavour
  • Figure 36: North America Market Value Share and BPS Analysis by Product Type, 2025 and 2035
  • Figure 37: North America Market Y-o-Y Growth Comparison by Product Type, 2025-2035
  • Figure 38: North America Market Attractiveness Analysis by Product Type
  • Figure 39: Latin America Market Value Share and BPS Analysis by Country, 2025 and 2035
  • Figure 40: Latin America Market Value Share and BPS Analysis by Nature, 2025 and 2035
  • Figure 41: Latin America Market Y-o-Y Growth Comparison by Nature, 2025-2035
  • Figure 42: Latin America Market Attractiveness Analysis by Nature
  • Figure 43: Latin America Market Value Share and BPS Analysis by Form, 2025 and 2035
  • Figure 44: Latin America Market Y-o-Y Growth Comparison by Form, 2025-2035
  • Figure 45: Latin America Market Attractiveness Analysis by Form
  • Figure 46: Latin America Market Value Share and BPS Analysis by Flavour, 2025 and 2035
  • Figure 47: Latin America Market Y-o-Y Growth Comparison by Flavour, 2025-2035
  • Figure 48: Latin America Market Attractiveness Analysis by Flavour
  • Figure 49: Latin America Market Value Share and BPS Analysis by Product Type, 2025 and 2035
  • Figure 50: Latin America Market Y-o-Y Growth Comparison by Product Type, 2025-2035
  • Figure 51: Latin America Market Attractiveness Analysis by Product Type
  • Figure 52: Western Europe Market Value Share and BPS Analysis by Country, 2025 and 2035
  • Figure 53: Western Europe Market Value Share and BPS Analysis by Nature, 2025 and 2035
  • Figure 54: Western Europe Market Y-o-Y Growth Comparison by Nature, 2025-2035
  • Figure 55: Western Europe Market Attractiveness Analysis by Nature
  • Figure 56: Western Europe Market Value Share and BPS Analysis by Form, 2025 and 2035
  • Figure 57: Western Europe Market Y-o-Y Growth Comparison by Form, 2025-2035
  • Figure 58: Western Europe Market Attractiveness Analysis by Form
  • Figure 59: Western Europe Market Value Share and BPS Analysis by Flavour, 2025 and 2035
  • Figure 60: Western Europe Market Y-o-Y Growth Comparison by Flavour, 2025-2035
  • Figure 61: Western Europe Market Attractiveness Analysis by Flavour
  • Figure 62: Western Europe Market Value Share and BPS Analysis by Product Type, 2025 and 2035
  • Figure 63: Western Europe Market Y-o-Y Growth Comparison by Product Type, 2025-2035
  • Figure 64: Western Europe Market Attractiveness Analysis by Product Type
  • Figure 65: Eastern Europe Market Value Share and BPS Analysis by Country, 2025 and 2035
  • Figure 66: Eastern Europe Market Value Share and BPS Analysis by Nature, 2025 and 2035
  • Figure 67: Eastern Europe Market Y-o-Y Growth Comparison by Nature, 2025-2035
  • Figure 68: Eastern Europe Market Attractiveness Analysis by Nature
  • Figure 69: Eastern Europe Market Value Share and BPS Analysis by Form, 2025 and 2035
  • Figure 70: Eastern Europe Market Y-o-Y Growth Comparison by Form, 2025-2035
  • Figure 71: Eastern Europe Market Attractiveness Analysis by Form
  • Figure 72: Eastern Europe Market Value Share and BPS Analysis by Flavour, 2025 and 2035
  • Figure 73: Eastern Europe Market Y-o-Y Growth Comparison by Flavour, 2025-2035
  • Figure 74: Eastern Europe Market Attractiveness Analysis by Flavour
  • Figure 75: Eastern Europe Market Value Share and BPS Analysis by Product Type, 2025 and 2035
  • Figure 76: Eastern Europe Market Y-o-Y Growth Comparison by Product Type, 2025-2035
  • Figure 77: Eastern Europe Market Attractiveness Analysis by Product Type
  • Figure 78: East Asia Market Value Share and BPS Analysis by Country, 2025 and 2035
  • Figure 79: East Asia Market Value Share and BPS Analysis by Nature, 2025 and 2035
  • Figure 80: East Asia Market Y-o-Y Growth Comparison by Nature, 2025-2035
  • Figure 81: East Asia Market Attractiveness Analysis by Nature
  • Figure 82: East Asia Market Value Share and BPS Analysis by Form, 2025 and 2035
  • Figure 83: East Asia Market Y-o-Y Growth Comparison by Form, 2025-2035
  • Figure 84: East Asia Market Attractiveness Analysis by Form
  • Figure 85: East Asia Market Value Share and BPS Analysis by Flavour, 2025 and 2035
  • Figure 86: East Asia Market Y-o-Y Growth Comparison by Flavour, 2025-2035
  • Figure 87: East Asia Market Attractiveness Analysis by Flavour
  • Figure 88: East Asia Market Value Share and BPS Analysis by Product Type, 2025 and 2035
  • Figure 89: East Asia Market Y-o-Y Growth Comparison by Product Type, 2025-2035
  • Figure 90: East Asia Market Attractiveness Analysis by Product Type
  • Figure 91: South Asia & Pacific Market Value Share and BPS Analysis by Country, 2025 and 2035
  • Figure 92: South Asia & Pacific Market Value Share and BPS Analysis by Nature, 2025 and 2035
  • Figure 93: South Asia & Pacific Market Y-o-Y Growth Comparison by Nature, 2025-2035
  • Figure 94: South Asia & Pacific Market Attractiveness Analysis by Nature
  • Figure 95: South Asia & Pacific Market Value Share and BPS Analysis by Form, 2025 and 2035
  • Figure 96: South Asia & Pacific Market Y-o-Y Growth Comparison by Form, 2025-2035
  • Figure 97: South Asia & Pacific Market Attractiveness Analysis by Form
  • Figure 98: South Asia & Pacific Market Value Share and BPS Analysis by Flavour, 2025 and 2035
  • Figure 99: South Asia & Pacific Market Y-o-Y Growth Comparison by Flavour, 2025-2035
  • Figure 100: South Asia & Pacific Market Attractiveness Analysis by Flavour
  • Figure 101: South Asia & Pacific Market Value Share and BPS Analysis by Product Type, 2025 and 2035
  • Figure 102: South Asia & Pacific Market Y-o-Y Growth Comparison by Product Type, 2025-2035
  • Figure 103: South Asia & Pacific Market Attractiveness Analysis by Product Type
  • Figure 104: Middle East and Africa Market Value Share and BPS Analysis by Country, 2025 and 2035
  • Figure 105: Middle East and Africa Market Value Share and BPS Analysis by Nature, 2025 and 2035
  • Figure 106: Middle East and Africa Market Y-o-Y Growth Comparison by Nature, 2025-2035
  • Figure 107: Middle East and Africa Market Attractiveness Analysis by Nature
  • Figure 108: Middle East and Africa Market Value Share and BPS Analysis by Form, 2025 and 2035
  • Figure 109: Middle East and Africa Market Y-o-Y Growth Comparison by Form, 2025-2035
  • Figure 110: Middle East and Africa Market Attractiveness Analysis by Form
  • Figure 111: Middle East and Africa Market Value Share and BPS Analysis by Flavour, 2025 and 2035
  • Figure 112: Middle East and Africa Market Y-o-Y Growth Comparison by Flavour, 2025-2035
  • Figure 113: Middle East and Africa Market Attractiveness Analysis by Flavour
  • Figure 114: Middle East and Africa Market Value Share and BPS Analysis by Product Type, 2025 and 2035
  • Figure 115: Middle East and Africa Market Y-o-Y Growth Comparison by Product Type, 2025-2035
  • Figure 116: Middle East and Africa Market Attractiveness Analysis by Product Type
  • Figure 117: Global Market - Tier Structure Analysis
  • Figure 118: Global Market - Company Share Analys

Frequently Asked Questions

How big is the confectionery coating market in 2025?

The global market is estimated to be valued at USD 4.2 billion in 2025.

What will be the size of confectionery coating market in 2035?

The market size is projected to reach USD 7.0 billion by 2035.

How much will be the confectionery coating market growth between 2025 and 2035?

The market is expected to grow at a 5.2% CAGR between 2025 and 2035.

Which product type segment is expected to hold the largest share of the confectionery coating market in 2025?

The candies segment is the largest product type in the market, accounting for 34.0% of the market share in 2025.

Which is expected to register the highest CAGR in the confectionery coating market from 2025 to 2035?

The country expected to register the highest CAGR in the market from 2025 to 2035 is China, with a projected CAGR of 6.8%.

Explore Similar Insights

Future Market Insights

Confectionery Coating Market