Reports

- Global Locations -

Headquarters

Future Market Insights, Inc.

Christiana Corporate, 200
Continental Drive, Suite 401,
Newark, Delaware - 19713,
United States

T: +1-845-579-5705

Americas

Future Market Insights, Inc.

616 Corporate Way, Suite 2-9018,
Valley Cottage, NY 10989, United States

T: +1-347-918-3531

MEA

Future Market Insights

1602-6 Jumeirah Bay X2 Tower, Plot No: JLT-PH2-X2A,
Jumeirah Lakes Towers, Dubai,
United Arab Emirates

Europe

Future Market Insights

3rd Floor, 207 Regent Street,
W1B 3HH London
United Kingdom

T: + 44 (0) 20 8123 9659
D: +44 (0) 20 3287 4268

Asia Pacific

Future Market Insights

IndiaLand Global Tech Park, Unit UG-1, Behind Grand HighStreet, Phase 1, Hinjawadi, MH, Pune – 411057, India

Bakery Product Market Outlook from 2024 to 2034

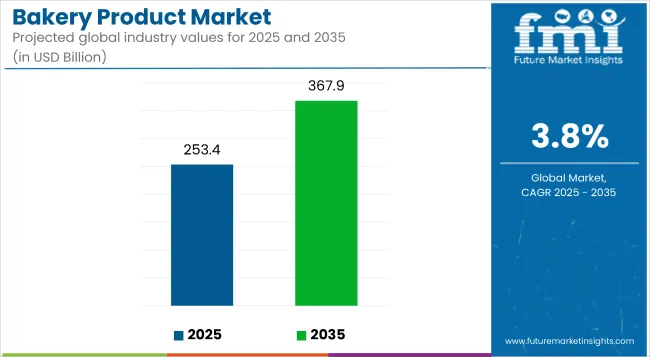
The global bakery product market is anticipated to escalate sluggishly at a CAGR of 3.80% to reach a market valuation of US$ 354.02 billion.

Moreover, the market is forecasted to reach US$ 244.14 billion by 2024. This advancement is attributed to various market forces and trends.

Attributes Key Insights
Estimated Market Size in 2024 US$ 244.14 billion
Projected Market Value in 2034 US$ 354.02 billion
Value-based CAGR from 2024 to 2034 3.80%

Don't pay for what you don't need

Customize your report by selecting specific countries or regions and save 30%!

Key Market Trends and Highlights

  • Consumer preferences have been changing recently. After the pandemic outbreak, many consumers started to prefer healthy food products, which drove the revolution of the bakery product market. Meeting consumer needs through healthy bakery items is a fundamental market trend.
  • The increasing rate of urbanization and industrialization has led to sedentary lifestyles. The increased speed of life has forced consumers to choose convenience food. Hence, this is another key trend in the industry.
  • Due to technological development, the production and storage of bakery items has been revolutionized. Consequently, more product experiments can be executed, another key market trend.

Demand Analysis of Bakery Product Market from 2019 to 2023 vs. Outlook from 2024 to 2034

A CAGR of 3.50% influenced the historical market advancement. With the help of this advancement, the market is anticipated to reach US$ 244.14 billion by 2024. The bakery product market was last measured at a market valuation of US$ 209.08 billion in 2019.

This market growth in the historical period is attributed to rapidly changing consumer preferences. In the hindsight of COVID-19, consumers started to prefer healthy food products. This surged the subject market in terms of healthy bakery items.

Furthermore, the rise of E-commerce platforms improved the reach of various marketers by reaching consumers. Due to this, the scope of growth of the subject market increased. Therefore, it created the demand for the market.

Historical CAGR from 2019 to 2023 3.50%
Forecast CAGR from 2024 to 2034 3.80%

On the other hand, the forecasted period growth is attributed to technological development and growth. This factor drives the market because the scope of innovation in the industry increases in terms of the taste, appearance, texture, and various other aspects of bakery items.

Further, similar to the historical period, the subject market has surged due to people's sedentary lifestyles. This is due to the rapid industrial growth. Also, the effectiveness of branding and marketing strategies has been surging the said market.

Nandini Roy Choudhury

Principal Consultant

Talk to Analyst

Find your sweet spots for generating winning opportunities in this market.

Market Drivers

  • Increasing consumer inclination to fast food has been accelerating the production of bakery items. Therefore, the subject market is driven by the direct force. This is coupled with the growing rate of urbanization, which increases the speed of an individual’s life, persuading him to choose staple and convenience food.
  • The rise of e-commerce platforms propels the market as the distribution of bakery products becomes easier. Hence, this is another critical market driver for the subject market.
  • Technological development enhances the scope for product innovation, attractive packaging, and differentiating recipes. Hence, differentiating products and expanding the market is possible, which is another key market driver.
  • The affordability of bakery products has increased due to the increased disposable income of an individual. Therefore, the approachability of the market rises, driving the bakery product market.

Market Challenges

  • Different geopolitical issues might disturb organizations' supply chains, which is the main market restraint for the global bakery product market.
  • Emerging fast food markets might hamper the subject market’s growth, increasing the competition for bakery products. Hence, this is another key market challenge.

Get the data you need at a Fraction of the cost

Personalize your report by choosing insights you need
and save 40%!

Comparative View of Adjacent Markets

Future Market Insights compares two adjacent markets of the bakery product market: the bakery ingredient market and the bakery enzymes market. The analysis of these allied markets is as follows:

Bakery Product Market:

Attributes Bakery Product Market
CAGR from 2024 to 2034 3.80%
Key Trends Innovating bakery production systems and equipment is the key trend in the bakery product market, accelerating the production of bakery products.
Growth Factor Due to the rising population and increasing sedentary lifestyle, convenience and ready-to-eat food are in demand, pushing the market.

Bakery Ingredient Market:

Attributes Bakery Ingredient Market
CAGR from 2023 to 2033 6.7%
Key Trends The demand for vegan food is rising due to increased awareness. This rising veganism is a key market trend and drives the subject market.
Growth Factor Chefs have been experimenting with producing bakery products with innovative ingredients, fueling the market advancement.

Bakery Enzymes Market:

Attributes Bakery Enzymes Market
CAGR from 2023 to 2033 5.1%
Key Trends Clearance from regulatory bodies to innovate bakery enzymes is a key trend in the market that key marketers have been concentrating on.
Growth Factor Increasing worldwide bakery product consumption is the fundamental market driver, fueling the production of bakery enzymes.

Country-wise Analysis

Due to the rising demand for staple and convenience food, the production of bakery items is rising. The sedentary lifestyle in many North American countries is growing. This surges the demand for bakery products.

Easy accessibility and the affordability of bakery items fuel the market growth. Thus, North America is one of the market leaders in the global bakery product market.

Further, the consumption of bakery items is increasing in Europe; therefore, the region is a key contributor to the subject market.

Latin America, Asia-Pacific, Oceania, etc., also contribute to the subject market, helping the market to get propelled.

Forecast CAGRs from 2024 to 2034

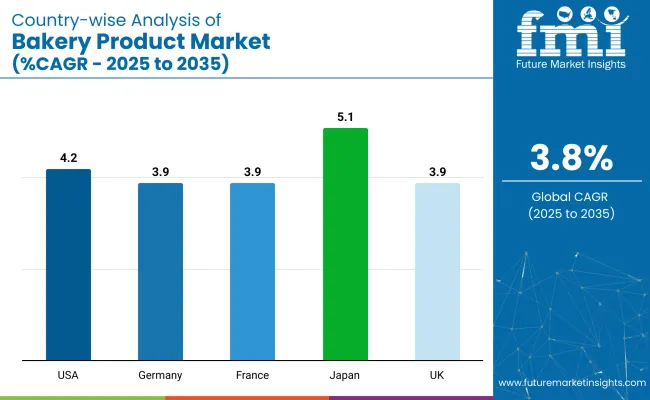
Countries CAGR through 2034
The United States 4.2%
Germany 3.9%
China 4.8%
Japan 5.1%
India 5.5%

Increased Demand for Convenience Food Drives the Bakery Product Market in the United States of America

  • The United States of America promises moderate advancement at a CAGR of 4.2% through 2034. This helps the country to lead North America.
  • Consumers have started to demand ready-to-eat food products, which surge for relevant food products.
  • Bakery items supplement with a wide range of cuisines; hence, they are more demanded.
  • As bakery products, including bread and cereals, fulfill the American population's requirements, they drive the subject market.

Increased Consumer Inclination to Staple Food and its Affordability Propels the German Bakery Product Market

  • The German population has started to get inclined toward staple food items. The main reason behind this is that rapid industrialization has increased the speed of life.
  • Bakery products are readily available, which fulfill consumers’ demands.
  • Furthermore, the affordability of bakery products has been driving the market by increasing its reach.
  • These factors ensure that the subject market will advance at a CAGR of 3.9%.

Surge in Gluten-Free Products Surges the Chinese Bakery Product Market

  • Health awareness among consumers has been rising recently in China.
  • Due to this, consumers have started to shift toward healthy food products that will suit their lifestyles.
  • Gluten-free bakery products fulfill their demand; hence, the Chinese population is more inclined towards these products, which drives the market.
  • Consequently, the advancement of the Chinese market is forecasted to be at a CAGR of 4.8% through 2034.

Rising Health Consciousness among Consumers Surge Healthy Bakery Products in Japan

  • Similar to China, the Japanese population is also inclined toward healthy food products, surging the market and promising its advancement at a CAGR of 5.1%.
  • Japan focuses on manufacturing healthy bakery products. Therefore, this drives the bakery product market to produce healthy consumables.
  • Low-carb products are favored by the Japanese, which drives the said market.
  • White flour is replaced by barn and soy, driving the market through healthy baked items.

Influence of the Western Culture Drives the Indian Bakery Product Market

  • The Indian bakery product market is forecasted to advance at a CAGR of 5.5%, the highest among all the countries.
  • The Western culture highly influences the Indian population.
  • Hence, the demand for cakes, pastries, and other consumables is rising. These are used on special occasions like birthdays and anniversaries.
  • Consequently, the market has mainly surged due to the rising demand for Western bakery food items.

Category-wise Insights

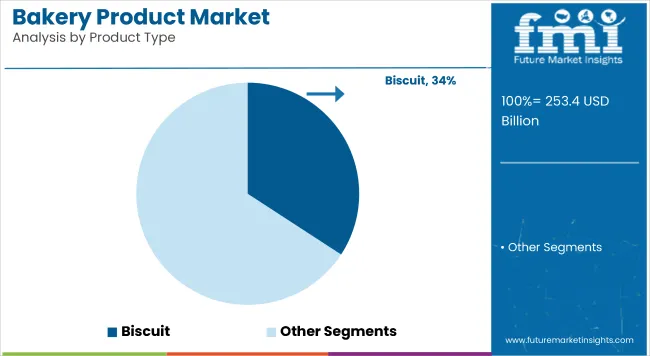
Category Product Type (Biscuits)
Market Share in 2024 34.2%
Market Segment Drivers
  • The widespread reach of biscuits defines the popularity of the market segment. Consequently, this is the fundamental market driver that drives the subject segment.
  • Due to biscuits' easy availability and affordability, this market segment has better reach and propels to secure a significant market share.
  • Including biscuits in the daily routine has helped the market segment grow significantly. Hence, this is another market segment driver.
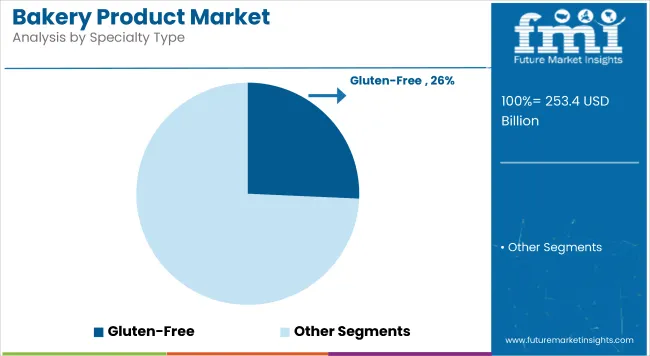
Category Specialty Type (Gluten Free)
Market Share in 2024 25.7%
Market Segment Drivers
  • The rising popularity of gluten-free diets has helped the market segment to catch demand. Hence, this is the fundamental market driver.
  • Increasing health consciousness has surged the demand for gluten-free products, which drives the market segment.

Competitive Landscape

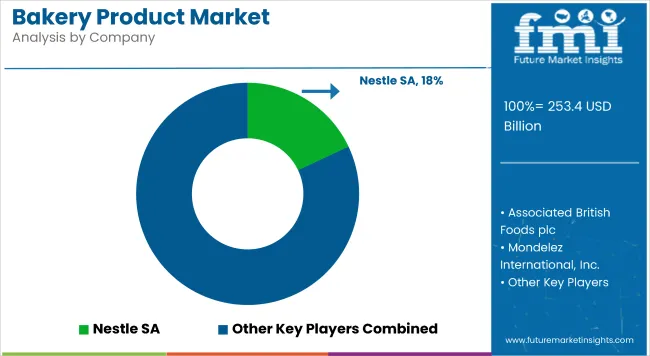
In the case of the bakery product market, it is a highly cluttered sector. Due to the presence of multiple large-scale organizations, the competitive landscape of the subject industry is fierce.

Key players within the industry strive to achieve a competitive niche in the market through their differentiated product portfolio. Product innovation is the fundamental source for the competitors to penetrate the market and secure substantial market share.

Strategic alliances, partnerships, mergers and acquisitions, product innovation, and market diversification are key strategic initiatives businesses take to expand in the subject market.

Key Market Developments

  • In September 2021, Mondelez International Inc. entered the snack bar segment. The organization took this initiative to meet the rising consumer demand for nutritional foods. Due to this, the scope of growth for the organization is enhanced.
  • In October 2023, Finsbury Food Group Plc. Introduced the Skittles cake, a new product in its existing product portfolio. This product development has helped the organization to penetrate the market, bolstering its market presence.
  • In January 2024, Nestle invested US$ 100 million in its coffee factory in Vietnam. Due to this monetary investment, the scope of meeting customer needs is enhanced. Consequently, the market position of the said organization gets bolstered.

Key Coverage of Bakery Product Market Report

  • Analysis of the market occupancy of key players, including their share analysis.
  • Restraints, drivers, threats, and opportunities for the subject market in different circumstances.
  • Different strategic movements and growth initiatives of key competitors.
  • Coverage of key market dynamics.
  • Market forecast under different external forces analysed using theoretical frameworks.

Report Scope

Attributes Details
Estimated Market Size in 2024 US$ 244.14 billion
Projected Market Valuation in 2034 US$ 354.02 billion
Value-based CAGR 2024 to 2034 3.80%
Forecast Period 2024 to 2034
Historical Data Available for 2019 to 2023
Market Analysis Value in US$ billion
Key Regions Covered
  • North America
  • Latin America
  • Western Europe
  • Eastern Europe
  • South Asia and Pacific
  • East Asia
  • The Middle East & Africa
Key Market Segments Covered
  • By Product Type
  • By Specialty Type
  • By Distribution Channel
  • Region
Key Countries Profiled
  • The United States of America
  • Canada
  • Brazil
  • Mexico
  • Germany
  • The United Kingdom
  • Spain
  • Italy
  • France
  • Russia
  • Poland
  • China
  • India
  • Japan
  • Australia
  • New Zealand
  • GCC Countries
  • North Africa
  • South Africa
Key Companies Profiled
  • Nestle SA
  • Associated British Foods plc
  • Mondelez International Inc.
  • Finsbury Food Group Plc
  • Bimbo Bakeries USA
  • Britannia Industries
  • Flowers Foods Inc.
  • Rich Products Corporation
  • Dr. August Oetker Nahrungsmittel KG
  • Gruma, S.A.B. de C.V.
  • Bakers Delight Holdings
  • Grupo Bimbo S.A.B de C.V.
  • Yamazaki Baking Co. Ltd.
  • JAB Holding Company
  • ARYZTA AG
  • General Mills Inc.
  • Others

Bakery Product Market- Key Segments

By Product Type:

  • Biscuits
    • Cookies
    • Non-Salt Cracker Biscuits
    • Salt Cracker Biscuits
    • Milk Biscuits
    • Cream Biscuits
    • Glucose Biscuits
    • Marie Biscuits
    • Others
  • Bread and Rolls
    • Artisanal
    • In-Store
    • Packaged
  • Cakes and Pastries
    • Artisanal
    • In-Store
    • Packaged
    • Pizza Crusts
    • Rusks

By Specialty Type:

  • Gluten-free
  • Fortified
  • Organic
  • Low-calorie
  • Sugar-free

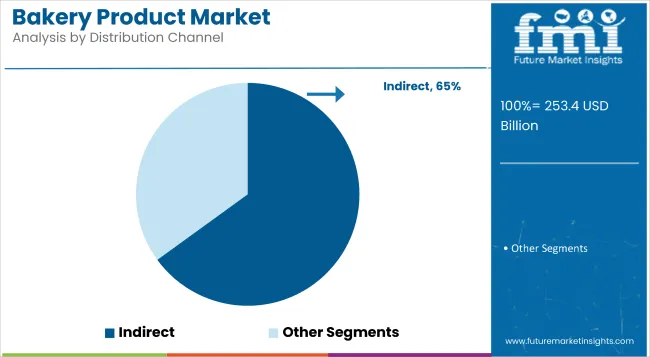
By Distribution Channel:

  • Direct
  • Indirect
  • Hypermarkets/Supermarkets
  • Convenience Store
  • Bakery Stores
  • Artisanal Bakeries
  • Online Retailers

By Region:

  • North America
  • Latin America
  • Europe
  • East Asia
  • South Asia
  • Oceania
  • Middle East & Africa

Frequently Asked Questions

At what rate is the bakery product market growing?

The bakery product market is anticipated to advance at a CAGR of 3.80% through 2034.

What is the scope of advancement for the bakery product market by 2034?

The bakery product market is expected to hit a market valuation of US$ 354.02 billion by 2034.

What will the bakery product market size be by 2024?

The bakery product market reached US$ 244.14 billion in 2024.

Based on the product type, which segment holds the largest bakery market share?

The bakery product market's biscuits segment holds 34.2%.

Based on the specialty type, which segment holds the largest bakery market share?

The bakery product market's gluten-free segment holds 25.7%.

Table of Content

1. Executive Summary

    1.1. Global Market Outlook

    1.2. Demand-side Trends

    1.3. Supply-side Trends

    1.4. Technology Roadmap Analysis

    1.5. Analysis and Recommendations

2. Market Overview

    2.1. Market Coverage / Taxonomy

    2.2. Market Definition / Scope / Limitations

3. Market Background

    3.1. Market Dynamics

        3.1.1. Drivers

        3.1.2. Restraints

        3.1.3. Opportunity

        3.1.4. Trends

    3.2. Scenario Forecast

        3.2.1. Demand in Optimistic Scenario

        3.2.2. Demand in Likely Scenario

        3.2.3. Demand in Conservative Scenario

    3.3. Opportunity Map Analysis

    3.4. Product Life Cycle Analysis

    3.5. Supply Chain Analysis

        3.5.1. Supply Side Participants and their Roles

            3.5.1.1. Manufacturer

            3.5.1.2. Mid-Level Participants (Traders)

            3.5.1.3. Wholesalers and Distributors

        3.5.2. Value Added and Value Created at Node in the Supply Chain

        3.5.3. List of Raw Material Suppliers

        3.5.4. List of Existing and Potential Buyer’s

    3.6. Investment Feasibility Matrix

    3.7. Value Chain Analysis

        3.7.1. Profit Margin Analysis

        3.7.2. Wholesalers and Distributors

        3.7.3. Retailers

    3.8. PESTLE and Porter’s Analysis

    3.9. Regulatory Landscape

        3.9.1. By Key Regions

        3.9.2. By Key Countries

    3.10. Regional Parent Market Outlook

    3.11. Production and Consumption Statistics

    3.12. Import and Export Statistics

4. Global Market Analysis 2019 to 2023 and Forecast, 2024 to 2034

    4.1. Historical Market Size Value (US$ Million) & Volume (Unit Pack) Analysis, 2019 to 2023

    4.2. Current and Future Market Size Value (US$ Million) & Volume (Unit Pack) Projections, 2024 to 2034

        4.2.1. Y-o-Y Growth Trend Analysis

        4.2.2. Absolute $ Opportunity Analysis

5. Global Market Analysis 2019 to 2023 and Forecast 2024 to 2034, By Product Type

    5.1. Introduction / Key Findings

    5.2. Historical Market Size Value (US$ Million) & Volume (Unit Pack) Analysis By Product Type, 2019 to 2023

    5.3. Current and Future Market Size Value (US$ Million) & Volume (Unit Pack) Analysis and Forecast By Product Type, 2024 to 2034

        5.3.1. Biscuits

            5.3.1.1. Cookies

            5.3.1.2. Non-Salt Cracker Biscuits

            5.3.1.3. Salt Cracker Biscuits

            5.3.1.4. Milk Biscuits

            5.3.1.5. Cream Biscuits

            5.3.1.6. Glucose Biscuits

            5.3.1.7. Marie Biscuits

            5.3.1.8. Others

        5.3.2. Bread and Rolls

            5.3.2.1. Artisanal

            5.3.2.2. In-Store

            5.3.2.3. Packaged

        5.3.3. Cakes and Pastries

            5.3.3.1. Artisanal

            5.3.3.2. In-Store

            5.3.3.3. Packaged

            5.3.3.4. Pizza Crusts

            5.3.3.5. Rusks

    5.4. Y-o-Y Growth Trend Analysis By Product Type, 2019 to 2023

    5.5. Absolute $ Opportunity Analysis By Product Type, 2024 to 2034

6. Global Market Analysis 2019 to 2023 and Forecast 2024 to 2034, By Specialty Type

    6.1. Introduction / Key Findings

    6.2. Historical Market Size Value (US$ Million) & Volume (Unit Pack) Analysis By Specialty Type, 2019 to 2023

    6.3. Current and Future Market Size Value (US$ Million) & Volume (Unit Pack) Analysis and Forecast By Specialty Type, 2024 to 2034

        6.3.1. Gluten-Free

        6.3.2. Fortified

        6.3.3. Organic

        6.3.4. Low-Calorie

        6.3.5. Sugar-Free

    6.4. Y-o-Y Growth Trend Analysis By Specialty Type, 2019 to 2023

    6.5. Absolute $ Opportunity Analysis By Specialty Type, 2024 to 2034

7. Global Market Analysis 2019 to 2023 and Forecast 2024 to 2034, By Distribution Channel

    7.1. Introduction / Key Findings

    7.2. Historical Market Size Value (US$ Million) & Volume (Unit Pack) Analysis By Distribution Channel, 2019 to 2023

    7.3. Current and Future Market Size Value (US$ Million) & Volume (Unit Pack) Analysis and Forecast By Distribution Channel, 2024 to 2034

        7.3.1. Direct

        7.3.2. Indirect

            7.3.2.1. Hypermarkets/Supermarkets

            7.3.2.2. Convenience Store

            7.3.2.3. Bakery Stores

            7.3.2.4. Artisanal Bakeries

            7.3.2.5. Online Retailers

    7.4. Y-o-Y Growth Trend Analysis By Distribution Channel, 2019 to 2023

    7.5. Absolute $ Opportunity Analysis By Distribution Channel, 2024 to 2034

8. Global Market Analysis 2019 to 2023 and Forecast 2024 to 2034, By Region

    8.1. Introduction

    8.2. Historical Market Size Value (US$ Million) & Volume (Unit Pack) Analysis By Region, 2019 to 2023

    8.3. Current Market Size Value (US$ Million) & Volume (Unit Pack) Analysis and Forecast By Region, 2024 to 2034

        8.3.1. North America

        8.3.2. Latin America

        8.3.3. Western Europe

        8.3.4. Eastern Europe

        8.3.5. South Asia and Pacific

        8.3.6. East Asia

        8.3.7. Middle East and Africa

    8.4. Market Attractiveness Analysis By Region

9. North America Market Analysis 2019 to 2023 and Forecast 2024 to 2034, By Country

    9.1. Historical Market Size Value (US$ Million) & Volume (Unit Pack) Trend Analysis By Market Taxonomy, 2019 to 2023

    9.2. Market Size Value (US$ Million) & Volume (Unit Pack) Forecast By Market Taxonomy, 2024 to 2034

        9.2.1. By Country

            9.2.1.1. USA

            9.2.1.2. Canada

        9.2.2. By Product Type

        9.2.3. By Specialty Type

        9.2.4. By Distribution Channel

    9.3. Market Attractiveness Analysis

        9.3.1. By Country

        9.3.2. By Product Type

        9.3.3. By Specialty Type

        9.3.4. By Distribution Channel

    9.4. Key Takeaways

10. Latin America Market Analysis 2019 to 2023 and Forecast 2024 to 2034, By Country

    10.1. Historical Market Size Value (US$ Million) & Volume (Unit Pack) Trend Analysis By Market Taxonomy, 2019 to 2023

    10.2. Market Size Value (US$ Million) & Volume (Unit Pack) Forecast By Market Taxonomy, 2024 to 2034

        10.2.1. By Country

            10.2.1.1. Brazil

            10.2.1.2. Mexico

            10.2.1.3. Rest of Latin America

        10.2.2. By Product Type

        10.2.3. By Specialty Type

        10.2.4. By Distribution Channel

    10.3. Market Attractiveness Analysis

        10.3.1. By Country

        10.3.2. By Product Type

        10.3.3. By Specialty Type

        10.3.4. By Distribution Channel

    10.4. Key Takeaways

11. Western Europe Market Analysis 2019 to 2023 and Forecast 2024 to 2034, By Country

    11.1. Historical Market Size Value (US$ Million) & Volume (Unit Pack) Trend Analysis By Market Taxonomy, 2019 to 2023

    11.2. Market Size Value (US$ Million) & Volume (Unit Pack) Forecast By Market Taxonomy, 2024 to 2034

        11.2.1. By Country

            11.2.1.1. Germany

            11.2.1.2. UK

            11.2.1.3. France

            11.2.1.4. Spain

            11.2.1.5. Italy

            11.2.1.6. Rest of Western Europe

        11.2.2. By Product Type

        11.2.3. By Specialty Type

        11.2.4. By Distribution Channel

    11.3. Market Attractiveness Analysis

        11.3.1. By Country

        11.3.2. By Product Type

        11.3.3. By Specialty Type

        11.3.4. By Distribution Channel

    11.4. Key Takeaways

12. Eastern Europe Market Analysis 2019 to 2023 and Forecast 2024 to 2034, By Country

    12.1. Historical Market Size Value (US$ Million) & Volume (Unit Pack) Trend Analysis By Market Taxonomy, 2019 to 2023

    12.2. Market Size Value (US$ Million) & Volume (Unit Pack) Forecast By Market Taxonomy, 2024 to 2034

        12.2.1. By Country

            12.2.1.1. Poland

            12.2.1.2. Russia

            12.2.1.3. Czech Republic

            12.2.1.4. Romania

            12.2.1.5. Rest of Eastern Europe

        12.2.2. By Product Type

        12.2.3. By Specialty Type

        12.2.4. By Distribution Channel

    12.3. Market Attractiveness Analysis

        12.3.1. By Country

        12.3.2. By Product Type

        12.3.3. By Specialty Type

        12.3.4. By Distribution Channel

    12.4. Key Takeaways

13. South Asia and Pacific Market Analysis 2019 to 2023 and Forecast 2024 to 2034, By Country

    13.1. Historical Market Size Value (US$ Million) & Volume (Unit Pack) Trend Analysis By Market Taxonomy, 2019 to 2023

    13.2. Market Size Value (US$ Million) & Volume (Unit Pack) Forecast By Market Taxonomy, 2024 to 2034

        13.2.1. By Country

            13.2.1.1. India

            13.2.1.2. Bangladesh

            13.2.1.3. Australia

            13.2.1.4. New Zealand

            13.2.1.5. Rest of South Asia and Pacific

        13.2.2. By Product Type

        13.2.3. By Specialty Type

        13.2.4. By Distribution Channel

    13.3. Market Attractiveness Analysis

        13.3.1. By Country

        13.3.2. By Product Type

        13.3.3. By Specialty Type

        13.3.4. By Distribution Channel

    13.4. Key Takeaways

14. East Asia Market Analysis 2019 to 2023 and Forecast 2024 to 2034, By Country

    14.1. Historical Market Size Value (US$ Million) & Volume (Unit Pack) Trend Analysis By Market Taxonomy, 2019 to 2023

    14.2. Market Size Value (US$ Million) & Volume (Unit Pack) Forecast By Market Taxonomy, 2024 to 2034

        14.2.1. By Country

            14.2.1.1. China

            14.2.1.2. Japan

            14.2.1.3. South Korea

        14.2.2. By Product Type

        14.2.3. By Specialty Type

        14.2.4. By Distribution Channel

    14.3. Market Attractiveness Analysis

        14.3.1. By Country

        14.3.2. By Product Type

        14.3.3. By Specialty Type

        14.3.4. By Distribution Channel

    14.4. Key Takeaways

15. Middle East and Africa Market Analysis 2019 to 2023 and Forecast 2024 to 2034, By Country

    15.1. Historical Market Size Value (US$ Million) & Volume (Unit Pack) Trend Analysis By Market Taxonomy, 2019 to 2023

    15.2. Market Size Value (US$ Million) & Volume (Unit Pack) Forecast By Market Taxonomy, 2024 to 2034

        15.2.1. By Country

            15.2.1.1. GCC Countries

            15.2.1.2. South Africa

            15.2.1.3. Israel

            15.2.1.4. Rest of MEA

        15.2.2. By Product Type

        15.2.3. By Specialty Type

        15.2.4. By Distribution Channel

    15.3. Market Attractiveness Analysis

        15.3.1. By Country

        15.3.2. By Product Type

        15.3.3. By Specialty Type

        15.3.4. By Distribution Channel

    15.4. Key Takeaways

16. Key Countries Market Analysis

    16.1. USA

        16.1.1. Pricing Analysis

        16.1.2. Market Share Analysis, 2023

            16.1.2.1. By Product Type

            16.1.2.2. By Specialty Type

            16.1.2.3. By Distribution Channel

    16.2. Canada

        16.2.1. Pricing Analysis

        16.2.2. Market Share Analysis, 2023

            16.2.2.1. By Product Type

            16.2.2.2. By Specialty Type

            16.2.2.3. By Distribution Channel

    16.3. Brazil

        16.3.1. Pricing Analysis

        16.3.2. Market Share Analysis, 2023

            16.3.2.1. By Product Type

            16.3.2.2. By Specialty Type

            16.3.2.3. By Distribution Channel

    16.4. Mexico

        16.4.1. Pricing Analysis

        16.4.2. Market Share Analysis, 2023

            16.4.2.1. By Product Type

            16.4.2.2. By Specialty Type

            16.4.2.3. By Distribution Channel

    16.5. Germany

        16.5.1. Pricing Analysis

        16.5.2. Market Share Analysis, 2023

            16.5.2.1. By Product Type

            16.5.2.2. By Specialty Type

            16.5.2.3. By Distribution Channel

    16.6. UK

        16.6.1. Pricing Analysis

        16.6.2. Market Share Analysis, 2023

            16.6.2.1. By Product Type

            16.6.2.2. By Specialty Type

            16.6.2.3. By Distribution Channel

    16.7. France

        16.7.1. Pricing Analysis

        16.7.2. Market Share Analysis, 2023

            16.7.2.1. By Product Type

            16.7.2.2. By Specialty Type

            16.7.2.3. By Distribution Channel

    16.8. Spain

        16.8.1. Pricing Analysis

        16.8.2. Market Share Analysis, 2023

            16.8.2.1. By Product Type

            16.8.2.2. By Specialty Type

            16.8.2.3. By Distribution Channel

    16.9. Italy

        16.9.1. Pricing Analysis

        16.9.2. Market Share Analysis, 2023

            16.9.2.1. By Product Type

            16.9.2.2. By Specialty Type

            16.9.2.3. By Distribution Channel

    16.10. Poland

        16.10.1. Pricing Analysis

        16.10.2. Market Share Analysis, 2023

            16.10.2.1. By Product Type

            16.10.2.2. By Specialty Type

            16.10.2.3. By Distribution Channel

    16.11. Russia

        16.11.1. Pricing Analysis

        16.11.2. Market Share Analysis, 2023

            16.11.2.1. By Product Type

            16.11.2.2. By Specialty Type

            16.11.2.3. By Distribution Channel

    16.12. Czech Republic

        16.12.1. Pricing Analysis

        16.12.2. Market Share Analysis, 2023

            16.12.2.1. By Product Type

            16.12.2.2. By Specialty Type

            16.12.2.3. By Distribution Channel

    16.13. Romania

        16.13.1. Pricing Analysis

        16.13.2. Market Share Analysis, 2023

            16.13.2.1. By Product Type

            16.13.2.2. By Specialty Type

            16.13.2.3. By Distribution Channel

    16.14. India

        16.14.1. Pricing Analysis

        16.14.2. Market Share Analysis, 2023

            16.14.2.1. By Product Type

            16.14.2.2. By Specialty Type

            16.14.2.3. By Distribution Channel

    16.15. Bangladesh

        16.15.1. Pricing Analysis

        16.15.2. Market Share Analysis, 2023

            16.15.2.1. By Product Type

            16.15.2.2. By Specialty Type

            16.15.2.3. By Distribution Channel

    16.16. Australia

        16.16.1. Pricing Analysis

        16.16.2. Market Share Analysis, 2023

            16.16.2.1. By Product Type

            16.16.2.2. By Specialty Type

            16.16.2.3. By Distribution Channel

    16.17. New Zealand

        16.17.1. Pricing Analysis

        16.17.2. Market Share Analysis, 2023

            16.17.2.1. By Product Type

            16.17.2.2. By Specialty Type

            16.17.2.3. By Distribution Channel

    16.18. China

        16.18.1. Pricing Analysis

        16.18.2. Market Share Analysis, 2023

            16.18.2.1. By Product Type

            16.18.2.2. By Specialty Type

            16.18.2.3. By Distribution Channel

    16.19. Japan

        16.19.1. Pricing Analysis

        16.19.2. Market Share Analysis, 2023

            16.19.2.1. By Product Type

            16.19.2.2. By Specialty Type

            16.19.2.3. By Distribution Channel

    16.20. South Korea

        16.20.1. Pricing Analysis

        16.20.2. Market Share Analysis, 2023

            16.20.2.1. By Product Type

            16.20.2.2. By Specialty Type

            16.20.2.3. By Distribution Channel

    16.21. GCC Countries

        16.21.1. Pricing Analysis

        16.21.2. Market Share Analysis, 2023

            16.21.2.1. By Product Type

            16.21.2.2. By Specialty Type

            16.21.2.3. By Distribution Channel

    16.22. South Africa

        16.22.1. Pricing Analysis

        16.22.2. Market Share Analysis, 2023

            16.22.2.1. By Product Type

            16.22.2.2. By Specialty Type

            16.22.2.3. By Distribution Channel

    16.23. Israel

        16.23.1. Pricing Analysis

        16.23.2. Market Share Analysis, 2023

            16.23.2.1. By Product Type

            16.23.2.2. By Specialty Type

            16.23.2.3. By Distribution Channel

17. Market Structure Analysis

    17.1. Competition Dashboard

    17.2. Competition Benchmarking

    17.3. Market Share Analysis of Top Players

        17.3.1. By Regional

        17.3.2. By Product Type

        17.3.3. By Specialty Type

        17.3.4. By Distribution Channel

18. Competition Analysis

    18.1. Competition Deep Dive

        18.1.1. Nestle SA

            18.1.1.1. Overview

            18.1.1.2. Product Portfolio

            18.1.1.3. Profitability by Market Segments

            18.1.1.4. Sales Footprint

            18.1.1.5. Strategy Overview

                18.1.1.5.1. Marketing Strategy

                18.1.1.5.2. Product Strategy

                18.1.1.5.3. Channel Strategy

        18.1.2. Associated British Foods plc

            18.1.2.1. Overview

            18.1.2.2. Product Portfolio

            18.1.2.3. Profitability by Market Segments

            18.1.2.4. Sales Footprint

            18.1.2.5. Strategy Overview

                18.1.2.5.1. Marketing Strategy

                18.1.2.5.2. Product Strategy

                18.1.2.5.3. Channel Strategy

        18.1.3. Mondelez International, Inc.

            18.1.3.1. Overview

            18.1.3.2. Product Portfolio

            18.1.3.3. Profitability by Market Segments

            18.1.3.4. Sales Footprint

            18.1.3.5. Strategy Overview

                18.1.3.5.1. Marketing Strategy

                18.1.3.5.2. Product Strategy

                18.1.3.5.3. Channel Strategy

        18.1.4. Finsbury Food Group Plc

            18.1.4.1. Overview

            18.1.4.2. Product Portfolio

            18.1.4.3. Profitability by Market Segments

            18.1.4.4. Sales Footprint

            18.1.4.5. Strategy Overview

                18.1.4.5.1. Marketing Strategy

                18.1.4.5.2. Product Strategy

                18.1.4.5.3. Channel Strategy

        18.1.5. Bimbo Bakeries USA

            18.1.5.1. Overview

            18.1.5.2. Product Portfolio

            18.1.5.3. Profitability by Market Segments

            18.1.5.4. Sales Footprint

            18.1.5.5. Strategy Overview

                18.1.5.5.1. Marketing Strategy

                18.1.5.5.2. Product Strategy

                18.1.5.5.3. Channel Strategy

        18.1.6. Britannia Industries

            18.1.6.1. Overview

            18.1.6.2. Product Portfolio

            18.1.6.3. Profitability by Market Segments

            18.1.6.4. Sales Footprint

            18.1.6.5. Strategy Overview

                18.1.6.5.1. Marketing Strategy

                18.1.6.5.2. Product Strategy

                18.1.6.5.3. Channel Strategy

        18.1.7. Flowers Foods, Inc.

            18.1.7.1. Overview

            18.1.7.2. Product Portfolio

            18.1.7.3. Profitability by Market Segments

            18.1.7.4. Sales Footprint

            18.1.7.5. Strategy Overview

                18.1.7.5.1. Marketing Strategy

                18.1.7.5.2. Product Strategy

                18.1.7.5.3. Channel Strategy

        18.1.8. Rich Product Corporation

            18.1.8.1. Overview

            18.1.8.2. Product Portfolio

            18.1.8.3. Profitability by Market Segments

            18.1.8.4. Sales Footprint

            18.1.8.5. Strategy Overview

                18.1.8.5.1. Marketing Strategy

                18.1.8.5.2. Product Strategy

                18.1.8.5.3. Channel Strategy

        18.1.9. Dr. August Oetker Nahrungsmittel KG

            18.1.9.1. Overview

            18.1.9.2. Product Portfolio

            18.1.9.3. Profitability by Market Segments

            18.1.9.4. Sales Footprint

            18.1.9.5. Strategy Overview

                18.1.9.5.1. Marketing Strategy

                18.1.9.5.2. Product Strategy

                18.1.9.5.3. Channel Strategy

        18.1.10. Gruma, S.A.B. de C.V.

            18.1.10.1. Overview

            18.1.10.2. Product Portfolio

            18.1.10.3. Profitability by Market Segments

            18.1.10.4. Sales Footprint

            18.1.10.5. Strategy Overview

                18.1.10.5.1. Marketing Strategy

                18.1.10.5.2. Product Strategy

                18.1.10.5.3. Channel Strategy

        18.1.11. Bakers Delight Holdings

            18.1.11.1. Overview

            18.1.11.2. Product Portfolio

            18.1.11.3. Profitability by Market Segments

            18.1.11.4. Sales Footprint

            18.1.11.5. Strategy Overview

                18.1.11.5.1. Marketing Strategy

                18.1.11.5.2. Product Strategy

                18.1.11.5.3. Channel Strategy

        18.1.12. Grupo Bimbo S.A.B de C.V.

            18.1.12.1. Overview

            18.1.12.2. Product Portfolio

            18.1.12.3. Profitability by Market Segments

            18.1.12.4. Sales Footprint

            18.1.12.5. Strategy Overview

                18.1.12.5.1. Marketing Strategy

                18.1.12.5.2. Product Strategy

                18.1.12.5.3. Channel Strategy

        18.1.13. Yamazaki Baking Co., Ltd.

            18.1.13.1. Overview

            18.1.13.2. Product Portfolio

            18.1.13.3. Profitability by Market Segments

            18.1.13.4. Sales Footprint

            18.1.13.5. Strategy Overview

                18.1.13.5.1. Marketing Strategy

                18.1.13.5.2. Product Strategy

                18.1.13.5.3. Channel Strategy

        18.1.14. JAB Holding Company

            18.1.14.1. Overview

            18.1.14.2. Product Portfolio

            18.1.14.3. Profitability by Market Segments

            18.1.14.4. Sales Footprint

            18.1.14.5. Strategy Overview

                18.1.14.5.1. Marketing Strategy

                18.1.14.5.2. Product Strategy

                18.1.14.5.3. Channel Strategy

19. Assumptions & Acronyms Used

20. Research Methodology

List of Tables

Table 1: Global Market Value (US$ Million) Forecast by Region, 2019 to 2034

Table 2: Global Market Volume (Unit Pack) Forecast by Region, 2019 to 2034

Table 3: Global Market Value (US$ Million) Forecast by Product Type, 2019 to 2034

Table 4: Global Market Volume (Unit Pack) Forecast by Product Type, 2019 to 2034

Table 5: Global Market Value (US$ Million) Forecast by Specialty Type, 2019 to 2034

Table 6: Global Market Volume (Unit Pack) Forecast by Specialty Type, 2019 to 2034

Table 7: Global Market Value (US$ Million) Forecast by Distribution Channel, 2019 to 2034

Table 8: Global Market Volume (Unit Pack) Forecast by Distribution Channel, 2019 to 2034

Table 9: North America Market Value (US$ Million) Forecast by Country, 2019 to 2034

Table 10: North America Market Volume (Unit Pack) Forecast by Country, 2019 to 2034

Table 11: North America Market Value (US$ Million) Forecast by Product Type, 2019 to 2034

Table 12: North America Market Volume (Unit Pack) Forecast by Product Type, 2019 to 2034

Table 13: North America Market Value (US$ Million) Forecast by Specialty Type, 2019 to 2034

Table 14: North America Market Volume (Unit Pack) Forecast by Specialty Type, 2019 to 2034

Table 15: North America Market Value (US$ Million) Forecast by Distribution Channel, 2019 to 2034

Table 16: North America Market Volume (Unit Pack) Forecast by Distribution Channel, 2019 to 2034

Table 17: Latin America Market Value (US$ Million) Forecast by Country, 2019 to 2034

Table 18: Latin America Market Volume (Unit Pack) Forecast by Country, 2019 to 2034

Table 19: Latin America Market Value (US$ Million) Forecast by Product Type, 2019 to 2034

Table 20: Latin America Market Volume (Unit Pack) Forecast by Product Type, 2019 to 2034

Table 21: Latin America Market Value (US$ Million) Forecast by Specialty Type, 2019 to 2034

Table 22: Latin America Market Volume (Unit Pack) Forecast by Specialty Type, 2019 to 2034

Table 23: Latin America Market Value (US$ Million) Forecast by Distribution Channel, 2019 to 2034

Table 24: Latin America Market Volume (Unit Pack) Forecast by Distribution Channel, 2019 to 2034

Table 25: Western Europe Market Value (US$ Million) Forecast by Country, 2019 to 2034

Table 26: Western Europe Market Volume (Unit Pack) Forecast by Country, 2019 to 2034

Table 27: Western Europe Market Value (US$ Million) Forecast by Product Type, 2019 to 2034

Table 28: Western Europe Market Volume (Unit Pack) Forecast by Product Type, 2019 to 2034

Table 29: Western Europe Market Value (US$ Million) Forecast by Specialty Type, 2019 to 2034

Table 30: Western Europe Market Volume (Unit Pack) Forecast by Specialty Type, 2019 to 2034

Table 31: Western Europe Market Value (US$ Million) Forecast by Distribution Channel, 2019 to 2034

Table 32: Western Europe Market Volume (Unit Pack) Forecast by Distribution Channel, 2019 to 2034

Table 33: Eastern Europe Market Value (US$ Million) Forecast by Country, 2019 to 2034

Table 34: Eastern Europe Market Volume (Unit Pack) Forecast by Country, 2019 to 2034

Table 35: Eastern Europe Market Value (US$ Million) Forecast by Product Type, 2019 to 2034

Table 36: Eastern Europe Market Volume (Unit Pack) Forecast by Product Type, 2019 to 2034

Table 37: Eastern Europe Market Value (US$ Million) Forecast by Specialty Type, 2019 to 2034

Table 38: Eastern Europe Market Volume (Unit Pack) Forecast by Specialty Type, 2019 to 2034

Table 39: Eastern Europe Market Value (US$ Million) Forecast by Distribution Channel, 2019 to 2034

Table 40: Eastern Europe Market Volume (Unit Pack) Forecast by Distribution Channel, 2019 to 2034

Table 41: South Asia and Pacific Market Value (US$ Million) Forecast by Country, 2019 to 2034

Table 42: South Asia and Pacific Market Volume (Unit Pack) Forecast by Country, 2019 to 2034

Table 43: South Asia and Pacific Market Value (US$ Million) Forecast by Product Type, 2019 to 2034

Table 44: South Asia and Pacific Market Volume (Unit Pack) Forecast by Product Type, 2019 to 2034

Table 45: South Asia and Pacific Market Value (US$ Million) Forecast by Specialty Type, 2019 to 2034

Table 46: South Asia and Pacific Market Volume (Unit Pack) Forecast by Specialty Type, 2019 to 2034

Table 47: South Asia and Pacific Market Value (US$ Million) Forecast by Distribution Channel, 2019 to 2034

Table 48: South Asia and Pacific Market Volume (Unit Pack) Forecast by Distribution Channel, 2019 to 2034

Table 49: East Asia Market Value (US$ Million) Forecast by Country, 2019 to 2034

Table 50: East Asia Market Volume (Unit Pack) Forecast by Country, 2019 to 2034

Table 51: East Asia Market Value (US$ Million) Forecast by Product Type, 2019 to 2034

Table 52: East Asia Market Volume (Unit Pack) Forecast by Product Type, 2019 to 2034

Table 53: East Asia Market Value (US$ Million) Forecast by Specialty Type, 2019 to 2034

Table 54: East Asia Market Volume (Unit Pack) Forecast by Specialty Type, 2019 to 2034

Table 55: East Asia Market Value (US$ Million) Forecast by Distribution Channel, 2019 to 2034

Table 56: East Asia Market Volume (Unit Pack) Forecast by Distribution Channel, 2019 to 2034

Table 57: Middle East and Africa Market Value (US$ Million) Forecast by Country, 2019 to 2034

Table 58: Middle East and Africa Market Volume (Unit Pack) Forecast by Country, 2019 to 2034

Table 59: Middle East and Africa Market Value (US$ Million) Forecast by Product Type, 2019 to 2034

Table 60: Middle East and Africa Market Volume (Unit Pack) Forecast by Product Type, 2019 to 2034

Table 61: Middle East and Africa Market Value (US$ Million) Forecast by Specialty Type, 2019 to 2034

Table 62: Middle East and Africa Market Volume (Unit Pack) Forecast by Specialty Type, 2019 to 2034

Table 63: Middle East and Africa Market Value (US$ Million) Forecast by Distribution Channel, 2019 to 2034

Table 64: Middle East and Africa Market Volume (Unit Pack) Forecast by Distribution Channel, 2019 to 2034

List of Charts

Figure 1: Global Market Value (US$ Million) by Product Type, 2024 to 2034

Figure 2: Global Market Value (US$ Million) by Specialty Type, 2024 to 2034

Figure 3: Global Market Value (US$ Million) by Distribution Channel, 2024 to 2034

Figure 4: Global Market Value (US$ Million) by Region, 2024 to 2034

Figure 5: Global Market Value (US$ Million) Analysis by Region, 2019 to 2034

Figure 6: Global Market Volume (Unit Pack) Analysis by Region, 2019 to 2034

Figure 7: Global Market Value Share (%) and BPS Analysis by Region, 2024 to 2034

Figure 8: Global Market Y-o-Y Growth (%) Projections by Region, 2024 to 2034

Figure 9: Global Market Value (US$ Million) Analysis by Product Type, 2019 to 2034

Figure 10: Global Market Volume (Unit Pack) Analysis by Product Type, 2019 to 2034

Figure 11: Global Market Value Share (%) and BPS Analysis by Product Type, 2024 to 2034

Figure 12: Global Market Y-o-Y Growth (%) Projections by Product Type, 2024 to 2034

Figure 13: Global Market Value (US$ Million) Analysis by Specialty Type, 2019 to 2034

Figure 14: Global Market Volume (Unit Pack) Analysis by Specialty Type, 2019 to 2034

Figure 15: Global Market Value Share (%) and BPS Analysis by Specialty Type, 2024 to 2034

Figure 16: Global Market Y-o-Y Growth (%) Projections by Specialty Type, 2024 to 2034

Figure 17: Global Market Value (US$ Million) Analysis by Distribution Channel, 2019 to 2034

Figure 18: Global Market Volume (Unit Pack) Analysis by Distribution Channel, 2019 to 2034

Figure 19: Global Market Value Share (%) and BPS Analysis by Distribution Channel, 2024 to 2034

Figure 20: Global Market Y-o-Y Growth (%) Projections by Distribution Channel, 2024 to 2034

Figure 21: Global Market Attractiveness by Product Type, 2024 to 2034

Figure 22: Global Market Attractiveness by Specialty Type, 2024 to 2034

Figure 23: Global Market Attractiveness by Distribution Channel, 2024 to 2034

Figure 24: Global Market Attractiveness by Region, 2024 to 2034

Figure 25: North America Market Value (US$ Million) by Product Type, 2024 to 2034

Figure 26: North America Market Value (US$ Million) by Specialty Type, 2024 to 2034

Figure 27: North America Market Value (US$ Million) by Distribution Channel, 2024 to 2034

Figure 28: North America Market Value (US$ Million) by Country, 2024 to 2034

Figure 29: North America Market Value (US$ Million) Analysis by Country, 2019 to 2034

Figure 30: North America Market Volume (Unit Pack) Analysis by Country, 2019 to 2034

Figure 31: North America Market Value Share (%) and BPS Analysis by Country, 2024 to 2034

Figure 32: North America Market Y-o-Y Growth (%) Projections by Country, 2024 to 2034

Figure 33: North America Market Value (US$ Million) Analysis by Product Type, 2019 to 2034

Figure 34: North America Market Volume (Unit Pack) Analysis by Product Type, 2019 to 2034

Figure 35: North America Market Value Share (%) and BPS Analysis by Product Type, 2024 to 2034

Figure 36: North America Market Y-o-Y Growth (%) Projections by Product Type, 2024 to 2034

Figure 37: North America Market Value (US$ Million) Analysis by Specialty Type, 2019 to 2034

Figure 38: North America Market Volume (Unit Pack) Analysis by Specialty Type, 2019 to 2034

Figure 39: North America Market Value Share (%) and BPS Analysis by Specialty Type, 2024 to 2034

Figure 40: North America Market Y-o-Y Growth (%) Projections by Specialty Type, 2024 to 2034

Figure 41: North America Market Value (US$ Million) Analysis by Distribution Channel, 2019 to 2034

Figure 42: North America Market Volume (Unit Pack) Analysis by Distribution Channel, 2019 to 2034

Figure 43: North America Market Value Share (%) and BPS Analysis by Distribution Channel, 2024 to 2034

Figure 44: North America Market Y-o-Y Growth (%) Projections by Distribution Channel, 2024 to 2034

Figure 45: North America Market Attractiveness by Product Type, 2024 to 2034

Figure 46: North America Market Attractiveness by Specialty Type, 2024 to 2034

Figure 47: North America Market Attractiveness by Distribution Channel, 2024 to 2034

Figure 48: North America Market Attractiveness by Country, 2024 to 2034

Figure 49: Latin America Market Value (US$ Million) by Product Type, 2024 to 2034

Figure 50: Latin America Market Value (US$ Million) by Specialty Type, 2024 to 2034

Figure 51: Latin America Market Value (US$ Million) by Distribution Channel, 2024 to 2034

Figure 52: Latin America Market Value (US$ Million) by Country, 2024 to 2034

Figure 53: Latin America Market Value (US$ Million) Analysis by Country, 2019 to 2034

Figure 54: Latin America Market Volume (Unit Pack) Analysis by Country, 2019 to 2034

Figure 55: Latin America Market Value Share (%) and BPS Analysis by Country, 2024 to 2034

Figure 56: Latin America Market Y-o-Y Growth (%) Projections by Country, 2024 to 2034

Figure 57: Latin America Market Value (US$ Million) Analysis by Product Type, 2019 to 2034

Figure 58: Latin America Market Volume (Unit Pack) Analysis by Product Type, 2019 to 2034

Figure 59: Latin America Market Value Share (%) and BPS Analysis by Product Type, 2024 to 2034

Figure 60: Latin America Market Y-o-Y Growth (%) Projections by Product Type, 2024 to 2034

Figure 61: Latin America Market Value (US$ Million) Analysis by Specialty Type, 2019 to 2034

Figure 62: Latin America Market Volume (Unit Pack) Analysis by Specialty Type, 2019 to 2034

Figure 63: Latin America Market Value Share (%) and BPS Analysis by Specialty Type, 2024 to 2034

Figure 64: Latin America Market Y-o-Y Growth (%) Projections by Specialty Type, 2024 to 2034

Figure 65: Latin America Market Value (US$ Million) Analysis by Distribution Channel, 2019 to 2034

Figure 66: Latin America Market Volume (Unit Pack) Analysis by Distribution Channel, 2019 to 2034

Figure 67: Latin America Market Value Share (%) and BPS Analysis by Distribution Channel, 2024 to 2034

Figure 68: Latin America Market Y-o-Y Growth (%) Projections by Distribution Channel, 2024 to 2034

Figure 69: Latin America Market Attractiveness by Product Type, 2024 to 2034

Figure 70: Latin America Market Attractiveness by Specialty Type, 2024 to 2034

Figure 71: Latin America Market Attractiveness by Distribution Channel, 2024 to 2034

Figure 72: Latin America Market Attractiveness by Country, 2024 to 2034

Figure 73: Western Europe Market Value (US$ Million) by Product Type, 2024 to 2034

Figure 74: Western Europe Market Value (US$ Million) by Specialty Type, 2024 to 2034

Figure 75: Western Europe Market Value (US$ Million) by Distribution Channel, 2024 to 2034

Figure 76: Western Europe Market Value (US$ Million) by Country, 2024 to 2034

Figure 77: Western Europe Market Value (US$ Million) Analysis by Country, 2019 to 2034

Figure 78: Western Europe Market Volume (Unit Pack) Analysis by Country, 2019 to 2034

Figure 79: Western Europe Market Value Share (%) and BPS Analysis by Country, 2024 to 2034

Figure 80: Western Europe Market Y-o-Y Growth (%) Projections by Country, 2024 to 2034

Figure 81: Western Europe Market Value (US$ Million) Analysis by Product Type, 2019 to 2034

Figure 82: Western Europe Market Volume (Unit Pack) Analysis by Product Type, 2019 to 2034

Figure 83: Western Europe Market Value Share (%) and BPS Analysis by Product Type, 2024 to 2034

Figure 84: Western Europe Market Y-o-Y Growth (%) Projections by Product Type, 2024 to 2034

Figure 85: Western Europe Market Value (US$ Million) Analysis by Specialty Type, 2019 to 2034

Figure 86: Western Europe Market Volume (Unit Pack) Analysis by Specialty Type, 2019 to 2034

Figure 87: Western Europe Market Value Share (%) and BPS Analysis by Specialty Type, 2024 to 2034

Figure 88: Western Europe Market Y-o-Y Growth (%) Projections by Specialty Type, 2024 to 2034

Figure 89: Western Europe Market Value (US$ Million) Analysis by Distribution Channel, 2019 to 2034

Figure 90: Western Europe Market Volume (Unit Pack) Analysis by Distribution Channel, 2019 to 2034

Figure 91: Western Europe Market Value Share (%) and BPS Analysis by Distribution Channel, 2024 to 2034

Figure 92: Western Europe Market Y-o-Y Growth (%) Projections by Distribution Channel, 2024 to 2034

Figure 93: Western Europe Market Attractiveness by Product Type, 2024 to 2034

Figure 94: Western Europe Market Attractiveness by Specialty Type, 2024 to 2034

Figure 95: Western Europe Market Attractiveness by Distribution Channel, 2024 to 2034

Figure 96: Western Europe Market Attractiveness by Country, 2024 to 2034

Figure 97: Eastern Europe Market Value (US$ Million) by Product Type, 2024 to 2034

Figure 98: Eastern Europe Market Value (US$ Million) by Specialty Type, 2024 to 2034

Figure 99: Eastern Europe Market Value (US$ Million) by Distribution Channel, 2024 to 2034

Figure 100: Eastern Europe Market Value (US$ Million) by Country, 2024 to 2034

Figure 101: Eastern Europe Market Value (US$ Million) Analysis by Country, 2019 to 2034

Figure 102: Eastern Europe Market Volume (Unit Pack) Analysis by Country, 2019 to 2034

Figure 103: Eastern Europe Market Value Share (%) and BPS Analysis by Country, 2024 to 2034

Figure 104: Eastern Europe Market Y-o-Y Growth (%) Projections by Country, 2024 to 2034

Figure 105: Eastern Europe Market Value (US$ Million) Analysis by Product Type, 2019 to 2034

Figure 106: Eastern Europe Market Volume (Unit Pack) Analysis by Product Type, 2019 to 2034

Figure 107: Eastern Europe Market Value Share (%) and BPS Analysis by Product Type, 2024 to 2034

Figure 108: Eastern Europe Market Y-o-Y Growth (%) Projections by Product Type, 2024 to 2034

Figure 109: Eastern Europe Market Value (US$ Million) Analysis by Specialty Type, 2019 to 2034

Figure 110: Eastern Europe Market Volume (Unit Pack) Analysis by Specialty Type, 2019 to 2034

Figure 111: Eastern Europe Market Value Share (%) and BPS Analysis by Specialty Type, 2024 to 2034

Figure 112: Eastern Europe Market Y-o-Y Growth (%) Projections by Specialty Type, 2024 to 2034

Figure 113: Eastern Europe Market Value (US$ Million) Analysis by Distribution Channel, 2019 to 2034

Figure 114: Eastern Europe Market Volume (Unit Pack) Analysis by Distribution Channel, 2019 to 2034

Figure 115: Eastern Europe Market Value Share (%) and BPS Analysis by Distribution Channel, 2024 to 2034

Figure 116: Eastern Europe Market Y-o-Y Growth (%) Projections by Distribution Channel, 2024 to 2034

Figure 117: Eastern Europe Market Attractiveness by Product Type, 2024 to 2034

Figure 118: Eastern Europe Market Attractiveness by Specialty Type, 2024 to 2034

Figure 119: Eastern Europe Market Attractiveness by Distribution Channel, 2024 to 2034

Figure 120: Eastern Europe Market Attractiveness by Country, 2024 to 2034

Figure 121: South Asia and Pacific Market Value (US$ Million) by Product Type, 2024 to 2034

Figure 122: South Asia and Pacific Market Value (US$ Million) by Specialty Type, 2024 to 2034

Figure 123: South Asia and Pacific Market Value (US$ Million) by Distribution Channel, 2024 to 2034

Figure 124: South Asia and Pacific Market Value (US$ Million) by Country, 2024 to 2034

Figure 125: South Asia and Pacific Market Value (US$ Million) Analysis by Country, 2019 to 2034

Figure 126: South Asia and Pacific Market Volume (Unit Pack) Analysis by Country, 2019 to 2034

Figure 127: South Asia and Pacific Market Value Share (%) and BPS Analysis by Country, 2024 to 2034

Figure 128: South Asia and Pacific Market Y-o-Y Growth (%) Projections by Country, 2024 to 2034

Figure 129: South Asia and Pacific Market Value (US$ Million) Analysis by Product Type, 2019 to 2034

Figure 130: South Asia and Pacific Market Volume (Unit Pack) Analysis by Product Type, 2019 to 2034

Figure 131: South Asia and Pacific Market Value Share (%) and BPS Analysis by Product Type, 2024 to 2034

Figure 132: South Asia and Pacific Market Y-o-Y Growth (%) Projections by Product Type, 2024 to 2034

Figure 133: South Asia and Pacific Market Value (US$ Million) Analysis by Specialty Type, 2019 to 2034

Figure 134: South Asia and Pacific Market Volume (Unit Pack) Analysis by Specialty Type, 2019 to 2034

Figure 135: South Asia and Pacific Market Value Share (%) and BPS Analysis by Specialty Type, 2024 to 2034

Figure 136: South Asia and Pacific Market Y-o-Y Growth (%) Projections by Specialty Type, 2024 to 2034

Figure 137: South Asia and Pacific Market Value (US$ Million) Analysis by Distribution Channel, 2019 to 2034

Figure 138: South Asia and Pacific Market Volume (Unit Pack) Analysis by Distribution Channel, 2019 to 2034

Figure 139: South Asia and Pacific Market Value Share (%) and BPS Analysis by Distribution Channel, 2024 to 2034

Figure 140: South Asia and Pacific Market Y-o-Y Growth (%) Projections by Distribution Channel, 2024 to 2034

Figure 141: South Asia and Pacific Market Attractiveness by Product Type, 2024 to 2034

Figure 142: South Asia and Pacific Market Attractiveness by Specialty Type, 2024 to 2034

Figure 143: South Asia and Pacific Market Attractiveness by Distribution Channel, 2024 to 2034

Figure 144: South Asia and Pacific Market Attractiveness by Country, 2024 to 2034

Figure 145: East Asia Market Value (US$ Million) by Product Type, 2024 to 2034

Figure 146: East Asia Market Value (US$ Million) by Specialty Type, 2024 to 2034

Figure 147: East Asia Market Value (US$ Million) by Distribution Channel, 2024 to 2034

Figure 148: East Asia Market Value (US$ Million) by Country, 2024 to 2034

Figure 149: East Asia Market Value (US$ Million) Analysis by Country, 2019 to 2034

Figure 150: East Asia Market Volume (Unit Pack) Analysis by Country, 2019 to 2034

Figure 151: East Asia Market Value Share (%) and BPS Analysis by Country, 2024 to 2034

Figure 152: East Asia Market Y-o-Y Growth (%) Projections by Country, 2024 to 2034

Figure 153: East Asia Market Value (US$ Million) Analysis by Product Type, 2019 to 2034

Figure 154: East Asia Market Volume (Unit Pack) Analysis by Product Type, 2019 to 2034

Figure 155: East Asia Market Value Share (%) and BPS Analysis by Product Type, 2024 to 2034

Figure 156: East Asia Market Y-o-Y Growth (%) Projections by Product Type, 2024 to 2034

Figure 157: East Asia Market Value (US$ Million) Analysis by Specialty Type, 2019 to 2034

Figure 158: East Asia Market Volume (Unit Pack) Analysis by Specialty Type, 2019 to 2034

Figure 159: East Asia Market Value Share (%) and BPS Analysis by Specialty Type, 2024 to 2034

Figure 160: East Asia Market Y-o-Y Growth (%) Projections by Specialty Type, 2024 to 2034

Figure 161: East Asia Market Value (US$ Million) Analysis by Distribution Channel, 2019 to 2034

Figure 162: East Asia Market Volume (Unit Pack) Analysis by Distribution Channel, 2019 to 2034

Figure 163: East Asia Market Value Share (%) and BPS Analysis by Distribution Channel, 2024 to 2034

Figure 164: East Asia Market Y-o-Y Growth (%) Projections by Distribution Channel, 2024 to 2034

Figure 165: East Asia Market Attractiveness by Product Type, 2024 to 2034

Figure 166: East Asia Market Attractiveness by Specialty Type, 2024 to 2034

Figure 167: East Asia Market Attractiveness by Distribution Channel, 2024 to 2034

Figure 168: East Asia Market Attractiveness by Country, 2024 to 2034

Figure 169: Middle East and Africa Market Value (US$ Million) by Product Type, 2024 to 2034

Figure 170: Middle East and Africa Market Value (US$ Million) by Specialty Type, 2024 to 2034

Figure 171: Middle East and Africa Market Value (US$ Million) by Distribution Channel, 2024 to 2034

Figure 172: Middle East and Africa Market Value (US$ Million) by Country, 2024 to 2034

Figure 173: Middle East and Africa Market Value (US$ Million) Analysis by Country, 2019 to 2034

Figure 174: Middle East and Africa Market Volume (Unit Pack) Analysis by Country, 2019 to 2034

Figure 175: Middle East and Africa Market Value Share (%) and BPS Analysis by Country, 2024 to 2034

Figure 176: Middle East and Africa Market Y-o-Y Growth (%) Projections by Country, 2024 to 2034

Figure 177: Middle East and Africa Market Value (US$ Million) Analysis by Product Type, 2019 to 2034

Figure 178: Middle East and Africa Market Volume (Unit Pack) Analysis by Product Type, 2019 to 2034

Figure 179: Middle East and Africa Market Value Share (%) and BPS Analysis by Product Type, 2024 to 2034

Figure 180: Middle East and Africa Market Y-o-Y Growth (%) Projections by Product Type, 2024 to 2034

Figure 181: Middle East and Africa Market Value (US$ Million) Analysis by Specialty Type, 2019 to 2034

Figure 182: Middle East and Africa Market Volume (Unit Pack) Analysis by Specialty Type, 2019 to 2034

Figure 183: Middle East and Africa Market Value Share (%) and BPS Analysis by Specialty Type, 2024 to 2034

Figure 184: Middle East and Africa Market Y-o-Y Growth (%) Projections by Specialty Type, 2024 to 2034

Figure 185: Middle East and Africa Market Value (US$ Million) Analysis by Distribution Channel, 2019 to 2034

Figure 186: Middle East and Africa Market Volume (Unit Pack) Analysis by Distribution Channel, 2019 to 2034

Figure 187: Middle East and Africa Market Value Share (%) and BPS Analysis by Distribution Channel, 2024 to 2034

Figure 188: Middle East and Africa Market Y-o-Y Growth (%) Projections by Distribution Channel, 2024 to 2034

Figure 189: Middle East and Africa Market Attractiveness by Product Type, 2024 to 2034

Figure 190: Middle East and Africa Market Attractiveness by Specialty Type, 2024 to 2034

Figure 191: Middle East and Africa Market Attractiveness by Distribution Channel, 2024 to 2034

Figure 192: Middle East and Africa Market Attractiveness by Country, 2024 to 2034

Recommendations

Food and Beverage

Bakery Ingredient Market

Published : October 2023

Food and Beverage

Bakery Enzymes Market

Published : July 2023

Food and Beverage

Bakery Mixes Market

Published : July 2023

Food and Beverage

Bakery Improvers Market

Published : December 2022

Explore Food and Beverage Insights

View Reports