Bakery Mixes Market Size, Share, and Forecast Outlook 2025 to 2035 

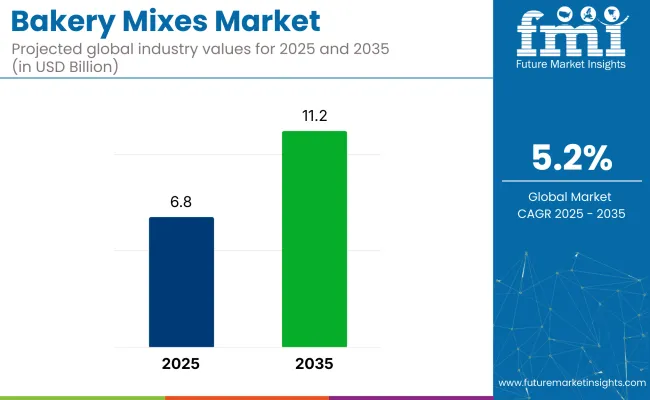
The global bakery mixes market is expected to reach a market valuation of USD 6.8 billion in 2025 and is projected to expand to USD 11.2 billion by 2035. This growth reflects a consistent CAGR of 5.2% during the forecast period. The industry has shown resilience and predictable expansion following the acceleration in demand for convenient food preparations.
Quick Stats of Bakery Mixes Market

  • Market Value (2025): USD 6.8 billion
  • Forecast Value (2035): USD 11.2 billion
  • Forecast CAGR (2025 to 2035): 5.2%&
  • Leading Segment in 2025: Natural source (62.0% share)
  • Key Growth Region: Asia Pacific (India is the fastest growing market with 8.5% CAGR
  • Key Players: Cargill Inc., Archer Daniels Midland Company, Bakels Worldwide, Swiss Bake Ingredients Pvt. Ltd., Allied Mills Pty Ltd., Watson Inc., Mahindra Group, Puratos Ltd., Lesaffre SA, Echema Technologies LLC, Pillsbury Company LLC, King Arthur Flour Company Inc., Pamela’s Products Inc., and Enhance Proteins Ltd.

Bakery Mixes Market

Metrics Values
Industry Size in 2025 USD 6.8 billion
Value in 2035 USD 11.2 billion
Value-based CAGR from 2025 to 2035 5.2%

The industry continues to benefit from the structural integration of baking solutions into foodservice chains, industrial bakeries, and even domestic kitchens across mature and emerging markets. Bakery mixes, which include a blend of flour, starch, leavening agents, emulsifiers, and other baking aids, have carved out a reliable niche in food processing.

The market holds approximately 20-25% share within the bakery ingredients market. Its share in the broader food ingredients market is about 1-2%. In the processed food market, bakery mixes account for less than 0.1%. Within the dry food premixes segment, they represent nearly 30-35% of the market. In the convenience foods market, bakery mixes contribute around 4-6%, reflecting their growing role in ready-to-use baking solutions for both domestic and industrial applications.

The market has been driven by rising consumer reliance on time-saving baking alternatives, particularly across North America, Europe, and select parts of Asia. In both commercial and institutional baking, bakery mixes help standardize output, eliminate inconsistency, and support volume production. These blends reduce formulation complexity, offering uniformity across product batches, an increasingly necessary factor for franchise operators, QSR chains, and regional bakeries seeking predictable outputs at scale.

Demand has also seen tailwinds from price-conscious baking solutions. In cost-sensitive regions, bakery mixes have become popular due to reduced wastage and simplified logistics. These mixes also allow product innovation at the R&D level, particularly as manufacturers respond to dietary shifts such as low-gluten, high-protein, or plant-based formulations.

Analyzing of Bakery Mixes Market by Top Investment Segments

The bakery mixes market is segmented by product type into flours, sweeteners, edible oils, cocoa and chocolate, and others. By application, it includes bread, cakes and pies, cookies and biscuits, pizza dough, and others. By source, the segmentation is into natural, organic, and artificial. By region, the market covers North America, Europe, Asia Pacific, Latin America, and Middle East and Africa.
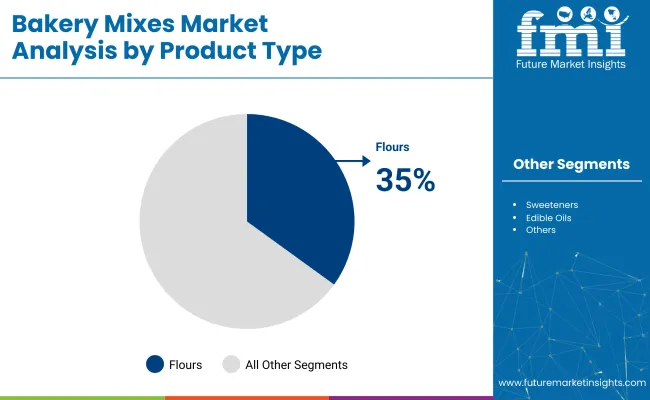
By Product Type, Flours Segment Accounts for Over 35% Share

Flours are expected to account for the largest share of the market by product type in 2025, with an estimated contribution of nearly 35% to revenue. This dominance can be attributed to the foundational role flours play in virtually all bakery mix formulations, whether for bread, cakes, or cookies.
  • Commercial bakeries and foodservice establishments continue to rely heavily on flour-based mixes for consistent texture and structure across product lines.
  • The widespread adoption of wheat flour, spelt flour, and specialty blends such as whole grain and high-protein variants further supports segment leadership.
  • Flours also serve as the most versatile input, offering compatibility with both traditional and gluten-free baking applications. As bakery manufacturers look to reduce ingredient costs while maintaining quality standards, flour remains the central component in bulk pre-mix formulations distributed worldwide.

Bakery Mixes Market Analysis By Product Type

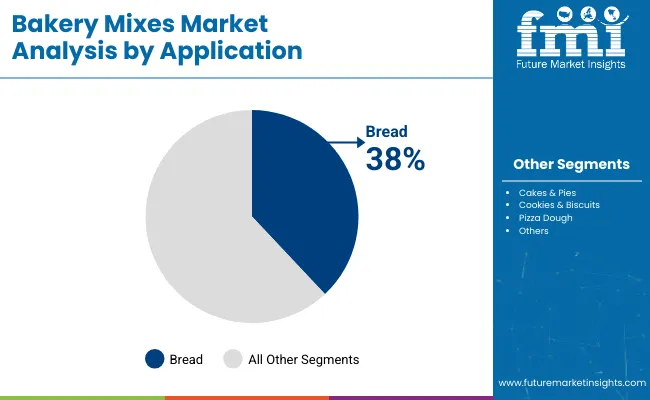
Growing Product Demand in Bread Application with 38.0% Share

Bread is projected to hold the largest share in the market by application, accounting for 38.0% market share in 2025. This lead is supported by the entrenched global demand for bread as a daily staple across both developed and emerging economies.
  • Ready-to-mix bread formulations have been adopted widely by commercial bakeries, institutional kitchens, and in-store bakeries to ensure volume efficiency and uniform quality.
  • Yeast-based and chemical leavening mixes tailored for sandwich loaves, baguettes, and specialty breads have gained traction, especially in high-consumption markets such as India, Germany, and the United States.
  • The preference for long shelf-life dough preparations and reduced preparation times has encouraged processors to scale production using standardized bread mixes. This segment is not expected to cede its lead unless protein-fortified or low-carb mixes disrupt traditional consumption patterns at scale.

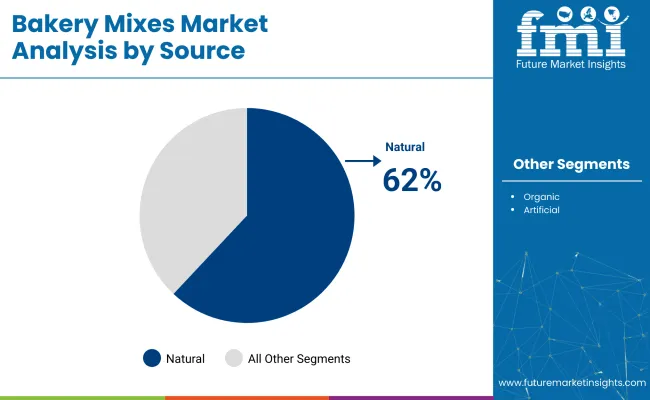
Natural Sources Drive Industry Demand with 62% Share

Natural sources are projected to dominate the market by source, contributing nearly 62% share in 2025. The dominance of natural-based mixes stems from their wide acceptability among commercial bakers, institutional food producers, and retail consumers seeking reliable formulations without synthetic additives.

  • Ingredient processors have continued to rely on naturally derived flours, oils, and sweeteners for their compatibility with bulk manufacturing requirements and regulatory acceptance across major markets.
  • Unlike organic variants, which often involve higher procurement and certification costs, natural-source inputs offer a balance between perceived quality and affordability.
  • Artificial-source mixes, while cost-effective, face tightening scrutiny due to labeling transparency and shifting customer preferences. Given current adoption rates, it appears unlikely that natural-source mixes will be displaced over the next few years.

Bakery Mixes Market Analysis By Source

Top Bakery Mixes Market Dynamics

Operational efficiency in commercial baking is being strengthened by wider reliance on bakery premixes, viewed as essential for scalable, consistent output. Clean-label momentum is being reinforced through simplified, plant-based formulations, positioning transparent ingredient mixes as the likely benchmark for future differentiation.

Rising Integration of Bakery Premixes in Commercial Production

A shift toward operational efficiency has accelerated the adoption of the product across commercial baking operations. These premixed formulations are being utilized to streamline batch consistency, reduce production time, and cut labor dependency critical for high-volume producers managing SKUs across bread, cake, and cookie categories. Bakery premixes enable manufacturers to reduce formulation errors and respond faster to fluctuating demand without sacrificing quality. Ingredient suppliers have capitalized on this trend by offering customized blends that cater to regional palates and baking standards.

  • Commercial foodservice chains have integrated the product to simplify training and standardize product output.
  • Regional processors are using premixes to diversify offerings without altering core equipment or processes.
  • Customized functional blends are being tailored to accommodate local ingredient restrictions and religious dietary codes.

Ingredient Simplification and Clean Label Prioritization

Formulations using the product are being reshaped to meet evolving clean-label and ingredient transparency expectations. Artificial additives and preservatives are being phased out in favor of natural alternatives, with increasing pressure on manufacturers to publish full disclosures on mix contents.

In response, food ingredient companies have been introducing simplified bakery bases derived from recognizable components such as stone-ground flours, natural sweeteners, and plant-based emulsifiers. This trend has also been observed in private-label brands targeting health-conscious consumers across North America and Europe.
  • Mixes formulated with fewer than six ingredients are being prioritized for their clean-label appeal.
  • Plant-derived leavening agents and emulsifiers are replacing synthetic counterparts in reformulated mixes.
  • Private-label offerings from supermarket chains are leveraging ingredient transparency as a competitive tool.

Analysis of Top Countries Manufacturing, Exporting and Supplying Bakery Mixes Globally

Country Wise Analysis Of Bakery Mixes Market

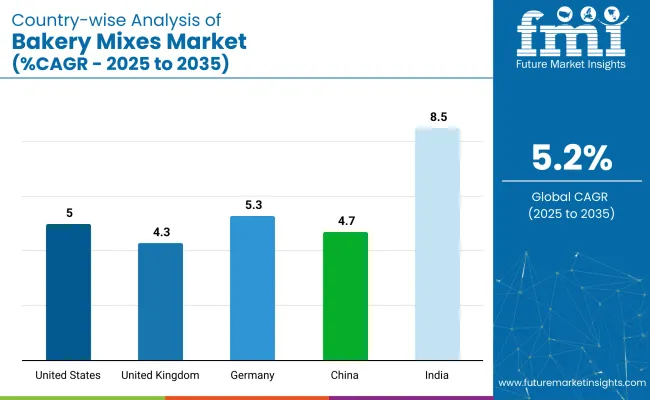
Countries CAGR (2025 to 2035)
United States 5%
United Kingdom 4.3%
Germany 5.3%
China 4.7%
India 8.5%

Sales of bakery mixes worldwide are projected to grow at a 4.0% CAGR from 2025 to 2035. All five markets highlighted from a 40-country survey are forecast to surpass that pace, led by India at 8.5%. Germany follows at 5.3%, the United States at 5.0%, China at 4.7%, and the United Kingdom at 4.3%.

These rates translate into growth premiums ranging from +7% (United Kingdom) to +113% (India) versus the global baseline. Divergence reflects local catalysts: tier-2 urban expansion and private-label mixes in India, clean-label demand and regional flavour profiles in Germany, specialty keto and gluten-free launches in the United States, institutional procurement and Western-style bakery uptake in China, and at-home indulgent baking trends in the United Kingdom.

  • India outperforms global CAGR by +4.5 percentage points.
  • Germany exceeds baseline by +1.3 points.
  • United States posts a +1.0 point premium.
  • China leads baseline by +0.7 points.
  • United Kingdom maintains a +0.3 point advantage.

USA Bakery Mixes Market Analysis and Growth Outlook

The USA bakery mixes market is estimated to grow at 5.0% CAGR during the forecast period. Expansion is being underpinned by steady demand for time-saving dough bases in retail and foodservice, where consistent output and labor efficiency remain core purchasing criteria. Bread and cake mixes have been adopted by quick-service restaurant commissaries to streamline SKU management, while gluten-free and high-protein variants are being favored by health-aware consumers who require convenient baking aids.

Ingredient suppliers have intensified product localization, ensuring formulations align with American labeling codes and shelf-life expectations. E-commerce grocery platforms have been leveraged by private-label brands, boosting mix visibility among home bakers seeking predictable results without measuring errors.

  • Retail bakeries have been observed using QR-code recipes on mix packaging to shorten staff training.
  • Shelf-stable fortification premixes are being added to school-meal bread programs in several states.
  • Contract manufacturers have expanded Midwest facilities to satisfy growing demand from private-label retailers.

Analysis of Bakery Mixes Market in India

The India bakery mixes market is estimated to grow at 8.5% CAGR from 2025 to 2035. Growth well above the 5.2% global average is being enabled by rising middle-class adoption of Western-style bakery items, combined with an entrenched affinity for value-priced convenience foods. Domestic mills have diverted wheat output toward packaged premixes, encouraged by reduced post-harvest losses and consistent demand from urban hypermarkets.

Mixes formulated for egg-free and dairy-free recipes have found expanding acceptance, meeting vegetarian requirements without compromising texture. Government support for smaller food-processing units has encouraged co-packing arrangements, bringing cost-effective bread and cake bases to tier-two cities. Online grocery platforms have widened distribution reach, while celebrity baking shows have popularized home baking, lifting retail volume.

  • Low-temperature resistant dough conditioners have been specified for long-haul transport within India’s warm climate.
  • Cloud-kitchen operators have switched from scratch mixing to premixes to accelerate order throughput.
  • Small-scale bakeries have obtained micro-loans to install planetary mixers compatible with commercial premix bags.

Demand Forecast for Bakery Mixes Market in China

The China bakery mixes market is estimated to grow at 4.7% CAGR between 2025 and 2035. Market momentum is being maintained by premium café chains that prefer standardized sponge and brioche bases to ensure uniform taste across rapidly multiplying outlets. Urban consumers value single-serve packaged buns and breakfast rolls prepared from ready-to-bake formulations, perceived as hygienic and portion-controlled.

Domestic ingredient firms have partnered with global players to access high-protein wheat isolates, improving dough elasticity, while rice-based mixes have been promoted for gluten-sensitive patrons. Digital retail festivals have been leveraged to launch seasonal cake-mix bundles, triggering demand spikes that local contract packers can meet through flexible filling lines.

  • Provincial school-meal programs have trialed fortified muffin mixes to raise dietary protein intake.
  • Café chains have introduced steam-baked bun mixes calibrated for combi-ovens common in China.
  • Cross-border-e-commerce platforms have listed imported brownie mixes, widening consumer choice beyond domestic brands.

Bakery Mixes Market Growth Outlook in Germany

The Germany bakery mixes market is estimated to grow at 5.3% CAGR during the forecast period. Growth roughly in line with the global average is being driven by a well-established artisanal culture that is increasingly relying on specialty rye and spelt premixes to balance tradition and efficiency. Home bakers, encouraged by cooking-show influence, are purchasing small-batch bread mixes featuring heritage grains, whereas industrial bakeries have installed automated dispensers calibrated for high-hydration dough bases.

The clean-label movement has led to greater transparency, prompting formulators to exclude artificial emulsifiers and opt for enzyme systems compliant with EU additive codes. Demand for convenience has risen as dual-income households turn to ready-proof bakery kits available in discounters.

  • Millers have invested in on-site heat-treatment lines to extend the microbiological stability of flour premixes.
  • Vegan stollen-mix launches have catered to younger demographics seeking plant-based festive treats.
  • Craft-bakery associations have endorsed regional-grain mixes to support local agriculture and maintain product authenticity.

Future Outlook for Bakery Mixes Market in the United Kingdom

The United Kingdom bakery mixes market is estimated to grow at 4.3% CAGR during the forecast period. Growth marginally below the global mean is being sustained by an enduring home-baking culture inspired by televised competitions and social-media recipe sharing. Retailers have expanded private-label cake and scone mixes, frequently highlighting reduced-sugar formulations aligned with national health guidelines.

Gluten-free blends formulated with oat and buckwheat flours are being embraced by consumers seeking digestive comfort without flavor compromise. Convenience stores have broadened shelf space for microwave-ready muffin pots, targeting quick indulgence occasions. Manufacturers have responded by developing water-only mixes that eliminate the need for fresh eggs, prolonging pantry life and reducing preparation barriers.
  • Heritage-grain cake mixes featuring spelt and einkorn have been launched to attract premium-segment shoppers.
  • Plant-based fat replacers have been incorporated into brownie mixes to meet vegan certification standards.
  • Discount grocers have trialed refill-station dispensers for bulk bread premixes, aligning with packaging-waste reduction goals.

Leading Bakery Mixes Suppliers

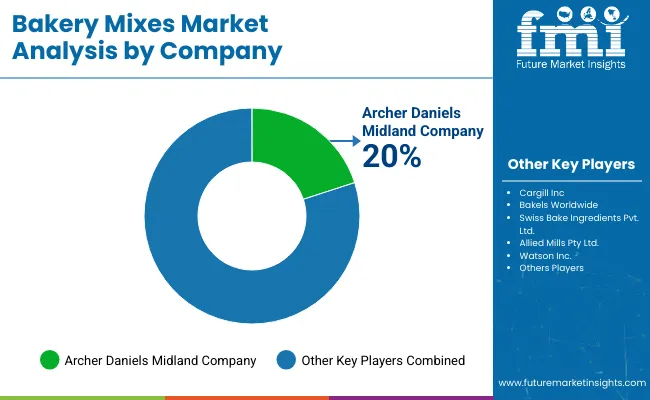
The market is shaped by a mix of established industry leaders and regional innovators specializing in premix customization, flour fortification, and industrial baking applications. Key companies such as Cargill Inc., Archer Daniels Midland Company, and Bakels Worldwide continue to lead with expansive portfolios covering bread, cake, and specialty mix formulations. Swiss Bake Ingredients Pvt. Ltd. and Allied Mills Pty Ltd. support mid-scale and regional bakery operations with tailored dough bases and ready-mix solutions.

Watson Inc. and Mahindra Group have strengthened their foothold through investments in functional blends and ingredient technologies, while Puratos Ltd. and Lesaffre SA are known for their proprietary yeast and enzyme systems integrated into bakery premixes. Pillsbury Company LLC and King Arthur Flour Company Inc. dominate in the North American home baking segment, offering retail-ready baking kits. Pamela’s Products Inc. and Enhance Proteins Ltd. are gaining traction in gluten-free and protein-enhanced bakery mix categories respectively, targeting evolving consumer preferences.

Recent Bakery Mixes Industry News

In March 2025, Cargill inaugurated a new corn milling plant in Gwalior, India, with an initial output of 500 tons per day, expandable to 1,000 tons per day, to serve the food and bakery sectors.

Leading Players

  • Cargill Inc.
  • Archer Daniels Midland Company
  • Bakels Worldwide
  • Swiss Bake Ingredients Pvt. Ltd.
  • Allied Mills Pty Ltd.
  • Watson Inc.
  • Mahindra Group
  • Puratos Ltd.
  • Lesaffre SA
  • Echema Technologies, LLC
  • Pillsbury Company, LLC
  • King Arthur Flour Company, Inc.
  • Pamela’s Products Inc.
  • Enhance Proteins Ltd.

Report Coverage and Scope Summary

Report Attributes Details
Market Size (2025) USD 6.8 billion
Projected Market Size (2035) USD 11.2 billion
CAGR (2025 to 2035) 5.2%
Base Year for Estimation 2024
Historical Period 2020 to 2024
Projections Period 2025 to 2035
Quantitative Units USD billion for value and volume in kilo tons
Product Type Analyzed (Segment 1) Flours, Sweeteners, Edible Oils, Cocoa a nd Chocolate, and Others
Application Analyzed (Segment 2) Bread, Cakes & Pies, Cookies & Biscuits, Pizza Dough, and Others.
Source Analyzed (Segment 3) Natural, Organic, and Artificial.
Regions Covered North America, Europe, Asia Pacific, Middle East & Africa, Latin America
Countries Covered United States, Canada, Germany, United Kingdom, France, Italy, Spain, China, Japan, South Korea, India, Australia, Brazil, Mexico, Argentina, Saudi Arabia, UAE, South Africa
Key Players Cargill Inc., Archer Daniels Midland Company, Bakels Worldwide, Swiss Bake Ingredients Pvt. Ltd., Allied Mills Pty Ltd., Watson Inc., Mahindra Group, Puratos Ltd., Lesaffre SA, Echema Technologies LLC, Pillsbury Company LLC, King Arthur Flour Company Inc., Pamela’s Products Inc., and Enhance Proteins Ltd.
Additional Attributes Dollar sales, share, growth forecast, key application trends, top-performing product types, regional demand shifts, competitor strategies, pricing dynamics, sourcing patterns, distribution insights, regulatory outlook, private-label growth.

Key Segmentation 

By Product Type:

The industry is segmented into flours, sweeteners, edible oils, cocoa and chocolate, and others.

By Application:

The industry finds applications in bread, cakes & pies, cookies & biscuits, pizza dough, , and others.

By Source:

The industry is segmented into natural, organic, and artificial.

By Region:

The industry covers regions including North America, Europe, Asia Pacific, Latin America, and the Middle East & Africa.

Table of Content

  1. Executive Summary
  2. Industry Introduction, including Taxonomy and Market Definition
  3. Trends and Success Factors, including Macro-economic Factors, Market Dynamics, and Recent Industry Developments
  4. Global Market Demand Analysis 2020 to 2024 and Forecast 2025 to 2035, including Historical Analysis and Future Projections
  5. Pricing Analysis
  6. Global Market Analysis 2020 to 2024 and Forecast 2025 to 2035
    • Product Type
    • Application
    • Source
  7. By Product Type
    • Flours
    • Sweeteners
    • Edible Oils
    • Coca and Chocolate
    • Other
  8. By Application
    • Bread
    • Cakes & Pies
    • Cookies & Biscuits
    • Pizza Dough
    • Brownies
    • Pancakes & Waffle
    • Others (Crackers etc.)
  9. By Source
    • Natural
    • Organic
    • Artificial
  10. By Region
    • North America
    • Latin America
    • Western Europe
    • Eastern Europe
    • East Asia
    • South Asia & Pacific
    • Central Asia
    • Russia and Belarus
    • Balkan & Baltic Countries
    • Middle East and Africa
  11. North America Sales Analysis 2020 to 2024 and Forecast 2025 to 2035, by Key Segments and Countries
  12. Latin America Sales Analysis 2020 to 2024 and Forecast 2025 to 2035, by Key Segments and Countries
  13. Western Europe Sales Analysis 2020 to 2024 and Forecast 2025 to 2035, by Key Segments and Countries
  14. Eastern Europe Sales Analysis 2020 to 2024 and Forecast 2025 to 2035, by Key Segments and Countries
  15. East Asia Sales Analysis 2020 to 2024 and Forecast 2025 to 2035, by Key Segments and Countries
  16. South Asia & Pacific Sales Analysis 2020 to 2024 and Forecast 2025 to 2035, by Key Segments and Countries
  17. Central Asia Sales Analysis 2020 to 2024 and Forecast 2025 to 2035, by Key Segments and Countries
  18. Russia and Belarus Sales Analysis 2020 to 2024 and Forecast 2025 to 2035, by Key Segments and Countries
  19. Balkan & Baltic Countries Sales Analysis 2020 to 2024 and Forecast 2025 to 2035, by Key Segments and Countries
  20. Middle East and Africa Sales Analysis 2020 to 2024 and Forecast 2025 to 2035, by Key Segments and Countries
  21. Sales Forecast to 2035 by Product Type, Application, and Source for 30 Countries
  22. Competitive Assessment, Company Share Analysis by Key Players, and Competition Dashboard
  23. Company Profile
    • Cargill Inc.
    • Archer Daniels Midland Company
    • Bakels Worldwide
    • Swiss Bake Ingredients Pvt. Ltd.
    • Allied Mills Pty Ltd.
    • Watson Inc.
    • Mahindra Group
    • Puratos Ltd.
    • Lesaffre SA
    • Echema Technologies, LLC
    • Other Prominent Market Player

List of Tables

  • Table 1: Global Market Value (USD Billion) & Volume (Unit) Forecast by Region, 2020-2035
  • Table 2: Global Market Value (USD Billion) & Volume (Unit) Forecast by Product Type, 2020-2035
  • Table 3: Global Market Value (USD Billion) & Volume (Unit) Forecast by Application, 2020-2035
  • Table 4: Global Market Value (USD Billion) & Volume (Unit) Forecast by Source, 2020-2035
  • Table 5: North America Market Value (USD Billion) & Volume (Unit) Forecast by Country, 2020-2035
  • Table 6: North America Market Value (USD Billion) & Volume (Unit) Forecast by Product Type, 2020-2035
  • Table 7: North America Market Value (USD Billion) & Volume (Unit) Forecast by Application, 2020-2035
  • Table 8: North America Market Value (USD Billion) & Volume (Unit) Forecast by Source, 2020-2035
  • Table 9: Latin America Market Value (USD Billion) & Volume (Unit) Forecast by Country, 2020-2035
  • Table 10: Latin America Market Value (USD Billion) & Volume (Unit) Forecast by Product Type, 2020-2035
  • Table 11: Latin America Market Value (USD Billion) & Volume (Unit) Forecast by Application, 2020-2035
  • Table 12: Latin America Market Value (USD Billion) & Volume (Unit) Forecast by Source, 2020-2035
  • Table 13: Western Europe Market Value (USD Billion) & Volume (Unit) Forecast by Country, 2020-2035
  • Table 14: Western Europe Market Value (USD Billion) & Volume (Unit) Forecast by Product Type, 2020-2035
  • Table 15: Western Europe Market Value (USD Billion) & Volume (Unit) Forecast by Application, 2020-2035
  • Table 16: Western Europe Market Value (USD Billion) & Volume (Unit) Forecast by Source, 2020-2035
  • Table 17: Eastern Europe Market Value (USD Billion) & Volume (Unit) Forecast by Country, 2020-2035
  • Table 18: Eastern Europe Market Value (USD Billion) & Volume (Unit) Forecast by Product Type, 2020-2035
  • Table 19: Eastern Europe Market Value (USD Billion) & Volume (Unit) Forecast by Application, 2020-2035
  • Table 20: Eastern Europe Market Value (USD Billion) & Volume (Unit) Forecast by Source, 2020-2035
  • Table 21: East Asia Market Value (USD Billion) & Volume (Unit) Forecast by Country, 2020-2035
  • Table 22: East Asia Market Value (USD Billion) & Volume (Unit) Forecast by Product Type, 2020-2035
  • Table 23: East Asia Market Value (USD Billion) & Volume (Unit) Forecast by Application, 2020-2035
  • Table 24: East Asia Market Value (USD Billion) & Volume (Unit) Forecast by Source, 2020-2035
  • Table 25: South Asia & Pacific Market Value (USD Billion) & Volume (Unit) Forecast by Country, 2020-2035
  • Table 26: South Asia & Pacific Market Value (USD Billion) & Volume (Unit) Forecast by Product Type, 2020-2035
  • Table 27: South Asia & Pacific Market Value (USD Billion) & Volume (Unit) Forecast by Application, 2020-2035
  • Table 28: South Asia & Pacific Market Value (USD Billion) & Volume (Unit) Forecast by Source, 2020-2035
  • Table 29: Central Asia Market Value (USD Billion) & Volume (Unit) Forecast by Country, 2020-2035
  • Table 30: Central Asia Market Value (USD Billion) & Volume (Unit) Forecast by Product Type, 2020-2035
  • Table 31: Central Asia Market Value (USD Billion) & Volume (Unit) Forecast by Application, 2020-2035
  • Table 32: Central Asia Market Value (USD Billion) & Volume (Unit) Forecast by Source, 2020-2035
  • Table 33: Russia and Belarus Market Value (USD Billion) & Volume (Unit) Forecast by Country, 2020-2035
  • Table 34: Russia and Belarus Market Value (USD Billion) & Volume (Unit) Forecast by Product Type, 2020-2035
  • Table 35: Russia and Belarus Market Value (USD Billion) & Volume (Unit) Forecast by Application, 2020-2035
  • Table 36: Russia and Belarus Market Value (USD Billion) & Volume (Unit) Forecast by Source, 2020-2035
  • Table 37: Balkan & Baltic Countries Market Value (USD Billion) & Volume (Unit) Forecast by Country, 2020-2035
  • Table 38: Balkan & Baltic Countries Market Value (USD Billion) & Volume (Unit) Forecast by Product Type, 2020-2035
  • Table 39: Balkan & Baltic Countries Market Value (USD Billion) & Volume (Unit) Forecast by Application, 2020-2035
  • Table 40: Balkan & Baltic Countries Market Value (USD Billion) & Volume (Unit) Forecast by Source, 2020-2035
  • Table 41: Middle East and Africa Market Value (USD Billion) & Volume (Unit) Forecast by Country, 2020-2035
  • Table 42: Middle East and Africa Market Value (USD Billion) & Volume (Unit) Forecast by Product Type, 2020-2035
  • Table 43: Middle East and Africa Market Value (USD Billion) & Volume (Unit) Forecast by Application, 2020-2035
  • Table 44: Middle East and Africa Market Value (USD Billion) & Volume (Unit) Forecast by Source, 2020-2035

List of Figures

  • Figure 1: Global Market Value Share (%), Growth Rate (Y-o-Y), and Value (USD Billion) & Volume (Unit) Projection by Product Type, 2020-2035
  • Figure 2: Global Market Value Share (%), Growth Rate (Y-o-Y), and Value (USD Billion) & Volume (Unit) Projection by Application, 2020-2035
  • Figure 3: Global Market Value Share (%), Growth Rate (Y-o-Y), and Value (USD Billion) & Volume (Unit) Projection by Source, 2020-2035
  • Figure 4: Global Market Value Share (%), Growth Rate (Y-o-Y), and Value (USD Billion) & Volume (Unit) Projection by Region, 2020-2035
  • Figure 5: North America Market Value Share (%), Growth Rate (Y-o-Y), and Value (USD Billion) & Volume (Unit) Projection by Product Type, 2020-2035
  • Figure 6: North America Market Value Share (%), Growth Rate (Y-o-Y), and Value (USD Billion) & Volume (Unit) Projection by Application, 2020-2035
  • Figure 7: North America Market Value Share (%), Growth Rate (Y-o-Y), and Value (USD Billion) & Volume (Unit) Projection by Source, 2020-2035
  • Figure 8: North America Market Value Share (%), Growth Rate (Y-o-Y), and Value (USD Billion) & Volume (Unit) Projection by Country, 2020-2035
  • Figure 9: Latin America Market Value Share (%), Growth Rate (Y-o-Y), and Value (USD Billion) & Volume (Unit) Projection by Product Type, 2020-2035
  • Figure 10: Latin America Market Value Share (%), Growth Rate (Y-o-Y), and Value (USD Billion) & Volume (Unit) Projection by Application, 2020-2035
  • Figure 11: Latin America Market Value Share (%), Growth Rate (Y-o-Y), and Value (USD Billion) & Volume (Unit) Projection by Source, 2020-2035
  • Figure 12: Latin America Market Value Share (%), Growth Rate (Y-o-Y), and Value (USD Billion) & Volume (Unit) Projection by Country, 2020-2035
  • Figure 13: Western Europe Market Value Share (%), Growth Rate (Y-o-Y), and Value (USD Billion) & Volume (Unit) Projection by Product Type, 2020-2035
  • Figure 14: Western Europe Market Value Share (%), Growth Rate (Y-o-Y), and Value (USD Billion) & Volume (Unit) Projection by Application, 2020-2035
  • Figure 15: Western Europe Market Value Share (%), Growth Rate (Y-o-Y), and Value (USD Billion) & Volume (Unit) Projection by Source, 2020-2035
  • Figure 16: Western Europe Market Value Share (%), Growth Rate (Y-o-Y), and Value (USD Billion) & Volume (Unit) Projection by Country, 2020-2035
  • Figure 17: Eastern Europe Market Value Share (%), Growth Rate (Y-o-Y), and Value (USD Billion) & Volume (Unit) Projection by Product Type, 2020-2035
  • Figure 18: Eastern Europe Market Value Share (%), Growth Rate (Y-o-Y), and Value (USD Billion) & Volume (Unit) Projection by Application, 2020-2035
  • Figure 19: Eastern Europe Market Value Share (%), Growth Rate (Y-o-Y), and Value (USD Billion) & Volume (Unit) Projection by Source, 2020-2035
  • Figure 20: Eastern Europe Market Value Share (%), Growth Rate (Y-o-Y), and Value (USD Billion) & Volume (Unit) Projection by Country, 2020-2035
  • Figure 21: East Asia Market Value Share (%), Growth Rate (Y-o-Y), and Value (USD Billion) & Volume (Unit) Projection by Product Type, 2020-2035
  • Figure 22: East Asia Market Value Share (%), Growth Rate (Y-o-Y), and Value (USD Billion) & Volume (Unit) Projection by Application, 2020-2035
  • Figure 23: East Asia Market Value Share (%), Growth Rate (Y-o-Y), and Value (USD Billion) & Volume (Unit) Projection by Source, 2020-2035
  • Figure 24: East Asia Market Value Share (%), Growth Rate (Y-o-Y), and Value (USD Billion) & Volume (Unit) Projection by Country, 2020-2035
  • Figure 25: South Asia & Pacific Market Value Share (%), Growth Rate (Y-o-Y), and Value (USD Billion) & Volume (Unit) Projection by Product Type, 2020-2035
  • Figure 26: South Asia & Pacific Market Value Share (%), Growth Rate (Y-o-Y), and Value (USD Billion) & Volume (Unit) Projection by Application, 2020-2035
  • Figure 27: South Asia & Pacific Market Value Share (%), Growth Rate (Y-o-Y), and Value (USD Billion) & Volume (Unit) Projection by Source, 2020-2035
  • Figure 28: South Asia & Pacific Market Value Share (%), Growth Rate (Y-o-Y), and Value (USD Billion) & Volume (Unit) Projection by Country, 2020-2035
  • Figure 29: Central Asia Market Value Share (%), Growth Rate (Y-o-Y), and Value (USD Billion) & Volume (Unit) Projection by Product Type, 2020-2035
  • Figure 30: Central Asia Market Value Share (%), Growth Rate (Y-o-Y), and Value (USD Billion) & Volume (Unit) Projection by Application, 2020-2035
  • Figure 31: Central Asia Market Value Share (%), Growth Rate (Y-o-Y), and Value (USD Billion) & Volume (Unit) Projection by Source, 2020-2035
  • Figure 32: Central Asia Market Value Share (%), Growth Rate (Y-o-Y), and Value (USD Billion) & Volume (Unit) Projection by Country, 2020-2035
  • Figure 33: Russia and Belarus Market Value Share (%), Growth Rate (Y-o-Y), and Value (USD Billion) & Volume (Unit) Projection by Product Type, 2020-2035
  • Figure 34: Russia and Belarus Market Value Share (%), Growth Rate (Y-o-Y), and Value (USD Billion) & Volume (Unit) Projection by Application, 2020-2035
  • Figure 35: Russia and Belarus Market Value Share (%), Growth Rate (Y-o-Y), and Value (USD Billion) & Volume (Unit) Projection by Source, 2020-2035
  • Figure 36: Russia and Belarus Market Value Share (%), Growth Rate (Y-o-Y), and Value (USD Billion) & Volume (Unit) Projection by Country, 2020-2035
  • Figure 37: Balkan & Baltic Countries Market Value Share (%), Growth Rate (Y-o-Y), and Value (USD Billion) & Volume (Unit) Projection by Product Type, 2020-2035
  • Figure 38: Balkan & Baltic Countries Market Value Share (%), Growth Rate (Y-o-Y), and Value (USD Billion) & Volume (Unit) Projection by Application, 2020-2035
  • Figure 39: Balkan & Baltic Countries Market Value Share (%), Growth Rate (Y-o-Y), and Value (USD Billion) & Volume (Unit) Projection by Source, 2020-2035
  • Figure 40: Balkan & Baltic Countries Market Value Share (%), Growth Rate (Y-o-Y), and Value (USD Billion) & Volume (Unit) Projection by Country, 2020-2035
  • Figure 41: Middle East and Africa Market Value Share (%), Growth Rate (Y-o-Y), and Value (USD Billion) & Volume (Unit) Projection by Product Type, 2020-2035
  • Figure 42: Middle East and Africa Market Value Share (%), Growth Rate (Y-o-Y), and Value (USD Billion) & Volume (Unit) Projection by Application, 2020-2035
  • Figure 43: Middle East and Africa Market Value Share (%), Growth Rate (Y-o-Y), and Value (USD Billion) & Volume (Unit) Projection by Source, 2020-2035
  • Figure 44: Middle East and Africa Market Value Share (%), Growth Rate (Y-o-Y), and Value
  • (USD Billion) & Volume (Unit) Projection by Country, 2020-2035

Frequently Asked Questions

What is the estimated market size of the bakery mixes industry in 2025?

The industry is valued at USD 6.8 billion in 2025.

What is the projected industry size of the bakery mixes industry by 2035?

It is forecasted to reach USD 11.2 billion by 2035.

What is the expected CAGR for the bakery mixes industry between 2025 and 2035?

The industry is anticipated to grow at a CAGR of 5.2% during this period.

Which segment is expected to lead the bakery mixes market in 2025?

Natural source is projected to lead the market with a 62.0% share in 2025.

Which region is expected to witness the highest growth in the bakery mixes market?

Asia Pacific, particularly India, is expected to be the key growth region with a projected growth rate of 8.5%.

Explore Similar Insights

Future Market Insights

Bakery Mixes Market