Bakery Emulsions Market Size, Share, and Forecast Outlook 2025 to 2035

The bakery emulsions market is expected to grow from USD 460.5 million in 2025 to USD 870.2 million by 2035, reflecting a 6.4% CAGR over the period. Growth is supported by requirements for consistent crumb structure, extended moisture retention, and freeze-thaw tolerance across high-output pastry and cake lines.
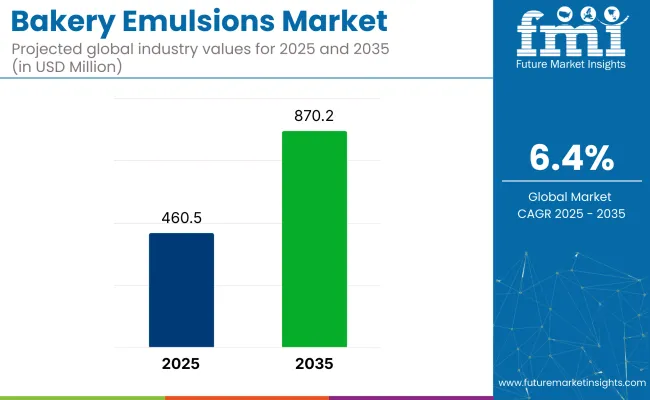
Quick Stats for Bakery Emulsions Market

  • Market value (2025): USD 460.5 million
  • Forecast value (2035): USD 870.2 million
  • Forecast CAGR (2025 to 2035): 6.4%
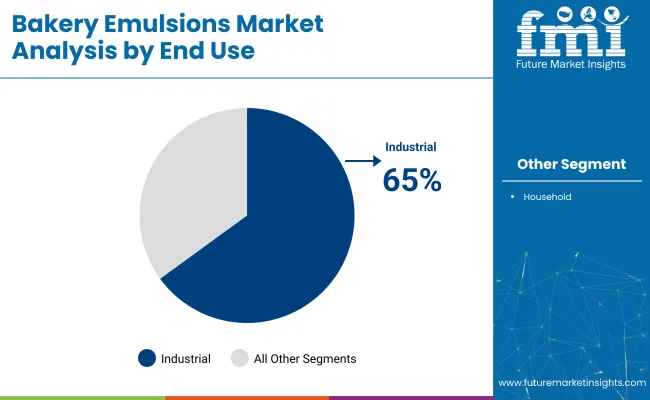
  • Leading segment in 2035: Industrial end-use (≈ 65% share)
  • Key growth region: Asia Pacific
  • Leading country: India (6.8% CAGR)
  • Key players: Archer Daniels Midland Company, Cargill Inc., DuPont de Nemours Inc., Corbion N.V., Kerry Group plc.

Bakery Emulsions Market

Attributes Description
Estimated Global Industry Size (2025E) USD 460.5 million
Projected Global Value (2035F) USD 870.2 million
Value-based CAGR (2025 to 2035) 6.4%

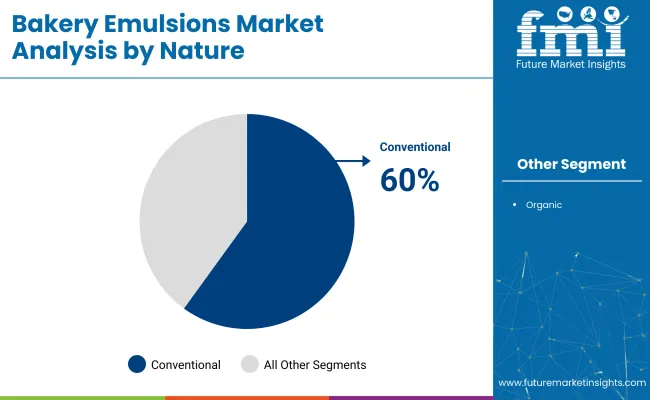
Plant-derived sources-projected to hold 42.5% share in 2025-are preferred because allergen-light lipid profiles align with global ingredient-labelling mandates. Conventional formulations retain 60% share, as proven emulsifier blends deliver stable aeration across a broad pH spectrum at competitive cost.

Carbohydrate-rich baked goods rely on emulsions to stabilise gas cells and prevent crumb drying during ambient storage. Plant-based lecithins and mono- and diglycerides have been adopted for their oxidative stability and ease of dosage in liquid form, which simplifies integration into automated metering systems. Hypermarket dominance in distribution is maintained through private-label programmes that secure long-term supply contracts with emulsifier blenders.

Scalability in production is achieved by modular esterification reactors and enzymatic interesterification units that accommodate flexible batch sizes, ensuring uninterrupted supply during peak seasonal demand. Baking centers are constantly being developed, which keeps the industry active. DSM-Firmenich inaugurated its Princeton Baking Innovation Center in New Jersey, aiming to accelerate innovation and co-create applications such as breads, rolls, pastries, tortillas, cookies, and snack foods.

The industry holds a defined share within its parent markets. In the food emulsion market, it holds around 5-7%, as bakery emulsions are a key segment in the broader emulsion category. Within the baking ingredients market, the share is approximately 8-10%, given the role emulsions play in improving the texture and consistency of baked goods.

In the food and beverage market, the bakery emulsions market contributes about 3-5%, driven by their widespread use in bakery products. The food processing market sees a share of 4-6%, as emulsions enhance the efficiency of food production. The functional foods market holds a smaller share of 2-3%, with emulsions being used in healthier bakery options.

Analysis of Bakery Emulsions Market by Top Investment Segments

Bakery-emulsion spending in 2025 concentrates on plant-derived sources, hypermarket distribution, conventional formulations, industrial end-use adoption, and bakery-specific applications. Each focus area attracts capital through regulatory alignment, logistics economies, processing stability, and output consistency demanded by high-throughput baked-goods production lines.

Plant-Derived Inputs Drive Emulsion Sourcing Strategies

A 42.5% share has been accounted for by plant sources in 2025, as allergen avoidance, supply predictability, and non-animal certification strengthen purchasing contracts across flavor houses and emulsifier blenders demanding tight specification control.

  • Soy- and sunflower-based lecithin fractions replace egg derivatives while retaining α-GPC ratios.
  • Cold-press extraction ensures peroxide values below 3 meq/kg during long-haul shipping.
  • Identity-preserved grain channels permit GMO-free verification for label-sensitive SKUs.
  • Defoamed lecithin improves oil-in-water dispersion, stabilizing whipped batters under continuous mixing.
  • High-oleic feedstocks extend oxidative shelf life, cutting antioxidant additive budgets in finished goods.

Hypermarket Chains Capture High-Volume Emulsion Retail Turnover

A 43.3% share has been held by hypermarkets in 2025, supported by centralized procurement hubs, aisle adjacency to home-baking kits, and weekly flyer promotions that trigger impulse purchases among price-sensitive hobby bakers.

  • Private-label partnerships lock multi-pallet orders, lowering per-unit logistics expenditure.
  • End-cap placement pairs emulsions with cake premixes, lifting cross-category basket value.
  • Digital shelf tags adjust pricing after soy-oil spot fluctuations, protecting gross margin.
  • Loyalty-card analytics guide coupon drops targeted at frequent home-bake shoppers.
  • Ambient-stable PET bottles reduce shrinkage claims from temperature swings in warehouse aisles.

Conventional Formulations Maintain Line Compatibility Across Plants

A 60% share has been held by conventional emulsions in 2025, because recipe familiarity, predictable rheology, and broad regulatory acceptance reduce reformulation downtime when multiple bakeries run parallel SKUs under license.
  • Monoglyceride-based blends align with existing emulsifier pumps calibrated for 3000 cP viscosity.
  • Calcium-propionate tolerance permits preservative synergy without microbial bloom at 72 h proof hold.
  • Batch records meet GFSI traceability rules through established supplier audit trails.
  • Heat-stable emulsions maintain aeration across 220 °C tunnel-oven dwell, preventing crumb collapse.
  • Consistent HLB values enable quick scaling in spiral-mixer bakeries without pilot testing.

Bakery Emulsions Market Analysis By Nature

Industrial End Use Maximizes Batch Emulsion Utilization Efficiency

A 65% share has been accounted for by industrial users in 2025, as multi-shift plants demand flow-controlled emulsions that support uninterrupted dough preparation and finished-product texture targets across high-speed automated lines.
  • Bulk IBC totes interface with CIP-certified dosing manifolds, trimming manual handling labour.
  • Inline refractometers verify solids content, preventing overdosing that could gum makeup belts.
  • Programmable logic controllers log additive volumes, easing compliance with FSMA preventive controls.
  • Emulsion flash-pasteurization eliminates ambient-storage microbial risks in warm-climate facilities.
  • Joint-development agreements with enzyme suppliers yield synergistic crumb-softening complexes tested at pilot scale.

Bakery Emulsions Market Analysis By End Use

Bakery Applications Anchor Core Emulsion Consumption Patterns

A 55% share has been held by bakery applications in 2025, since crumb tenderness, moisture retention, and slice integrity rely on finely tuned oil-water interfaces throughout proofing, baking, cooling, and slicing operations.

  • Sandwich loaf production values stable emulsion HLB to prevent sidewall tearing.
  • Frozen dough suppliers rely on anti-staling emulsions sustaining elasticity after −18 °C storage.
  • High-ratio cake batters maintain aerated density targets when emulsions cap bubble coalescence.
  • Par-baked crusts avoid surface cracking because emulsions mediate steam release in flash ovens.
  • Gluten-free formulations incorporate polyglycerol esters to compensate for absent viscoelastic networks.

Top Bakery Emulsions Market Dynamics

Regulatory labeling restrictions and flavor stability demands are reshaping formulation priorities in the industry. Manufacturers are investing in non-alcoholic emulsions and reformulation protocols to retain product claims while meeting region-specific compliance rules and shelf-life requirements.

Flavor Stability Driving Reformulation of Emulsion Blends

Increased demand for consistent flavor retention under frozen and ambient storage has led to a shift toward high-performance emulsifiers. Water-based emulsions offering oxidative stability and low volatility are being prioritized by industrial bakers supplying frozen pastry and pre-mix categories.

Cargill and LorAnn have developed bakery emulsions using micro-encapsulation techniques that preserve flavor integrity under variable pH and temperature. These emulsions are replacing alcohol-based extracts in frozen dough systems where ethanol evaporation caused flavor loss.

  • Emulsion blends are now tested under accelerated shelf-life simulation before commercial scale-up.
  • Micro-encapsulated flavor carriers are being added to ensure profile consistency in freeze-thaw cycles.
  • Volatile alcohol carriers are being phased out across long-shelf baked product lines.

Labeling Restrictions Reshaping Emulsion Ingredient Declarations

Labeling restrictions on synthetic carriers and artificial solvents have forced reformulations across bakery emulsions intended for export industries. EU regulations disqualify certain glycol-based solvents and flavor fixatives under natural labeling schemes. USA clean-label programs led by top retailers now flag emulsions containing BHA, propylene glycol, and certain co-solvents. In response, manufacturers are replacing these with glycerol or triacetin-based systems that meet “natural flavor” classification.
  • Solvent carriers are being reformulated to align with “natural” and “clean-label” claim requirements.
  • Bakery buyers request full carrier and solvent documentation before accepting flavor emulsions.
  • Products using non-compliant solvents face blocked entry in clean-label retail assortments.

Top Countries Developing, Distributing, and Formulating Bakery Emulsions

Bakery Emulsions Market Country Wise Analysis

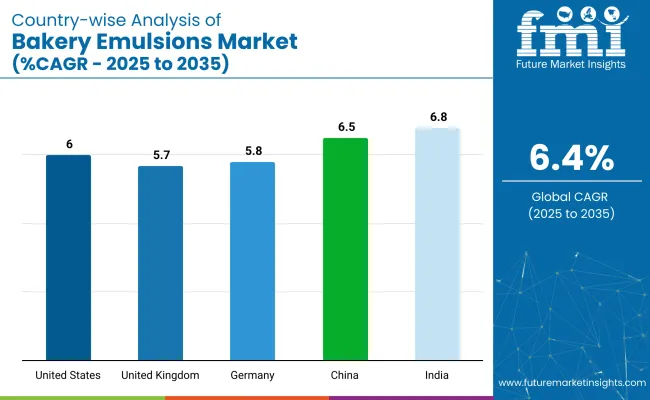
Country CAGR (2025 to 2035)
United States 6%
United Kingdom 5.7%
Germany 5.8%
China 6.5%
India 6.8%

In the United States, the bakery emulsions market is growing at a 6.0% CAGR, with regulations like the Food Labeling Modernization Act pushing for clearer emulsifier labeling. The shift toward clean-label emulsifiers, such as lecithin and enzymatic alternatives, is encouraged by school-lunch nutrient profiles and FDA sodium reduction targets. Germany follows closely, expanding at 5.8% CAGR, with trans-fat regulations and the Reduction and Innovation Strategy driving demand for cleaner emulsions like enzyme-modified sunflower lecithin.

In BRICS, India’s market is rising at 6.8% CAGR, bolstered by FSSAI’s stricter additive limits and state-level support for enzyme-emulsion plants. China, growing at 6.5% CAGR, benefits from tariff exemptions and the “Healthy China 2030” blueprint, which incentivizes replacing synthetic emulsifiers with protein-polysaccharide complexes. In ASEAN, Indonesia and other regions see similar trends as domestic emulsifier production expands, reflecting global movements towards cleaner, more natural alternatives in bakery formulations.

Growth Analysis of the Bakery Emulsions Market in the United States

The bakery emulsions market in the United States is forecast to advance at a CAGR of 6.0% from 2025 to 2035. Proposed Food Labeling Modernization rules are expected to mandate front-of-pack disclosure of mono- and diglycerides, accelerating reformulation toward enzymatic and lecithin-based alternatives.

FDA’s Voluntary Sodium Reduction targets push bakeries toward emulsions that improve dough rheology without chemical salts. State procurement contracts now award preference to clean-label emulsified mixes that meet school-lunch nutrient profiles.

  • Food Labeling Modernization Act proposal drives transparent emulsifier labelling across retail bakery aisles
  • Voluntary Sodium Reduction framework encourages enzyme-derived emulsions that enhance texture under lower-salt recipes
  • School-nutrition contracts prioritise clean-label dough conditioners replacing calcium propionate and synthetic esters

Bakery Emulsions Market Growth Trajectory in the United Kingdom

The bakery emulsions market in the United Kingdom is projected to progress at a CAGR of 5.7% between 2025 and 2035. Retained EU Regulation 1333/2008 requires safety dossiers for every emulsifier, while the UK Nutrient Profiling Model pressures manufacturers to lower saturated fat. Innovate UK grants support trials of rapeseed-lecithin blends that replace palm-derived esters. Retailers enforce “no E-471 unless sustainably sourced” pledges, prompting investment in domestic enzyme-activated oil emulsions.

  • Retained EU additive rules obligate toxicology data submission before new bakery emulsion launches
  • Innovate UK funding offsets pilot-plant costs for rapeseed-lecithin spray-drying technology adoption
  • Top grocers audit supplier compliance with palm-free emulsifier commitments in private-label bread lines

Future Outlook of Bakery Emulsions Market in Germany

The bakery emulsions market in Germany is expected to grow at a CAGR of 5.8% from 2025 to 2035. Federal Reduction and Innovation Strategy incentives reward bakeries lowering additive emulsifiers by switching to enzyme-modified sunflower lecithin. EU Regulation 2019/649, restricting industrial trans fats, has eliminated hydrogenated monoglyceride blends, driving demand for clean emulsions. KfW low-interest loans finance continuous emulsification systems installed in midsize bread plants across North Rhine-Westphalia.

  • Trans-fat regulation removes hydrogenated emulsifier options, favouring non-hydrogenated lecithin solutions
  • Reduction and Innovation Strategy grants prioritise bread producers having additive-free dough conditioning
  • KfW loan programme funds inline high-shear mixers for emulsions produced from domestic sunflower oil

Bakery Emulsions Market Sales Outlook in China

The bakery emulsions market in China is slated to expand at a CAGR of 6.5% between 2025 and 2035. National Standard GB 2760 classifies bakery emulsifiers as processing aids, demanding residue testing by provincial laboratories. Tariff exemptions through Hainan Free Trade Port reduce costs for enzyme-modified soy lecithin imports. The “Healthy China 2030” blueprint encourages bakeries to replace synthetic emulsifiers with protein-polysaccharide complexes, improving bread softness without extra fats.

  • GB 2760 residue thresholds enforce batch-level testing before emulsions enter commercial bakeries
  • Free Trade Port duty waivers lower import expenses for high-purity lecithin and enzyme co-factors
  • Healthy China policy incentives favour emulsions reducing saturated fat while maintaining loaf volume

Bakery Emulsions Market Growth Outlook in India

The bakery emulsions market in India is projected to grow at a CAGR of 6.8% from 2025 to 2035. FSSAI’s 2022 Food Additive Amendment capped mono- and diglyceride inclusion, steering manufacturers toward rice-bran-based emulsions. Production-Linked Incentive (PLI) benefits for fermentation-derived additives support local enzyme emulsion plants. State Mega Food Parks provide subsidised steam and electricity for bakeries adopting in-house lecithin hydration systems, boosting regional self-sufficiency.

  • Food Additive Amendment enforces tighter inclusion ceilings for conventional emulsifiers across industrial bread production
  • PLI scheme reimburses up to five percent of incremental sales from domestically produced enzyme emulsions
  • Mega Food Park utilities reduce overhead for bakeries operating continuous lecithin hydration and blending equipment

Leading Suppliers in the Bakery Emulsions Industry

The bakery emulsions market is led by key players like Archer Daniels Midland Company (ADM), Cargill Inc., DuPont de Nemours, Inc., and Corbion N.V. ADM and Cargill focus on offering a broad range of emulsions that improve texture and extend shelf life, leveraging their vast distribution networks.

DuPont and Corbion focus on innovation in developing emulsions that cater to the growing demand for clean-label products. Kerry Group and Puratos Group use strategic partnerships to enhance their presence in the bakery sector by providing specialized emulsions for specific formulations. The industry remains moderately fragmented, with large players holding large shares, while smaller, niche companies continue to innovate and target specialized applications.

Recent Industry News

  • Palsgaard launched SA 6600, a stress-resistant cake emulsifier that ensures cake quality irrespective of variations in temperature, stabilizing the product during processing by keeping air tightly bound within the batter.
  • Corbion introduced Vantage 2060, an enzyme-based solution that allows bakers to reduce hard fats, oils, and emulsifiers while maintaining softness, fine crumb structure, loaf volume, stackability, and sliceability in baked goods.

Key Players in the Bakery Emulsions Market

  • Archer Daniels Midland Company (ADM)
  • Cargill Inc.
  • DuPont de Nemours, Inc.
  • ADM (Archer Daniels Midland Company)
  • Corbion N.V.
  • Kerry Group plc
  • Puratos Group
  • DSM-Firmenich
  • Palsgaard A/S
  • Lasenor Emul S.L.
  • Bakels Group
  • Others

Report Coverage and Scope Summary

Report Attributes Key Insights
Estimated Market Value (2025) USD 460.5 million
Projected Market Value (2035) USD 870.2 million
CAGR (2025 to 2035) 6.4%
Base Year for Estimation 2024
Historical Period 2020 to 2024
Forecast Period 2025 to 2035
Quantitative Units Revenue in USD million
Source Plant, Animal, Synthetic, Microbial, Egg-derived, Milk-based, Synthetic/Bio-based
Nature Conventional, Organic
End-Use Industrial, Household
Application Bakery, Hotels, and Restaurants
Distribution Channel Store-Based Retail, Specialty Stores, Online Retail, Supermarkets, Hypermarkets
Region North America, Latin America, Eastern Europe, Western Europe, East Asia, South Asia & Pacific, Central Asia, Balkan and Baltic Countries, Russia & Belarus, and the Middle East & Africa
Countries Covered United States, Canada, Mexico, Brazil, Argentina, Germany, France, United Kingdom, Italy, Spain, Netherlands, China, India, Japan, South Korea, ANZ, GCC Countries, South Africa
Key Players Archer Daniels Midland Company (ADM), Cargill Inc., DuPont de Nemours, Inc., Corbion N.V., Kerry Group plc, Puratos Group, DSM-Firmenich, Palsgaard A/S, Lasenor Emul S.L., Bakels Group, Others
Additional Attributes Dollar sales, CAGR trends, product type segmentation, regional growth patterns, competitor dollar sales & market share, price range segmentation, application-specific demand, distribution channel analysis

Key Segmentation

By Source:

The segmentation is into plant, animal, synthetic, microbial, egg-derived, milk-based, and synthetic/bio-based.

By Nature:

The segmentation is into conventional and organic.

By End-Use:

The segmentation is into industrial and household.

By Application:

The segmentation is into bakery, hotels, and restaurants.

By Distribution Channel:

The segmentation is into store-based retail, specialty stores, online retail, supermarkets, and hypermarkets.

By Region:

The segmentation is into North America, Latin America, Eastern Europe, Western Europe, East Asia, South Asia & Pacific, Central Asia, Balkan and Baltic Countries, Russia & Belarus, and the Middle East & Africa.

Table of Content

  1. Executive Summary
    • Global Market Outlook
    • Demand-side Trends
    • Supply-side Trends
    • Technology Roadmap Analysis
    • Analysis and Recommendations
  2. Market Overview
    • Market Coverage / Taxonomy
    • Market Definition / Scope / Limitations
  3. Market Background
    • Market Dynamics
      • Drivers
      • Restraints
      • Opportunity
      • Trends
    • Scenario Forecast
      • Demand in Optimistic Scenario
      • Demand in Likely Scenario
      • Demand in Conservative Scenario
    • Opportunity Map Analysis
    • Product Life Cycle Analysis
    • Supply Chain Analysis
      • Supply Side Participants and their Roles
        • Producers
        • Mid-Level Participants (Traders/ Agents/ Brokers)
        • Wholesalers and Distributors
      • Value Added and Value Created at Node in the Supply Chain
      • List of Raw Material Suppliers
      • List of Existing and Potential Buyer’s
    • Investment Feasibility Matrix
    • Value Chain Analysis
      • Profit Margin Analysis
      • Wholesalers and Distributors
      • Retailers
    • PESTLE and Porter’s Analysis
    • Regulatory Landscape
      • By Key Regions
      • By Key Countries
    • Regional Parent Market Outlook
    • Production and Consumption Statistics
    • Import and Export Statistics
  4. Global Market Analysis 2020 to 2024 and Forecast, 2025 to 2035
    • Historical Market Size Value (USD Million) & Million Units Analysis, 2020 to 2024
    • Current and Future Market Size Value (USD Million) & Million Units Projections, 2025 to 2035
      • Y-o-Y Growth Trend Analysis
      • Absolute $ Opportunity Analysis
  5. Global Market Pricing Analysis 2020 to 2024 and Forecast 2025 to 2035
  6. Global Market Analysis 2020 to 2024 and Forecast 2025 to 2035, By Source
    • Introduction / Key Findings
    • Historical Market Size Value (USD Million) & Million Units Analysis By Source, 2020 to 2024
    • Current and Future Market Size Value (USD Million) & Million Units Analysis and Forecast By Source, 2025 to 2035
      • Plant
      • Animal
      • Synthetic
      • Microbial
      • Egg-Derived
      • Milk-based
      • Synthetic/Bio-based
    • Y-o-Y Growth Trend Analysis By Source, 2020 to 2024
    • Absolute $ Opportunity Analysis By Source, 2025 to 2035
  7. Global Market Analysis 2020 to 2024 and Forecast 2025 to 2035, By Nature
    • Introduction / Key Findings
    • Historical Market Size Value (USD Million) & Million Units Analysis By Nature, 2020 to 2024
    • Current and Future Market Size Value (USD Million) & Million Units Analysis and Forecast By Nature, 2025 to 2035
      • Conventional
      • Organic
    • Y-o-Y Growth Trend Analysis By Nature, 2020 to 2024
    • Absolute $ Opportunity Analysis By Nature, 2025 to 2035
  8. Global Market Analysis 2020 to 2024 and Forecast 2025 to 2035, By End-Use
    • Introduction / Key Findings
    • Historical Market Size Value (USD Million) & Million Units Analysis By End-Use, 2020 to 2024
    • Current and Future Market Size Value (USD Million) & Million Units Analysis and Forecast By End-Use, 2025 to 2035
      • Industrial
      • Household
    • Y-o-Y Growth Trend Analysis By End-Use, 2020 to 2024
    • Absolute $ Opportunity Analysis By End-Use, 2025 to 2035
  9. Global Market Analysis 2020 to 2024 and Forecast 2025 to 2035, By Application
    • Introduction / Key Findings
    • Historical Market Size Value (USD Million) & Million Units Analysis By Application, 2020 to 2024
    • Current and Future Market Size Value (USD Million) & Million Units Analysis and Forecast By Application, 2025 to 2035
      • Bakery
      • Hotels
      • Restaurants
    • Y-o-Y Growth Trend Analysis By Application, 2020 to 2024
    • Absolute $ Opportunity Analysis By Application, 2025 to 2035
  10. Global Market Analysis 2020 to 2024 and Forecast 2025 to 2035, By Distribution Channel
    • Introduction / Key Findings
    • Historical Market Size Value (USD Million) & Million Units Analysis By Distribution Channel, 2020 to 2024
    • Current and Future Market Size Value (USD Million) & Million Units Analysis and Forecast By Distribution Channel, 2025 to 2035
      • Store-based Retail
      • Specialty Stores
      • Online Retail
      • Supermarkets
      • Hypermarkets
    • Y-o-Y Growth Trend Analysis By Distribution Channel, 2020 to 2024
    • Absolute $ Opportunity Analysis By Distribution Channel, 2025 to 2035
  11. Global Market Analysis 2020 to 2024 and Forecast 2025 to 2035, By Region
    • Introduction
    • Historical Market Size Value (USD Million) & Million Units Analysis By Region, 2020 to 2024
    • Current Market Size Value (USD Million) & Million Units Analysis and Forecast By Region, 2025 to 2035
      • North America
      • Latin America
      • Western Europe
      • Eastern Europe
      • East Asia
      • South Asia & Pacific
      • Middle East and Africa
    • Market Attractiveness Analysis By Region
  12. North America Market Analysis 2020 to 2024 and Forecast 2025 to 2035, By Country
    • Historical Market Size Value (USD Million) & Million Units Trend Analysis By Market Taxonomy, 2020 to 2024
    • Market Size Value (USD Million) & Million Units Forecast By Market Taxonomy, 2025 to 2035
      • By Country
        • USA
        • Canada
        • Mexico
      • By Source
      • By Nature
      • By End-Use
      • By Application
      • By Distribution Channel
    • Market Attractiveness Analysis
      • By Country
      • By Source
      • By Nature
      • By End-Use
      • By Application
      • By Distribution Channel
    • Key Takeaways
  13. Latin America Market Analysis 2020 to 2024 and Forecast 2025 to 2035, By Country
    • Historical Market Size Value (USD Million) & Million Units Trend Analysis By Market Taxonomy, 2020 to 2024
    • Market Size Value (USD Million) & Million Units Forecast By Market Taxonomy, 2025 to 2035
      • By Country
        • Brazil
        • Argentina
        • Rest of LATAM
      • By Source
      • By Nature
      • By End-Use
      • By Application
      • By Distribution Channel
    • Market Attractiveness Analysis
      • By Country
      • By Source
      • By Nature
      • By End-Use
      • By Application
      • By Distribution Channel
    • Key Takeaways
  14. Western Europe Market Analysis 2020 to 2024 and Forecast 2025 to 2035, By Country
    • Historical Market Size Value (USD Million) & Million Units Trend Analysis By Market Taxonomy, 2020 to 2024
    • Market Size Value (USD Million) & Million Units Forecast By Market Taxonomy, 2025 to 2035
      • By Country
        • Germany
        • Italy
        • France
        • UK
        • Spain
        • BENELUX
        • Nordic
        • Rest of W.Europe
      • By Source
      • By Nature
      • By End-Use
      • By Application
      • By Distribution Channel
    • Market Attractiveness Analysis
      • By Country
      • By Source
      • By Nature
      • By End-Use
      • By Application
      • By Distribution Channel
    • Key Takeaways
  15. Eastern Europe Market Analysis 2020 to 2024 and Forecast 2025 to 2035, By Country
    • Historical Market Size Value (USD Million) & Million Units Trend Analysis By Market Taxonomy, 2020 to 2024
    • Market Size Value (USD Million) & Million Units Forecast By Market Taxonomy, 2025 to 2035
      • By Country
        • Russia
        • Hungary
        • Poland
        • Balkan & Baltics
        • Rest of E. Europe
      • By Source
      • By Nature
      • By End-Use
      • By Application
      • By Distribution Channel
    • Market Attractiveness Analysis
      • By Country
      • By Source
      • By Nature
      • By End-Use
      • By Application
      • By Distribution Channel
    • Key Takeaways
  16. East Asia Market Analysis 2020 to 2024 and Forecast 2025 to 2035, By Country
    • Historical Market Size Value (USD Million) & Million Units Trend Analysis By Market Taxonomy, 2020 to 2024
    • Market Size Value (USD Million) & Million Units Forecast By Market Taxonomy, 2025 to 2035
      • By Country
        • China
        • Japan
        • South Korea
      • By Source
      • By Nature
      • By End-Use
      • By Application
      • By Distribution Channel
    • Market Attractiveness Analysis
      • By Country
      • By Source
      • By Nature
      • By End-Use
      • By Application
      • By Distribution Channel
    • Key Takeaways
  17. South Asia & Pacific Market Analysis 2020 to 2024 and Forecast 2025 to 2035, By Country
    • Historical Market Size Value (USD Million) & Million Units Trend Analysis By Market Taxonomy, 2020 to 2024
    • Market Size Value (USD Million) & Million Units Forecast By Market Taxonomy, 2025 to 2035
      • By Country
        • India
        • Australia & New Zealand
        • ASEAN
        • Rest of SAP
      • By Source
      • By Nature
      • By End-Use
      • By Application
      • By Distribution Channel
    • Market Attractiveness Analysis
      • By Country
      • By Source
      • By Nature
      • By End-Use
      • By Application
      • By Distribution Channel
    • Key Takeaways
  18. Middle East and Africa Market Analysis 2020 to 2024 and Forecast 2025 to 2035, By Country
    • Historical Market Size Value (USD Million) & Million Units Trend Analysis By Market Taxonomy, 2020 to 2024
    • Market Size Value (USD Million) & Million Units Forecast By Market Taxonomy, 2025 to 2035
      • By Country
        • GCC Countries
        • Northern Africa
        • South Africa
        • Turkiye
        • Rest of MEA
      • By Source
      • By Nature
      • By End-Use
      • By Application
      • By Distribution Channel
    • Market Attractiveness Analysis
      • By Country
      • By Source
      • By Nature
      • By End-Use
      • By Application
      • By Distribution Channel
    • Key Takeaways
  19. Key Countries Market Analysis
    • USA
      • Pricing Analysis
      • Market Share Analysis, 2024
        • By Source
        • By Nature
        • By End-Use
        • By Application
        • By Distribution Channel
    • Canada
      • Pricing Analysis
      • Market Share Analysis, 2024
        • By Source
        • By Nature
        • By End-Use
        • By Application
        • By Distribution Channel
    • Brazil
      • Pricing Analysis
      • Market Share Analysis, 2024
        • By Source
        • By Nature
        • By End-Use
        • By Application
        • By Distribution Channel
    • Mexico
      • Pricing Analysis
      • Market Share Analysis, 2024
        • By Source
        • By Nature
        • By End-Use
        • By Application
        • By Distribution Channel
    • Argentina
      • Pricing Analysis
      • Market Share Analysis, 2024
        • By Source
        • By Nature
        • By End-Use
        • By Application
        • By Distribution Channel
  20. Market Structure Analysis
    • Competition Dashboard
    • Competition Benchmarking
    • Market Share Analysis of Top Players
      • By Regional
      • By Source
      • By Nature
      • By End-Use
      • By Application
      • By Distribution Channel
  21. Competition Analysis
    • Competition Deep Dive
      • Archer Daniels Midland Company (ADM)
        • Overview
        • Product Portfolio
        • Profitability by Market Segments (Product/Age /Sales Channel/Region)
        • Sales Footprint
        • Strategy Overview
          • Marketing Strategy
          • Product Strategy
          • Channel Strategy
      • Cargill Inc.
        • Overview
        • Product Portfolio
        • Profitability by Market Segments (Product/Age /Sales Channel/Region)
        • Sales Footprint
        • Strategy Overview
          • Marketing Strategy
          • Product Strategy
          • Channel Strategy
      • DuPont de Nemours, Inc.
        • Overview
        • Product Portfolio
        • Profitability by Market Segments (Product/Age /Sales Channel/Region)
        • Sales Footprint
        • Strategy Overview
          • Marketing Strategy
          • Product Strategy
          • Channel Strategy
      • ADM (Archer Daniels Midland Company)
        • Overview
        • Product Portfolio
        • Profitability by Market Segments (Product/Age /Sales Channel/Region)
        • Sales Footprint
        • Strategy Overview
          • Marketing Strategy
          • Product Strategy
          • Channel Strategy
      • Corbion N.V.
        • Overview
        • Product Portfolio
        • Profitability by Market Segments (Product/Age /Sales Channel/Region)
        • Sales Footprint
        • Strategy Overview
          • Marketing Strategy
          • Product Strategy
          • Channel Strategy
      • Kerry Group plc
        • Overview
        • Product Portfolio
        • Profitability by Market Segments (Product/Age /Sales Channel/Region)
        • Sales Footprint
        • Strategy Overview
          • Marketing Strategy
          • Product Strategy
          • Channel Strategy
      • Puratos Group
        • Overview
        • Product Portfolio
        • Profitability by Market Segments (Product/Age /Sales Channel/Region)
        • Sales Footprint
        • Strategy Overview
          • Marketing Strategy
          • Product Strategy
          • Channel Strategy
      • DSM-Firmenich
        • Overview
        • Product Portfolio
        • Profitability by Market Segments (Product/Age /Sales Channel/Region)
        • Sales Footprint
        • Strategy Overview
          • Marketing Strategy
          • Product Strategy
          • Channel Strategy
      • Palsgaard A/S
        • Overview
        • Product Portfolio
        • Profitability by Market Segments (Product/Age /Sales Channel/Region)
        • Sales Footprint
        • Strategy Overview
          • Marketing Strategy
          • Product Strategy
          • Channel Strategy
      • Lasenor Emul S.L.
        • Overview
        • Product Portfolio
        • Profitability by Market Segments (Product/Age /Sales Channel/Region)
        • Sales Footprint
        • Strategy Overview
          • Marketing Strategy
          • Product Strategy
          • Channel Strategy
      • Bakels Group
        • Overview
        • Product Portfolio
        • Profitability by Market Segments (Product/Age /Sales Channel/Region)
        • Sales Footprint
        • Strategy Overview
          • Marketing Strategy
          • Product Strategy
          • Channel Strategy
      • Others
        • Overview
        • Product Portfolio
        • Profitability by Market Segments (Product/Age /Sales Channel/Region)
        • Sales Footprint
        • Strategy Overview
          • Marketing Strategy
          • Product Strategy
          • Channel Strategy
  22. Assumptions & Acronyms Used
  23. Research Methodology

List of Tables

  • Table 1: Global Market Value (USD Million) Forecast by Region, 2020-2035
  • Table 2: Global Market Million Units Forecast by Region, 2020-2035
  • Table 3: Global Market Value (USD Million) Forecast by Source, 2020-2035
  • Table 4: Global Market Million Units Forecast by Source, 2020-2035
  • Table 5: Global Market Value (USD Million) Forecast by Nature, 2020-2035
  • Table 6: Global Market Million Units Forecast by Nature, 2020-2035
  • Table 7: Global Market Value (USD Million) Forecast by End-Use, 2020-2035
  • Table 8: Global Market Million Units Forecast by End-Use, 2020-2035
  • Table 9: Global Market Value (USD Million) Forecast by Application, 2020-2035
  • Table 10: Global Market Million Units Forecast by Application, 2020-2035
  • Table 11: Global Market Value (USD Million) Forecast by Distribution Channel, 2020-2035
  • Table 12: Global Market Million Units Forecast by Distribution Channel, 2020-2035
  • Table 13: North America Market Value (USD Million) Forecast by Country, 2020-2035
  • Table 14: North America Market Million Units Forecast by Country, 2020-2035
  • Table 15: North America Market Value (USD Million) Forecast by Source, 2020-2035
  • Table 16: North America Market Million Units Forecast by Source, 2020-2035
  • Table 17: North America Market Value (USD Million) Forecast by Nature, 2020-2035
  • Table 18: North America Market Million Units Forecast by Nature, 2020-2035
  • Table 19: North America Market Value (USD Million) Forecast by End-Use, 2020-2035
  • Table 20: North America Market Million Units Forecast by End-Use, 2020-2035
  • Table 21: North America Market Value (USD Million) Forecast by Application, 2020-2035
  • Table 22: North America Market Million Units Forecast by Application, 2020-2035
  • Table 23: North America Market Value (USD Million) Forecast by Distribution Channel, 2020-2035
  • Table 24: North America Market Million Units Forecast by Distribution Channel, 2020-2035
  • Table 25: Latin America Market Value (USD Million) Forecast by Country, 2020-2035
  • Table 26: Latin America Market Million Units Forecast by Country, 2020-2035
  • Table 27: Latin America Market Value (USD Million) Forecast by Source, 2020-2035
  • Table 28: Latin America Market Million Units Forecast by Source, 2020-2035
  • Table 29: Latin America Market Value (USD Million) Forecast by Nature, 2020-2035
  • Table 30: Latin America Market Million Units Forecast by Nature, 2020-2035
  • Table 31: Latin America Market Value (USD Million) Forecast by End-Use, 2020-2035
  • Table 32: Latin America Market Million Units Forecast by End-Use, 2020-2035
  • Table 33: Latin America Market Value (USD Million) Forecast by Application, 2020-2035
  • Table 34: Latin America Market Million Units Forecast by Application, 2020-2035
  • Table 35: Latin America Market Value (USD Million) Forecast by Distribution Channel, 2020-2035
  • Table 36: Latin America Market Million Units Forecast by Distribution Channel, 2020-2035
  • Table 37: Western Europe Market Value (USD Million) Forecast by Country, 2020-2035
  • Table 38: Western Europe Market Million Units Forecast by Country, 2020-2035
  • Table 39: Western Europe Market Value (USD Million) Forecast by Source, 2020-2035
  • Table 40: Western Europe Market Million Units Forecast by Source, 2020-2035
  • Table 41: Western Europe Market Value (USD Million) Forecast by Nature, 2020-2035
  • Table 42: Western Europe Market Million Units Forecast by Nature, 2020-2035
  • Table 43: Western Europe Market Value (USD Million) Forecast by End-Use, 2020-2035
  • Table 44: Western Europe Market Million Units Forecast by End-Use, 2020-2035
  • Table 45: Western Europe Market Value (USD Million) Forecast by Application, 2020-2035
  • Table 46: Western Europe Market Million Units Forecast by Application, 2020-2035
  • Table 47: Western Europe Market Value (USD Million) Forecast by Distribution Channel, 2020-2035
  • Table 48: Western Europe Market Million Units Forecast by Distribution Channel, 2020-2035
  • Table 49: Eastern Europe Market Value (USD Million) Forecast by Country, 2020-2035
  • Table 50: Eastern Europe Market Million Units Forecast by Country, 2020-2035
  • Table 51: Eastern Europe Market Value (USD Million) Forecast by Source, 2020-2035
  • Table 52: Eastern Europe Market Million Units Forecast by Source, 2020-2035
  • Table 53: Eastern Europe Market Value (USD Million) Forecast by Nature, 2020-2035
  • Table 54: Eastern Europe Market Million Units Forecast by Nature, 2020-2035
  • Table 55: Eastern Europe Market Value (USD Million) Forecast by End-Use, 2020-2035
  • Table 56: Eastern Europe Market Million Units Forecast by End-Use, 2020-2035
  • Table 57: Eastern Europe Market Value (USD Million) Forecast by Application, 2020-2035
  • Table 58: Eastern Europe Market Million Units Forecast by Application, 2020-2035
  • Table 59: Eastern Europe Market Value (USD Million) Forecast by Distribution Channel, 2020-2035
  • Table 60: Eastern Europe Market Million Units Forecast by Distribution Channel, 2020-2035
  • Table 61: East Asia Market Value (USD Million) Forecast by Country, 2020-2035
  • Table 62: East Asia Market Million Units Forecast by Country, 2020-2035
  • Table 63: East Asia Market Value (USD Million) Forecast by Source, 2020-2035
  • Table 64: East Asia Market Million Units Forecast by Source, 2020-2035
  • Table 65: East Asia Market Value (USD Million) Forecast by Nature, 2020-2035
  • Table 66: East Asia Market Million Units Forecast by Nature, 2020-2035
  • Table 67: East Asia Market Value (USD Million) Forecast by End-Use, 2020-2035
  • Table 68: East Asia Market Million Units Forecast by End-Use, 2020-2035
  • Table 69: East Asia Market Value (USD Million) Forecast by Application, 2020-2035
  • Table 70: East Asia Market Million Units Forecast by Application, 2020-2035
  • Table 71: East Asia Market Value (USD Million) Forecast by Distribution Channel, 2020-2035
  • Table 72: East Asia Market Million Units Forecast by Distribution Channel, 2020-2035
  • Table 73: South Asia & Pacific Market Value (USD Million) Forecast by Country, 2020-2035
  • Table 74: South Asia & Pacific Market Million Units Forecast by Country, 2020-2035
  • Table 75: South Asia & Pacific Market Value (USD Million) Forecast by Source, 2020-2035
  • Table 76: South Asia & Pacific Market Million Units Forecast by Source, 2020-2035
  • Table 77: South Asia & Pacific Market Value (USD Million) Forecast by Nature, 2020-2035
  • Table 78: South Asia & Pacific Market Million Units Forecast by Nature, 2020-2035
  • Table 79: South Asia & Pacific Market Value (USD Million) Forecast by End-Use, 2020-2035
  • Table 80: South Asia & Pacific Market Million Units Forecast by End-Use, 2020-2035
  • Table 81: South Asia & Pacific Market Value (USD Million) Forecast by Application, 2020-2035
  • Table 82: South Asia & Pacific Market Million Units Forecast by Application, 2020-2035
  • Table 83: South Asia & Pacific Market Value (USD Million) Forecast by Distribution Channel, 2020-2035
  • Table 84: South Asia & Pacific Market Million Units Forecast by Distribution Channel, 2020-2035
  • Table 85: Middle East and Africa Market Value (USD Million) Forecast by Country, 2020-2035
  • Table 86: Middle East and Africa Market Million Units Forecast by Country, 2020-2035
  • Table 87: Middle East and Africa Market Value (USD Million) Forecast by Source, 2020-2035
  • Table 88: Middle East and Africa Market Million Units Forecast by Source, 2020-2035
  • Table 89: Middle East and Africa Market Value (USD Million) Forecast by Nature, 2020-2035
  • Table 90: Middle East and Africa Market Million Units Forecast by Nature, 2020-2035
  • Table 91: Middle East and Africa Market Value (USD Million) Forecast by End-Use, 2020-2035
  • Table 92: Middle East and Africa Market Million Units Forecast by End-Use, 2020-2035
  • Table 93: Middle East and Africa Market Value (USD Million) Forecast by Application, 2020-2035
  • Table 94: Middle East and Africa Market Million Units Forecast by Application, 2020-2035
  • Table 95: Middle East and Africa Market Value (USD Million) Forecast by Distribution Channel, 2020-2035
  • Table 96: Middle East and Africa Market Million Units Forecast by Distribution Channel, 2020-2035

List of Figures

  • Figure 1: Global Market Million Units Forecast 2020-2035
  • Figure 2: Global Market Pricing Analysis
  • Figure 3: Global Market Value (USD Million) Forecast 2020-2035
  • Figure 4: Global Market Value Share and BPS Analysis by Source, 2025 and 2035
  • Figure 5: Global Market Y-o-Y Growth Comparison by Source, 2025-2035
  • Figure 6: Global Market Attractiveness Analysis by Source
  • Figure 7: Global Market Value Share and BPS Analysis by Nature, 2025 and 2035
  • Figure 8: Global Market Y-o-Y Growth Comparison by Nature, 2025-2035
  • Figure 9: Global Market Attractiveness Analysis by Nature
  • Figure 10: Global Market Value Share and BPS Analysis by End-Use, 2025 and 2035
  • Figure 11: Global Market Y-o-Y Growth Comparison by End-Use, 2025-2035
  • Figure 12: Global Market Attractiveness Analysis by End-Use
  • Figure 13: Global Market Value Share and BPS Analysis by Application, 2025 and 2035
  • Figure 14: Global Market Y-o-Y Growth Comparison by Application, 2025-2035
  • Figure 15: Global Market Attractiveness Analysis by Application
  • Figure 16: Global Market Value Share and BPS Analysis by Distribution Channel, 2025 and 2035
  • Figure 17: Global Market Y-o-Y Growth Comparison by Distribution Channel, 2025-2035
  • Figure 18: Global Market Attractiveness Analysis by Distribution Channel
  • Figure 19: Global Market Value (USD Million) Share and BPS Analysis by Region, 2025 and 2035
  • Figure 20: Global Market Y-o-Y Growth Comparison by Region, 2025-2035
  • Figure 21: Global Market Attractiveness Analysis by Region
  • Figure 22: North America Market Incremental $ Opportunity, 2025-2035
  • Figure 23: Latin America Market Incremental $ Opportunity, 2025-2035
  • Figure 24: Western Europe Market Incremental $ Opportunity, 2025-2035
  • Figure 25: Eastern Europe Market Incremental $ Opportunity, 2025-2035
  • Figure 26: East Asia Market Incremental $ Opportunity, 2025-2035
  • Figure 27: South Asia & Pacific Market Incremental $ Opportunity, 2025-2035
  • Figure 28: Middle East and Africa Market Incremental $ Opportunity, 2025-2035
  • Figure 29: North America Market Value Share and BPS Analysis by Country, 2025 and 2035
  • Figure 30: North America Market Value Share and BPS Analysis by Source, 2025 and 2035
  • Figure 31: North America Market Y-o-Y Growth Comparison by Source, 2025-2035
  • Figure 32: North America Market Attractiveness Analysis by Source
  • Figure 33: North America Market Value Share and BPS Analysis by Nature, 2025 and 2035
  • Figure 34: North America Market Y-o-Y Growth Comparison by Nature, 2025-2035
  • Figure 35: North America Market Attractiveness Analysis by Nature
  • Figure 36: North America Market Value Share and BPS Analysis by End-Use, 2025 and 2035
  • Figure 37: North America Market Y-o-Y Growth Comparison by End-Use, 2025-2035
  • Figure 38: North America Market Attractiveness Analysis by End-Use
  • Figure 39: North America Market Value Share and BPS Analysis by Application, 2025 and 2035
  • Figure 40: North America Market Y-o-Y Growth Comparison by Application, 2025-2035
  • Figure 41: North America Market Attractiveness Analysis by Application
  • Figure 42: North America Market Value Share and BPS Analysis by Distribution Channel, 2025 and 2035
  • Figure 43: North America Market Y-o-Y Growth Comparison by Distribution Channel, 2025-2035
  • Figure 44: North America Market Attractiveness Analysis by Distribution Channel
  • Figure 45: Latin America Market Value Share and BPS Analysis by Country, 2025 and 2035
  • Figure 46: Latin America Market Value Share and BPS Analysis by Source, 2025 and 2035
  • Figure 47: Latin America Market Y-o-Y Growth Comparison by Source, 2025-2035
  • Figure 48: Latin America Market Attractiveness Analysis by Source
  • Figure 49: Latin America Market Value Share and BPS Analysis by Nature, 2025 and 2035
  • Figure 50: Latin America Market Y-o-Y Growth Comparison by Nature, 2025-2035
  • Figure 51: Latin America Market Attractiveness Analysis by Nature
  • Figure 52: Latin America Market Value Share and BPS Analysis by End-Use, 2025 and 2035
  • Figure 53: Latin America Market Y-o-Y Growth Comparison by End-Use, 2025-2035
  • Figure 54: Latin America Market Attractiveness Analysis by End-Use
  • Figure 55: Latin America Market Value Share and BPS Analysis by Application, 2025 and 2035
  • Figure 56: Latin America Market Y-o-Y Growth Comparison by Application, 2025-2035
  • Figure 57: Latin America Market Attractiveness Analysis by Application
  • Figure 58: Latin America Market Value Share and BPS Analysis by Distribution Channel, 2025 and 2035
  • Figure 59: Latin America Market Y-o-Y Growth Comparison by Distribution Channel, 2025-2035
  • Figure 60: Latin America Market Attractiveness Analysis by Distribution Channel
  • Figure 61: Western Europe Market Value Share and BPS Analysis by Country, 2025 and 2035
  • Figure 62: Western Europe Market Value Share and BPS Analysis by Source, 2025 and 2035
  • Figure 63: Western Europe Market Y-o-Y Growth Comparison by Source, 2025-2035
  • Figure 64: Western Europe Market Attractiveness Analysis by Source
  • Figure 65: Western Europe Market Value Share and BPS Analysis by Nature, 2025 and 2035
  • Figure 66: Western Europe Market Y-o-Y Growth Comparison by Nature, 2025-2035
  • Figure 67: Western Europe Market Attractiveness Analysis by Nature
  • Figure 68: Western Europe Market Value Share and BPS Analysis by End-Use, 2025 and 2035
  • Figure 69: Western Europe Market Y-o-Y Growth Comparison by End-Use, 2025-2035
  • Figure 70: Western Europe Market Attractiveness Analysis by End-Use
  • Figure 71: Western Europe Market Value Share and BPS Analysis by Application, 2025 and 2035
  • Figure 72: Western Europe Market Y-o-Y Growth Comparison by Application, 2025-2035
  • Figure 73: Western Europe Market Attractiveness Analysis by Application
  • Figure 74: Western Europe Market Value Share and BPS Analysis by Distribution Channel, 2025 and 2035
  • Figure 75: Western Europe Market Y-o-Y Growth Comparison by Distribution Channel, 2025-2035
  • Figure 76: Western Europe Market Attractiveness Analysis by Distribution Channel
  • Figure 77: Eastern Europe Market Value Share and BPS Analysis by Country, 2025 and 2035
  • Figure 78: Eastern Europe Market Value Share and BPS Analysis by Source, 2025 and 2035
  • Figure 79: Eastern Europe Market Y-o-Y Growth Comparison by Source, 2025-2035
  • Figure 80: Eastern Europe Market Attractiveness Analysis by Source
  • Figure 81: Eastern Europe Market Value Share and BPS Analysis by Nature, 2025 and 2035
  • Figure 82: Eastern Europe Market Y-o-Y Growth Comparison by Nature, 2025-2035
  • Figure 83: Eastern Europe Market Attractiveness Analysis by Nature
  • Figure 84: Eastern Europe Market Value Share and BPS Analysis by End-Use, 2025 and 2035
  • Figure 85: Eastern Europe Market Y-o-Y Growth Comparison by End-Use, 2025-2035
  • Figure 86: Eastern Europe Market Attractiveness Analysis by End-Use
  • Figure 87: Eastern Europe Market Value Share and BPS Analysis by Application, 2025 and 2035
  • Figure 88: Eastern Europe Market Y-o-Y Growth Comparison by Application, 2025-2035
  • Figure 89: Eastern Europe Market Attractiveness Analysis by Application
  • Figure 90: Eastern Europe Market Value Share and BPS Analysis by Distribution Channel, 2025 and 2035
  • Figure 91: Eastern Europe Market Y-o-Y Growth Comparison by Distribution Channel, 2025-2035
  • Figure 92: Eastern Europe Market Attractiveness Analysis by Distribution Channel
  • Figure 93: East Asia Market Value Share and BPS Analysis by Country, 2025 and 2035
  • Figure 94: East Asia Market Value Share and BPS Analysis by Source, 2025 and 2035
  • Figure 95: East Asia Market Y-o-Y Growth Comparison by Source, 2025-2035
  • Figure 96: East Asia Market Attractiveness Analysis by Source
  • Figure 97: East Asia Market Value Share and BPS Analysis by Nature, 2025 and 2035
  • Figure 98: East Asia Market Y-o-Y Growth Comparison by Nature, 2025-2035
  • Figure 99: East Asia Market Attractiveness Analysis by Nature
  • Figure 100: East Asia Market Value Share and BPS Analysis by End-Use, 2025 and 2035
  • Figure 101: East Asia Market Y-o-Y Growth Comparison by End-Use, 2025-2035
  • Figure 102: East Asia Market Attractiveness Analysis by End-Use
  • Figure 103: East Asia Market Value Share and BPS Analysis by Application, 2025 and 2035
  • Figure 104: East Asia Market Y-o-Y Growth Comparison by Application, 2025-2035
  • Figure 105: East Asia Market Attractiveness Analysis by Application
  • Figure 106: East Asia Market Value Share and BPS Analysis by Distribution Channel, 2025 and 2035
  • Figure 107: East Asia Market Y-o-Y Growth Comparison by Distribution Channel, 2025-2035
  • Figure 108: East Asia Market Attractiveness Analysis by Distribution Channel
  • Figure 109: South Asia & Pacific Market Value Share and BPS Analysis by Country, 2025 and 2035
  • Figure 110: South Asia & Pacific Market Value Share and BPS Analysis by Source, 2025 and 2035
  • Figure 111: South Asia & Pacific Market Y-o-Y Growth Comparison by Source, 2025-2035
  • Figure 112: South Asia & Pacific Market Attractiveness Analysis by Source
  • Figure 113: South Asia & Pacific Market Value Share and BPS Analysis by Nature, 2025 and 2035
  • Figure 114: South Asia & Pacific Market Y-o-Y Growth Comparison by Nature, 2025-2035
  • Figure 115: South Asia & Pacific Market Attractiveness Analysis by Nature
  • Figure 116: South Asia & Pacific Market Value Share and BPS Analysis by End-Use, 2025 and 2035
  • Figure 117: South Asia & Pacific Market Y-o-Y Growth Comparison by End-Use, 2025-2035
  • Figure 118: South Asia & Pacific Market Attractiveness Analysis by End-Use
  • Figure 119: South Asia & Pacific Market Value Share and BPS Analysis by Application, 2025 and 2035
  • Figure 120: South Asia & Pacific Market Y-o-Y Growth Comparison by Application, 2025-2035
  • Figure 121: South Asia & Pacific Market Attractiveness Analysis by Application
  • Figure 122: South Asia & Pacific Market Value Share and BPS Analysis by Distribution Channel, 2025 and 2035
  • Figure 123: South Asia & Pacific Market Y-o-Y Growth Comparison by Distribution Channel, 2025-2035
  • Figure 124: South Asia & Pacific Market Attractiveness Analysis by Distribution Channel
  • Figure 125: Middle East and Africa Market Value Share and BPS Analysis by Country, 2025 and 2035
  • Figure 126: Middle East and Africa Market Value Share and BPS Analysis by Source, 2025 and 2035
  • Figure 127: Middle East and Africa Market Y-o-Y Growth Comparison by Source, 2025-2035
  • Figure 128: Middle East and Africa Market Attractiveness Analysis by Source
  • Figure 129: Middle East and Africa Market Value Share and BPS Analysis by Nature, 2025 and 2035
  • Figure 130: Middle East and Africa Market Y-o-Y Growth Comparison by Nature, 2025-2035
  • Figure 131: Middle East and Africa Market Attractiveness Analysis by Nature
  • Figure 132: Middle East and Africa Market Value Share and BPS Analysis by End-Use, 2025 and 2035
  • Figure 133: Middle East and Africa Market Y-o-Y Growth Comparison by End-Use, 2025-2035
  • Figure 134: Middle East and Africa Market Attractiveness Analysis by End-Use
  • Figure 135: Middle East and Africa Market Value Share and BPS Analysis by Application, 2025 and 2035
  • Figure 136: Middle East and Africa Market Y-o-Y Growth Comparison by Application, 2025-2035
  • Figure 137: Middle East and Africa Market Attractiveness Analysis by Application
  • Figure 138: Middle East and Africa Market Value Share and BPS Analysis by Distribution Channel, 2025 and 2035
  • Figure 139: Middle East and Africa Market Y-o-Y Growth Comparison by Distribution Channel, 2025-2035
  • Figure 140: Middle East and Africa Market Attractiveness Analysis by Distribution Channel
  • Figure 141: Global Market - Tier Structure Analysis
  • Figure 142: Global Market - Company Share Analysis

Frequently Asked Questions

What is the projected market value of the bakery emulsions market in 2025?

The projected valuation of the industry in 2025 is USD 460.5 million.

What is the forecast market value of the bakery emulsions market by 2035?

The forecast valuation of the industry by 2035 is USD 870.2 million.

What is the expected CAGR for the bakery emulsions market from 2025 to 2035?

The expected CAGR for the industry from 2025 to 2035 is 6.4%.

Which segment will lead the bakery emulsions market in 2035?

The industrial end-use segment will lead the bakery emulsions market in 2035, with a 65% share.

Which country is expected to experience the highest growth in the bakery emulsions market?

India is expected to experience the highest growth, with a 6.8% CAGR.

Explore Similar Insights

Future Market Insights

Bakery Emulsions Market