Bakery Enzymes Market Size, Share, and Forecast Outlook 2025 to 2035

The bakery enzymes market is projected to grow from USD 903.0 million in 2025 to USD 1,861.1 million by 2035, registering a CAGR of 7.5% during the forecast period. Expansion is sustained by industrial demand for dependable dough conditioning, uniform rise, and longer ambient shelf life.
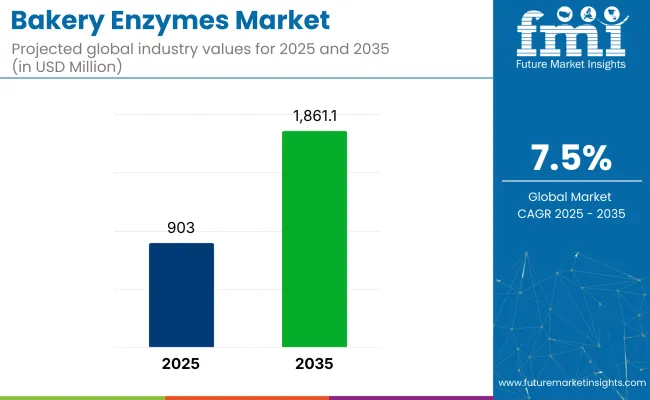
Quick Stats for Bakery Enzymes Market

  • Market Value (2025): USD 903.0 million
  • Forecast Value (2035): USD 1,861.1 million
  • Forecast CAGR (2025 to 2035): 7.5%
  • Leading Segment in 2035: Carbohydrase (45% share)
  • Key Growth Region: Asia Pacific
  • Leading Country: China (8.1% CAGR)
  • Key Players: Novozymes A/S, DSM, DuPont, Kerry Group, AB Enzymes, Puratos Group, Advanced Enzyme Technologies, Amano Enzyme Inc., Chr. Hansen, Royal DSM, Others

Baking Enzymes Market

Attributes Description
Estimated Global Industry Size (2025E) USD 903.0 million
Projected Global Value (2035F) USD 1,861.1 million
Value-based CAGR (2025 to 2035) 7.5%

In the United States, commercial pan-bread producers raised enzyme inclusion by 28% between 2020 and 2024 to trim batch-to-batch variance and cut crumb staling claims. Pretzel and cookie facilities using inline liquid-dosing systems report a 9% reduction in mixed-dough waste.

Across Asia Pacific, millers and high-output bakeries are digitising fermentation control and starch-conversion profiles. China’s three largest instant-noodle bun plants installed cloud-linked carbohydrase stations in 2024, cutting proofing time by up to seven minutes per batch.

Regional enzyme sales surpassed USD 310 million in 2023, expanding at 11% CAGR as plant-based bakery categories scale. In Western Europe, clean-label mandates prompted multiphase lipase and protease usage to replace mono- and diglycerides; Austria’s cooperative mills showed a 12% fall in crumb-softener additives after switching to enzyme blends that meet the updated EU additives list.

Investment confidence is visible in new R&D hubs. Novozymes opened a precision-fermentation pilot in North Carolina in early 2025, targeting rapid strain development for high-temperature dough lines. Meanwhile, India’s Advanced Enzyme Technologies launched a cloud-monitored fermentation tank cluster, boosting output flexibility for regional sachet packers.

Liquid formulations now account for nearly half of global shipments as automated metering valves standardise activity per kilo of flour. Constant launches and development keeps the industry active. In October 2024, AB Enzymes launched VERON® POLARUM, an enzyme solution tailored for strengthening butter-containing bakery applications. This addition to their VERON® range is designed to enhance the quality and consistency of butter-rich products.

The bakery enzymes market holds a specific share within its parent markets. In the food enzyme market, it holds around 12-15%, as enzymes used in baking are a significant segment within the broader enzyme category. Within the baking ingredients market, the share is approximately 10-12%, driven by the role of enzymes in improving dough and bread quality.

The food and beverage market contributes about 3-5%, and enzymes are mostly applied in bakery products. The food processing market sees a share of 6-8%, as enzymes improve the processing efficiency and product quality in bakery production. The functional foods market holds a smaller share of 2-3%, with enzymes often included in health-focused bakery products.

Analysis of Bakery Enzymes Market by Top Investment Segments

Bakery enzyme demand in 2025 is anchored by carbohydrase formulations, bread applications, liquid enzyme delivery, and microbial production methods. Investment decisions are shaped by production efficiency, label compliance, dough processing tolerance, and moisture retention in mass bakery formats.

Carbohydrase Activity Improves Dough Tolerance and Freshness

A 45% share has been accounted for by carbohydrase in 2025, driven by its role in enhancing dough extensibility, texture consistency, and crumb softness over time. These enzymes are important in industrial setups focused on high-speed production and reduced staling rates.
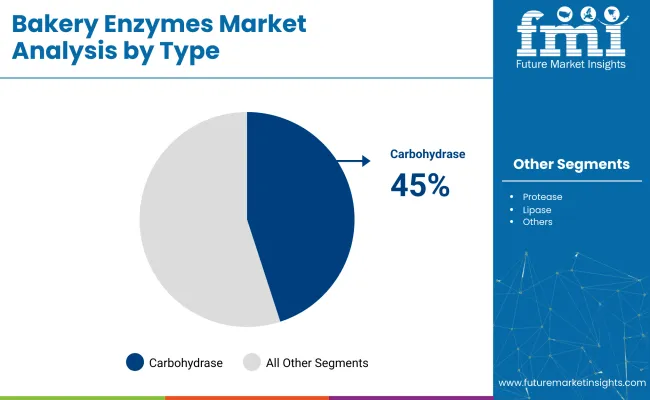
  • Maltogenic amylase extends softness for up to seven days in ambient packaged bread.
  • Hemicellulase aids in water absorption, raising dough hydration levels without structural collapse.
  • Fungal alpha-amylase optimizes sugar release to balance yeast activity during proofing.
  • Bread volume improvement has been tied to more efficient starch breakdown in batch fermentation systems.
  • Carbohydrase blends reduce gum dependency in clean-label formats, aiding E-number reduction initiatives.

Baking Enzymes Market Analysis By Type

Bread Manufacturing Accounts for Primary Enzyme Utilization

A 40% share has been held by bread applications in 2025, owing to their requirement for precise shelf-life extension, shape retention, and oven spring in fast-cycle commercial baking environments. Enzymes replace traditional improvers, enabling simpler labelling and better crumb texture.
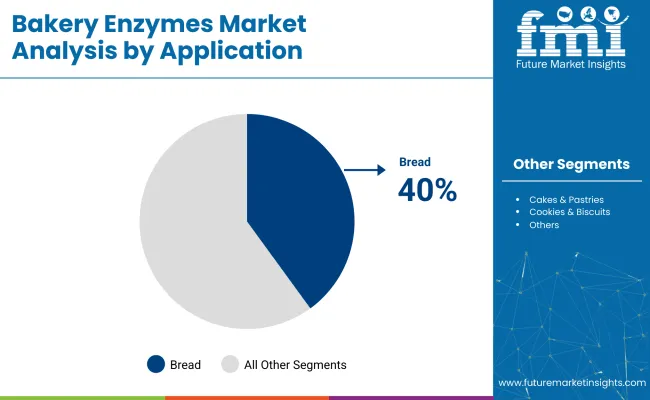
  • Crumb firmness is reduced by up to 30% using targeted enzyme complexes.
  • Dough handling consistency is improved through proteolytic synergy during kneading.
  • Vacuum cooling efficiency rises when enzyme-aided structure firms earlier in the bake.
  • Sliced bread integrity improves during packaging due to reinforced crumb-cell elasticity.
  • Formulation stability in frozen dough is enhanced through starch-hydrolyzing pre-blends.

Baking Enzymes Market Analysis By Application

Liquid Enzymes Facilitate Precise Inclusion in Continuous Mixing

The liquid form hold 37% share In 2025. Liquid enzymes have a good flow control, minimal dust risk, and can be integrated into automated metering systems in industrial bakeries. Their use enables consistent dispersion during scaling and minor ingredient addition stages.

  • Liquid format supports in-line injection with no pre-blending required.
  • Carrier systems such as glycerol and sorbitol maintain enzymatic stability during transit.
  • Dust-free handling lowers inhalation risks, meeting industrial hygiene targets.
  • Thermal stability of liquid formats improves retention during pre-proof holding.
  • Equipment compatibility increases with reduced sedimentation inside supply lines and feed tanks.

Microbial Production Enables Clean-Label and Scalable Sourcing

A dominant share of 42% has been held by microbial enzyme sources, reflecting industry preference for label transparency, dietary compatibility, and predictable production yields through fermentation. These enzymes support non-allergenic, animal-free, and scalable formulations used in all bakery segments.

  • Aspergillus and Bacillus strains are cultured under GRAS-compliant fermentation conditions.
  • Fermentation-derived enzymes qualify for vegan, kosher, and halal certifications.
  • Ultra-filtration removes microbial biomass residues, supporting food-grade enzyme clarity.
  • Microbial strains allow year-round supply without agricultural sourcing dependency.
  • Lyophilized microbial enzyme powders preserve ≥95% activity without refrigeration over long storage cycles.

Top Bakery Enzymes Market Dynamics

Tighter acrylamide thresholds and stricter clean-label scrutiny are shifting bakery enzyme applications. Procurement and R&D teams are prioritizing functional blends that meet both regulatory compliance and front-label acceptance in export regions.

Acrylamide Controls Propel Precision Enzyme Adoption

Revisions to acrylamide benchmarks under EU Regulation 2017/2158 have pushed bakeries to adopt targeted enzyme strategies. Asparaginase and glucose oxidase are being introduced to reduce free asparagine and lower bake temperatures. Procurement teams now require batch-level acrylamide testing before shipment. Mills lacking enzyme integration face rejection from EU-bound contracts. Pressure is rising to replace legacy processing aids with enzymatic alternatives that deliver equivalent output while meeting compliance documentation.

  • Acrylamide levels below 300 ppb must be verified for export-ready shipments.
  • Enzyme kits are bundled with analytical protocols to validate in-line reduction rates.
  • Non-compliant batches face rejection or retail delisting across regulated jurisdictions.

Clean-label Claims Driving Functional Enzyme Formulations

Retailers in the USA, EU, and Japan are phasing out tolerance for chemical conditioners. Functional enzymes-lipase, maltogenic amylase, hemicellulase-are being preferred for softness and volume control. “No E-number” policies in private-label contracts are forcing formulators to replace DATEM and mono-diglycerides. Enzyme suppliers are now offering custom blends that allow clean-label declarations without compromising performance. Frozen dough exporters are adopting these blends to meet buyer scorecards linked to label transparency.
  • Ingredient lines must list enzyme systems generically without numeric codes.
  • Flour is being pre-fortified with enzyme complexes for bakery applications.
  • Enzyme-only formulas are meeting 7-day softness retention without emulsifier use.

Top Countries Producing, Distributing, and Formulating Bakery Enzymes

Baking Enzymes Market Country Wise Analysis

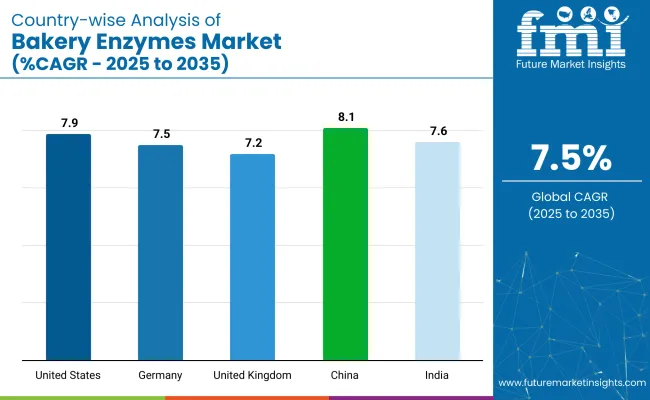
Country CAGR (2025 to 2035)
United States 7.9%
Germany 7.5%
United Kingdom 7.2%
China 8.1%
India 7.6%

In the United States, the bakery enzymes market is on track to grow at 7.9% CAGR, driven by FDA regulations and FSMA audits promoting enzyme-driven conditioners over chemical emulsifiers. State-level grants are accelerating enzyme adoption, especially in Illinois and Kansas, where bakeries are upgrading dough-processing lines.

Germany, growing at 7.5% CAGR, is seeing a shift toward enzyme-based solutions as part of the national strategy to reduce additives. The KfW Program is supporting local enzyme production, reducing dependency on imports and promoting high-purity granulated enzymes.

In ASEAN, India is expected to grow at 7.6% CAGR, fueled by FSSAI's additive amendments and PLI incentives, driving local enzyme manufacturing. China, within BRICS, is investing in microbial enzyme imports through Hainan Free Trade Port and offering subsidies for bakeries switching from chemical oxidizers. Enzyme adoption is gaining traction across all regions, with domestic production and clean-label requirements guiding reformulations and driving innovation in bakery formulations.

The report covers in-depth analysis of 40+ countries. The top five countries have been shared as a reference.

United States Bakery Enzymes Sales Growth Outlook

The bakery enzymes market in the United States is projected to advance at a CAGR of 7.9% from 2025 to 2035. FDA’s Food Enzyme Review Program demands pre-market evaluation of every amylase, protease, or xylanase deployed in bread. FSMA preventive-control audits encourage bakeries to replace chemical emulsifiers with enzyme-driven conditioners. Illinois and Kansas rebate equipment costs for plants installing enzymatic dough-processing lines.

  • FDA Food Enzyme Review mandates complete dossier submission and toxicology data before commercializing novel bakery enzyme blends
  • FSMA inspections favor enzyme-based dough conditioning systems that lower sodium stearoyl lactylate usage across industrial bakeries
  • Illinois Manufacturing Training Grant reimburses bakery operators adopting continuous mixers linked with inline enzyme dosing skids systems

Germany Bakery Enzymes Sales Expansion Path

The bakery enzymes market in Germany is projected to rise at a CAGR of 7.5% from 2025 to 2035. EU Regulation 1332/2008, implemented by the Federal Office of Consumer Protection, demands dossier approval before any bakery enzyme use. The national Reduction and Innovation Strategy incentivises bakers to cut additive emulsifiers, fuelling demand for combined amylase-xylanase solutions. KfW loans finance domestic microbial fermentation capacity.

  • EU enzyme approval list restricts maximal residual activity, pushing formulators toward substrate-specific immobilised enzyme systems in bakeries
  • Reduction and Innovation Strategy awards preference points in public procurement for bread lines showing enzyme-based emulsifier elimination
  • KfW Programme 203 finances bioreactor retrofits enabling local enzyme production that lowers reliance on imported concentrates today

United Kingdom Bakery Enzymes Future Outlook

The bakery enzymes market in the United Kingdom is forecast to grow at a CAGR of 7.2% from 2025 to 2035. Retained EU Regulation 1332/2008, enforced by the Food Standards Agency through the Regulated Products portal, requires safety dossiers before enzyme use. Innovate UK Transforming Food Production grants support thermostable amylase pilots lowering oven temperatures. DEFRA’s acrylamide code urges asparaginase adoption across large-scale bakeries.

  • Food Standards Agency evaluation timeframe averages eight months, encouraging early engagement by enzyme suppliers and bakery groups
  • Transforming Food Production funding stream offers fifty percent capital subsidies for low-temperature baking lines using thermostable enzymes
  • Acrylamide mitigation code lists enzyme treatment benchmarks that supermarkets enforce within private-label bread supplier contracts nationwide today

China Bakery Enzymes Industry Growth Trajectory

The bakery enzymes market in China is predicted to climb at a CAGR of 8.1% from 2025 to 2035. National Standard GB 2760 treats enzymes as processing aids, requiring toxicity dossiers with the National Health Commission. Tariff cuts on microbial enzyme imports via Hainan Free Trade Port bolster supply. Provincial subsidies under the ‘Staple Food Diversification’ plan reward bakeries replacing chemical oxidisers with glucose-oxidase.

  • GB 2760 annex tables set residue limits prompting bakery reformulations based on high-purity granulated enzyme preparations nationwide
  • Hainan Free Trade Port grants zero import duty on microbial fermentation starters used in domestic enzyme manufacture
  • Staple Food Diversification subsidies reimburse bakeries thirty percent of capital spent installing automated enzyme dosing hoppers today

Sales Outlook of India Bakery Enzymes Market

The bakery enzymes market in India is expected to register a CAGR of 7.6% from 2025 to 2035. FSSAI’s 2021 additive amendment set maximum residual limits for amylase and xylanase, prompting certified clean-label adoption. The Production-Linked Incentive scheme for fermentation-based biomanufacturing offers cashbacks on enzyme output. State Mega Food Parks in Maharashtra and Gujarat provide subsidised utilities for bakeries installing inline enzyme dispensers.

  • FSSAI additive schedule requires bakery enzyme declaration on labels, driving transparent sourcing across national bread brands today
  • PLI Biomanufacturing incentives reimburse five percent of incremental enzyme sales, encouraging capacity expansion among indigenous producers annually
  • Mega Food Park utilities lower steam and cooling costs for bakeries adopting continuous mixers with enzyme micro-dosing

Leading Suppliers

The bakery enzymes market is dominated by companies like Novozymes A/S, DSM, and DuPont, which lead through continuous innovation and extensive product portfolios. Novozymes A/S focuses on enzyme solutions that enhance dough processing and improve product quality, while DSM and DuPont leverage their strong R&D to offer diverse enzyme applications, from improving texture to increasing shelf life.

Kerry Group targets growth through regional partnerships and by providing tailored enzyme solutions. Smaller players such as AB Enzymes and Advanced Enzyme Technologies focus on specific market niches. The market is moderately fragmented, with global leaders maintaining a strong hold, but numerous regional and specialized companies offering innovative solutions to cater to varied consumer demands.

Recent Industry News

  • Novozymes introduced Novamyl® BestBite, an enzyme designed to improve the texture and shelf life of baked goods, aiming to reduce food waste and enhance product quality.
  • In April 2024, Kerry introduced Biobake™ Fibre, a novel enzyme solution designed to enhance dough processability and improve volume, softness, and sliceability in rye bread. This clean-label, organic-suitable enzyme also aims to reduce operational costs in rye bread production.

Key Players

  • Novozymes A/S
  • DSM
  • DuPont
  • Kerry Group
  • AB Enzymes
  • Puratos Group
  • Advanced Enzyme Technologies
  • Amano Enzyme Inc.
  • Chr. Hansen
  • Royal DSM
  • Others

Report Coverage and Scope Summary

Report Attributes Key Insights
Estimated Market Value (2025) USD 903.0 million
Projected Market Value (2035) USD 1,861.1 million
CAGR (2025 to 2035) 7.5%
Base Year for Estimation 2024
Historical Period 2020 to 2024
Forecast Period 2025 to 2035
Quantitative Units Revenue in USD million
Type Carbohydrase, Protease, Lipase, Others
Application Bread, Cakes & Pastries, Cookies & Biscuits, Others
Form Powder, Liquid
Source Microbial, Plant, Animal
Region North America, Latin America, Western Europe, Eastern Europe, Balkans & Baltic, Russia & Belarus, Central Asia, East Asia, South Asia & Pacific, Middle East & Africa
Countries Covered United States, Canada, Mexico, Brazil, Argentina, Germany, France, United Kingdom, Italy, Spain, Netherlands, China, India, Japan, South Korea, ANZ, GCC Countries, South Africa
Key Players Novozymes A/S, DSM, DuPont, Kerry Group, AB Enzymes, Puratos Group, Advanced Enzyme Technologies, Amano Enzyme Inc., Chr. Hansen, Royal DSM, Others
Additional Attributes Dollar sales, CAGR trends, type distribution, price range segmentation, competitor dollar sales & market share, regional growth patterns, consumer preferences, sales channel analysis

Key Segmentation

By Type:

The segmentation is into carbohydrase, protease, lipase, and others.

By Application:

The segmentation is into bread, cakes & pastries, cookies & biscuits, and others.

By Form:

The segmentation is into powder and liquid.

By Source:

The segmentation is into microbial, plant, and animal.

By Region:

The segmentation is into North America, Latin America, Western Europe, Eastern Europe, Balkans & Baltic, Russia & Belarus, Central Asia, East Asia, South Asia & Pacific, and the Middle East & Africa.

Table of Content

  1. Executive Summary
  2. Market Overview
  3. Market Background
  4. Global Market Analysis 2020 to 2024 and Forecast, 2025 to 2035
  5. Global Market Analysis 2020 to 2024 and Forecast 2025 to 2035, By Product Type
    • Carbohydrase
    • Protease
    • Lipase
    • Others
  6. Global Market Analysis 2020 to 2024 and Forecast 2025 to 2035, By Application
    • Bread
    • Cakes & Pastries
    • Cookies & Biscuits
  7. Global Market Analysis 2020 to 2024 and Forecast 2025 to 2035, By Form
    • Powder
    • Liquid
  8. Global Market Analysis 2020 to 2024 and Forecast 2025 to 2035, By Region
    • North America
    • Latin America
    • Western Europe
    • Eastern Europe
    • South Asia and Pacific
    • East Asia
    • Middle East and Africa
  9. North America Market Analysis 2020 to 2024 and Forecast 2025 to 2035, By Country
  10. Western Europe Market Analysis 2020 to 2024 and Forecast 2025 to 2035, By Country
  11. Eastern Europe Market Analysis 2020 to 2024 and Forecast 2025 to 2035, By Country
  12. South Asia and Pacific Market Analysis 2020 to 2024 and Forecast 2025 to 2035, By Country
  13. East Asia Market Analysis 2020 to 2024 and Forecast 2025 to 2035, By Country
  14. Middle East and Africa Market Analysis 2020 to 2024 and Forecast 2025 to 2035, By Country
  15. Key Countries Market Analysis
  16. Market Structure Analysis
  17. Competition Analysis
    • Novozymes A/S
    • AB Enzymes
    • DuPont de Nemours, Inc.
    • Koninklijke DSM N.V.
    • Amano Enzyme Inc.
    • Aum Enzymes
    • Infinita Biotech
    • VTR Biotech
    • IFF (International Flavors & Fragrances Inc.)
    • Univar Solutions
  18. Assumptions & Acronyms Used
  19. Research Methodology

List of Tables

  • Table 1: Global Market Value (USD Million) Forecast by Region, 2020-2035
  • Table 2: Global Market Million Units Forecast by Region, 2020-2035
  • Table 3: Global Market Value (USD Million) Forecast by Type, 2020-2035
  • Table 4: Global Market Million Units Forecast by Type, 2020-2035
  • Table 5: Global Market Value (USD Million) Forecast by Application, 2020-2035
  • Table 6: Global Market Million Units Forecast by Application, 2020-2035
  • Table 7: Global Market Value (USD Million) Forecast by Form, 2020-2035
  • Table 8: Global Market Million Units Forecast by Form, 2020-2035
  • Table 9: Global Market Value (USD Million) Forecast by Source, 2020-2035
  • Table 10: Global Market Million Units Forecast by Source, 2020-2035
  • Table 11: North America Market Value (USD Million) Forecast by Country, 2020-2035
  • Table 12: North America Market Million Units Forecast by Country, 2020-2035
  • Table 13: North America Market Value (USD Million) Forecast by Type, 2020-2035
  • Table 14: North America Market Million Units Forecast by Type, 2020-2035
  • Table 15: North America Market Value (USD Million) Forecast by Application, 2020-2035
  • Table 16: North America Market Million Units Forecast by Application, 2020-2035
  • Table 17: North America Market Value (USD Million) Forecast by Form, 2020-2035
  • Table 18: North America Market Million Units Forecast by Form, 2020-2035
  • Table 19: North America Market Value (USD Million) Forecast by Source, 2020-2035
  • Table 20: North America Market Million Units Forecast by Source, 2020-2035
  • Table 21: Latin America Market Value (USD Million) Forecast by Country, 2020-2035
  • Table 22: Latin America Market Million Units Forecast by Country, 2020-2035
  • Table 23: Latin America Market Value (USD Million) Forecast by Type, 2020-2035
  • Table 24: Latin America Market Million Units Forecast by Type, 2020-2035
  • Table 25: Latin America Market Value (USD Million) Forecast by Application, 2020-2035
  • Table 26: Latin America Market Million Units Forecast by Application, 2020-2035
  • Table 27: Latin America Market Value (USD Million) Forecast by Form, 2020-2035
  • Table 28: Latin America Market Million Units Forecast by Form, 2020-2035
  • Table 29: Latin America Market Value (USD Million) Forecast by Source, 2020-2035
  • Table 30: Latin America Market Million Units Forecast by Source, 2020-2035
  • Table 31: Western Europe Market Value (USD Million) Forecast by Country, 2020-2035
  • Table 32: Western Europe Market Million Units Forecast by Country, 2020-2035
  • Table 33: Western Europe Market Value (USD Million) Forecast by Type, 2020-2035
  • Table 34: Western Europe Market Million Units Forecast by Type, 2020-2035
  • Table 35: Western Europe Market Value (USD Million) Forecast by Application, 2020-2035
  • Table 36: Western Europe Market Million Units Forecast by Application, 2020-2035
  • Table 37: Western Europe Market Value (USD Million) Forecast by Form, 2020-2035
  • Table 38: Western Europe Market Million Units Forecast by Form, 2020-2035
  • Table 39: Western Europe Market Value (USD Million) Forecast by Source, 2020-2035
  • Table 40: Western Europe Market Million Units Forecast by Source, 2020-2035
  • Table 41: Eastern Europe Market Value (USD Million) Forecast by Country, 2020-2035
  • Table 42: Eastern Europe Market Million Units Forecast by Country, 2020-2035
  • Table 43: Eastern Europe Market Value (USD Million) Forecast by Type, 2020-2035
  • Table 44: Eastern Europe Market Million Units Forecast by Type, 2020-2035
  • Table 45: Eastern Europe Market Value (USD Million) Forecast by Application, 2020-2035
  • Table 46: Eastern Europe Market Million Units Forecast by Application, 2020-2035
  • Table 47: Eastern Europe Market Value (USD Million) Forecast by Form, 2020-2035
  • Table 48: Eastern Europe Market Million Units Forecast by Form, 2020-2035
  • Table 49: Eastern Europe Market Value (USD Million) Forecast by Source, 2020-2035
  • Table 50: Eastern Europe Market Million Units Forecast by Source, 2020-2035
  • Table 51: East Asia Market Value (USD Million) Forecast by Country, 2020-2035
  • Table 52: East Asia Market Million Units Forecast by Country, 2020-2035
  • Table 53: East Asia Market Value (USD Million) Forecast by Type, 2020-2035
  • Table 54: East Asia Market Million Units Forecast by Type, 2020-2035
  • Table 55: East Asia Market Value (USD Million) Forecast by Application, 2020-2035
  • Table 56: East Asia Market Million Units Forecast by Application, 2020-2035
  • Table 57: East Asia Market Value (USD Million) Forecast by Form, 2020-2035
  • Table 58: East Asia Market Million Units Forecast by Form, 2020-2035
  • Table 59: East Asia Market Value (USD Million) Forecast by Source, 2020-2035
  • Table 60: East Asia Market Million Units Forecast by Source, 2020-2035
  • Table 61: South Asia & Pacific Market Value (USD Million) Forecast by Country, 2020-2035
  • Table 62: South Asia & Pacific Market Million Units Forecast by Country, 2020-2035
  • Table 63: South Asia & Pacific Market Value (USD Million) Forecast by Type, 2020-2035
  • Table 64: South Asia & Pacific Market Million Units Forecast by Type, 2020-2035
  • Table 65: South Asia & Pacific Market Value (USD Million) Forecast by Application, 2020-2035
  • Table 66: South Asia & Pacific Market Million Units Forecast by Application, 2020-2035
  • Table 67: South Asia & Pacific Market Value (USD Million) Forecast by Form, 2020-2035
  • Table 68: South Asia & Pacific Market Million Units Forecast by Form, 2020-2035
  • Table 69: South Asia & Pacific Market Value (USD Million) Forecast by Source, 2020-2035
  • Table 70: South Asia & Pacific Market Million Units Forecast by Source, 2020-2035
  • Table 71: Middle East and Africa Market Value (USD Million) Forecast by Country, 2020-2035
  • Table 72: Middle East and Africa Market Million Units Forecast by Country, 2020-2035
  • Table 73: Middle East and Africa Market Value (USD Million) Forecast by Type, 2020-2035
  • Table 74: Middle East and Africa Market Million Units Forecast by Type, 2020-2035
  • Table 75: Middle East and Africa Market Value (USD Million) Forecast by Application, 2020-2035
  • Table 76: Middle East and Africa Market Million Units Forecast by Application, 2020-2035
  • Table 77: Middle East and Africa Market Value (USD Million) Forecast by Form, 2020-2035
  • Table 78: Middle East and Africa Market Million Units Forecast by Form, 2020-2035
  • Table 79: Middle East and Africa Market Value (USD Million) Forecast by Source, 2020-2035
  • Table 80: Middle East and Africa Market Million Units Forecast by Source, 2020-2035

List of Figures

  • Figure 1: Global Market Million Units Forecast 2020-2035
  • Figure 2: Global Market Pricing Analysis
  • Figure 3: Global Market Value (USD Million) Forecast 2020-2035
  • Figure 4: Global Market Value Share and BPS Analysis by Type, 2025 and 2035
  • Figure 5: Global Market Y-o-Y Growth Comparison by Type, 2025-2035
  • Figure 6: Global Market Attractiveness Analysis by Type
  • Figure 7: Global Market Value Share and BPS Analysis by Application, 2025 and 2035
  • Figure 8: Global Market Y-o-Y Growth Comparison by Application, 2025-2035
  • Figure 9: Global Market Attractiveness Analysis by Application
  • Figure 10: Global Market Value Share and BPS Analysis by Form, 2025 and 2035
  • Figure 11: Global Market Y-o-Y Growth Comparison by Form, 2025-2035
  • Figure 12: Global Market Attractiveness Analysis by Form
  • Figure 13: Global Market Value Share and BPS Analysis by Source, 2025 and 2035
  • Figure 14: Global Market Y-o-Y Growth Comparison by Source, 2025-2035
  • Figure 15: Global Market Attractiveness Analysis by Source
  • Figure 16: Global Market Value (USD Million) Share and BPS Analysis by Region, 2025 and 2035
  • Figure 17: Global Market Y-o-Y Growth Comparison by Region, 2025-2035
  • Figure 18: Global Market Attractiveness Analysis by Region
  • Figure 19: North America Market Incremental $ Opportunity, 2025-2035
  • Figure 20: Latin America Market Incremental $ Opportunity, 2025-2035
  • Figure 21: Western Europe Market Incremental $ Opportunity, 2025-2035
  • Figure 22: Eastern Europe Market Incremental $ Opportunity, 2025-2035
  • Figure 23: East Asia Market Incremental $ Opportunity, 2025-2035
  • Figure 24: South Asia & Pacific Market Incremental $ Opportunity, 2025-2035
  • Figure 25: Middle East and Africa Market Incremental $ Opportunity, 2025-2035
  • Figure 26: North America Market Value Share and BPS Analysis by Country, 2025 and 2035
  • Figure 27: North America Market Value Share and BPS Analysis by Type, 2025 and 2035
  • Figure 28: North America Market Y-o-Y Growth Comparison by Type, 2025-2035
  • Figure 29: North America Market Attractiveness Analysis by Type
  • Figure 30: North America Market Value Share and BPS Analysis by Application, 2025 and 2035
  • Figure 31: North America Market Y-o-Y Growth Comparison by Application, 2025-2035
  • Figure 32: North America Market Attractiveness Analysis by Application
  • Figure 33: North America Market Value Share and BPS Analysis by Form, 2025 and 2035
  • Figure 34: North America Market Y-o-Y Growth Comparison by Form, 2025-2035
  • Figure 35: North America Market Attractiveness Analysis by Form
  • Figure 36: North America Market Value Share and BPS Analysis by Source, 2025 and 2035
  • Figure 37: North America Market Y-o-Y Growth Comparison by Source, 2025-2035
  • Figure 38: North America Market Attractiveness Analysis by Source
  • Figure 39: Latin America Market Value Share and BPS Analysis by Country, 2025 and 2035
  • Figure 40: Latin America Market Value Share and BPS Analysis by Type, 2025 and 2035
  • Figure 41: Latin America Market Y-o-Y Growth Comparison by Type, 2025-2035
  • Figure 42: Latin America Market Attractiveness Analysis by Type
  • Figure 43: Latin America Market Value Share and BPS Analysis by Application, 2025 and 2035
  • Figure 44: Latin America Market Y-o-Y Growth Comparison by Application, 2025-2035
  • Figure 45: Latin America Market Attractiveness Analysis by Application
  • Figure 46: Latin America Market Value Share and BPS Analysis by Form, 2025 and 2035
  • Figure 47: Latin America Market Y-o-Y Growth Comparison by Form, 2025-2035
  • Figure 48: Latin America Market Attractiveness Analysis by Form
  • Figure 49: Latin America Market Value Share and BPS Analysis by Source, 2025 and 2035
  • Figure 50: Latin America Market Y-o-Y Growth Comparison by Source, 2025-2035
  • Figure 51: Latin America Market Attractiveness Analysis by Source
  • Figure 52: Western Europe Market Value Share and BPS Analysis by Country, 2025 and 2035
  • Figure 53: Western Europe Market Value Share and BPS Analysis by Type, 2025 and 2035
  • Figure 54: Western Europe Market Y-o-Y Growth Comparison by Type, 2025-2035
  • Figure 55: Western Europe Market Attractiveness Analysis by Type
  • Figure 56: Western Europe Market Value Share and BPS Analysis by Application, 2025 and 2035
  • Figure 57: Western Europe Market Y-o-Y Growth Comparison by Application, 2025-2035
  • Figure 58: Western Europe Market Attractiveness Analysis by Application
  • Figure 59: Western Europe Market Value Share and BPS Analysis by Form, 2025 and 2035
  • Figure 60: Western Europe Market Y-o-Y Growth Comparison by Form, 2025-2035
  • Figure 61: Western Europe Market Attractiveness Analysis by Form
  • Figure 62: Western Europe Market Value Share and BPS Analysis by Source, 2025 and 2035
  • Figure 63: Western Europe Market Y-o-Y Growth Comparison by Source, 2025-2035
  • Figure 64: Western Europe Market Attractiveness Analysis by Source
  • Figure 65: Eastern Europe Market Value Share and BPS Analysis by Country, 2025 and 2035
  • Figure 66: Eastern Europe Market Value Share and BPS Analysis by Type, 2025 and 2035
  • Figure 67: Eastern Europe Market Y-o-Y Growth Comparison by Type, 2025-2035
  • Figure 68: Eastern Europe Market Attractiveness Analysis by Type
  • Figure 69: Eastern Europe Market Value Share and BPS Analysis by Application, 2025 and 2035
  • Figure 70: Eastern Europe Market Y-o-Y Growth Comparison by Application, 2025-2035
  • Figure 71: Eastern Europe Market Attractiveness Analysis by Application
  • Figure 72: Eastern Europe Market Value Share and BPS Analysis by Form, 2025 and 2035
  • Figure 73: Eastern Europe Market Y-o-Y Growth Comparison by Form, 2025-2035
  • Figure 74: Eastern Europe Market Attractiveness Analysis by Form
  • Figure 75: Eastern Europe Market Value Share and BPS Analysis by Source, 2025 and 2035
  • Figure 76: Eastern Europe Market Y-o-Y Growth Comparison by Source, 2025-2035
  • Figure 77: Eastern Europe Market Attractiveness Analysis by Source
  • Figure 78: East Asia Market Value Share and BPS Analysis by Country, 2025 and 2035
  • Figure 79: East Asia Market Value Share and BPS Analysis by Type, 2025 and 2035
  • Figure 80: East Asia Market Y-o-Y Growth Comparison by Type, 2025-2035
  • Figure 81: East Asia Market Attractiveness Analysis by Type
  • Figure 82: East Asia Market Value Share and BPS Analysis by Application, 2025 and 2035
  • Figure 83: East Asia Market Y-o-Y Growth Comparison by Application, 2025-2035
  • Figure 84: East Asia Market Attractiveness Analysis by Application
  • Figure 85: East Asia Market Value Share and BPS Analysis by Form, 2025 and 2035
  • Figure 86: East Asia Market Y-o-Y Growth Comparison by Form, 2025-2035
  • Figure 87: East Asia Market Attractiveness Analysis by Form
  • Figure 88: East Asia Market Value Share and BPS Analysis by Source, 2025 and 2035
  • Figure 89: East Asia Market Y-o-Y Growth Comparison by Source, 2025-2035
  • Figure 90: East Asia Market Attractiveness Analysis by Source
  • Figure 91: South Asia & Pacific Market Value Share and BPS Analysis by Country, 2025 and 2035
  • Figure 92: South Asia & Pacific Market Value Share and BPS Analysis by Type, 2025 and 2035
  • Figure 93: South Asia & Pacific Market Y-o-Y Growth Comparison by Type, 2025-2035
  • Figure 94: South Asia & Pacific Market Attractiveness Analysis by Type
  • Figure 95: South Asia & Pacific Market Value Share and BPS Analysis by Application, 2025 and 2035
  • Figure 96: South Asia & Pacific Market Y-o-Y Growth Comparison by Application, 2025-2035
  • Figure 97: South Asia & Pacific Market Attractiveness Analysis by Application
  • Figure 98: South Asia & Pacific Market Value Share and BPS Analysis by Form, 2025 and 2035
  • Figure 99: South Asia & Pacific Market Y-o-Y Growth Comparison by Form, 2025-2035
  • Figure 100: South Asia & Pacific Market Attractiveness Analysis by Form
  • Figure 101: South Asia & Pacific Market Value Share and BPS Analysis by Source, 2025 and 2035
  • Figure 102: South Asia & Pacific Market Y-o-Y Growth Comparison by Source, 2025-2035
  • Figure 103: South Asia & Pacific Market Attractiveness Analysis by Source
  • Figure 104: Middle East and Africa Market Value Share and BPS Analysis by Country, 2025 and 2035
  • Figure 105: Middle East and Africa Market Value Share and BPS Analysis by Type, 2025 and 2035
  • Figure 106: Middle East and Africa Market Y-o-Y Growth Comparison by Type, 2025-2035
  • Figure 107: Middle East and Africa Market Attractiveness Analysis by Type
  • Figure 108: Middle East and Africa Market Value Share and BPS Analysis by Application, 2025 and 2035
  • Figure 109: Middle East and Africa Market Y-o-Y Growth Comparison by Application, 2025-2035
  • Figure 110: Middle East and Africa Market Attractiveness Analysis by Application
  • Figure 111: Middle East and Africa Market Value Share and BPS Analysis by Form, 2025 and 2035
  • Figure 112: Middle East and Africa Market Y-o-Y Growth Comparison by Form, 2025-2035
  • Figure 113: Middle East and Africa Market Attractiveness Analysis by Form
  • Figure 114: Middle East and Africa Market Value Share and BPS Analysis by Source, 2025 and 2035
  • Figure 115: Middle East and Africa Market Y-o-Y Growth Comparison by Source, 2025-2035
  • Figure 116: Middle East and Africa Market Attractiveness Analysis by Source
  • Figure 117: Global Market - Tier Structure Analysis
  • Figure 118: Global Market - Company Share Analysis

Frequently Asked Questions

What is the projected valuation of the bakery enzymes market in 2025?

The projected market value of the bakery enzymes market in 2025 is USD 903.0 million.

What is the forecast market value of the bakery enzymes market by 2035?

The forecast market value of the bakery enzymes market by 2035 is USD 1,861.1 million.

What is the expected CAGR for the bakery enzymes market from 2025 to 2035?

The expected CAGR for the bakery enzymes market from 2025 to 2035 is 7.5%.

Which segment will lead the bakery enzymes market in 2035?

The carbohydrase segment will lead the bakery enzymes market in 2035, with a 45% market share.

Which country is expected to experience the highest growth in the bakery enzymes market?

China is expected to experience the highest growth with an 8.1% CAGR.

Explore Similar Insights

Future Market Insights

Bakery Enzymes Market