Bakery Ingredients Market Size, Share, and Forecast Outlook 2025 to 2035

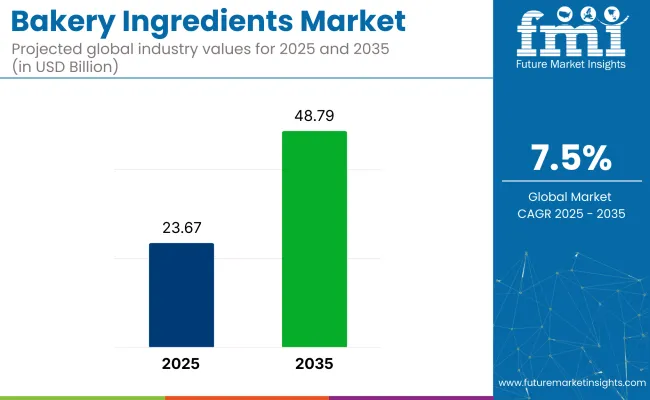
The global bakery ingredients market is estimated to reach a value of USD 23.67 billion by 2025, and it is projected to more than double, hitting USD 48.79 billion by 2035.This market is expected to grow at a CAGR of 7.5% over the forecast period. This substantial growth underscores the increasing demand for diverse and innovative bakery products worldwide, driven by shifting consumer preferences toward healthier, functional, and more sustainable ingredients.
Quick Stats of Bakery Ingredients Market

  • Market Value (2025): USD 23.67 billion
  • Forecast Value (2035): USD 48.79 billion
  • Forecast CAGR (2025 to 2035): 7.5%
  • Leading Segment in 2025: Dry Forms (65% share)
  • Key Growth Region: Asia Pacific (India is the fastest growing market with 8.5% CAGR)
  • Key Players: Cargill Inc., DuPont De Nemours and Company, Archer Daniel Midland, Ingredion Inc., Tate & Lyle PLC, DSM N.V., Associated British Foods, Corbion N.V., Novozymes N.V., Puratos Group N.V., and other market players.

Bakery Ingredients Market

Metric Value
Market Size (2025E) USD 23.67 billion
Market Value (2035F) USD 48.79 billion
CAGR (2025 to 2035) 7.3%

The market represents an estimated 8-10% of the global food ingredients market, valued above USD 400 billion. Within the processed food market, exceeding USD 4 trillion, its share is comparatively modest at less than 1%, as it contributes to a specific product category. In the functional ingredients market, bakery ingredients account for approximately 10-12%, given the frequent use of emulsifiers, enzymes, and leavening agents in baked goods.

In the broader baking industry, bakery ingredients represent about 25-30% of the value chain, reflecting their essential role in formulation and product quality. Within the convenience foods market, the share is estimated at around 4-6%, with rising demand for ready-to-eat and pre-mix bakery solutions contributing to moderate expansion.

One of the primary driving factors behind the rapid growth of the market is the ongoing demand for innovative and healthier alternatives. Consumers are increasingly seeking out gluten-free, organic, low-calorie, and clean-label bakery products, leading to a surge in demand for ingredients that cater to these preferences.

As awareness of dietary restrictions such as gluten intolerance, diabetes, and obesity rises, the demand for ingredients that offer functional and nutritional benefits continues to climb. This shift has encouraged ingredient suppliers to innovate and introduce new products that are not only healthier but also deliver improved taste and texture, ensuring that bakery goods remain appealing to a wide range of consumers. As of December 2023, 23 USA states reported an adult obesity prevalence at or above 35%, according to CDC.

Analysis of Bakery Ingredients Market by Top Investment Segments

The dry form segment leads the market due to its extended shelf life, ease of storage, and cost-effectiveness. Leavening agents hold a significant share, driven by their essential role in achieving texture and volume in baked goods. The bread segment dominates by application, fueled by its global consumption, versatility, and continuous innovation in healthier options.

By Form, Dry Segment Accounts for Over 65% Market Share

The dry form segment is expected to capture 65% of the market share in 2025. This dominance is primarily due to the practical benefits dry ingredients offer, such as extended shelf life, ease of storage, and transportation.

  • Dry ingredients like flour, yeast, and powdered additives are crucial for large-scale commercial baking and home baking alike, making them the preferred choice in the industry.
  • The dry form’s ability to remain stable without refrigeration and its cost-effectiveness further contribute to its leading position in the market.

Bakery Ingredients Market Analysis By Form

Leaving Agents Lead Product Demand with 30% Share

The leavening agents segment is expected to capture around 30% of the global bakery ingredients market share in 2025. This is due to their essential role in nearly all baked goods, including bread, cakes, cookies, and pastries, where they help achieve the desired texture, volume, and consistency.

  • Leavening agents such as yeast, baking powder, and baking soda are fundamental in both commercial and home baking, making them a critical ingredient for bakery products worldwide.
  • The demand for consistent, high-quality results in large-scale baking operations ensures that leavening agents continue to hold a significant share of the market.

Bread Applications Drive Industry Demand with 40% Share

The bread segment is expected to capture 40% of the market share by application in 2025.This dominant share can be attributed to bread's global consumption as a staple food, its versatility in various forms (loaves, rolls, flatbreads), and its essential role in both commercial and home baking.

  • Bread is one of the most widely consumed bakery products across the globe, and its consistent demand has driven the largest share for this category.
  • Bread’s versatility, affordability, and staple status in many diets, including those in emerging markets, contribute to its dominant position. It also benefits from ongoing innovations in healthier formulations, including gluten-free, whole grain, and low-carb varieties, which have further spurred demand.
  • The bread segment’s dominance is also supported by its essential role in foodservice and retail sectors, with bakeries, restaurants, and supermarkets constantly offering fresh, packaged, and frozen bread varieties.

Bakery Ingredients Market Analysis By Application

Top Bakery Ingredients Market Dynamics

The growing demand for healthier bakery products, driven by consumer preferences for gluten-free, organic, and low-calorie options, is fueling market growth. At the same time, advancements in baking technology and automation are enabling more efficient, large-scale production while improving product quality and consistency.

Growing Demand for Healthier Bakery Products

The increasing consumer shift toward healthier alternatives is one of the primary drivers of growth in the market. As consumers become more health-conscious, the demand for products such as gluten-free, organic, low-calorie, and high-protein baked goods has significantly increased.

This trend is not just limited to niche markets but is now reaching mainstream consumption, with large-scale commercial bakeries introducing healthier formulations to cater to a broader audience. Ingredient suppliers are responding by innovating to provide functional, clean-label ingredients that align with these health-conscious preferences.

  • Health-conscious consumer preferences drive demand for gluten-free, low-calorie, and organic ingredients.
  • Innovation in ingredients such as natural preservatives and organic flour supports the healthier product trend.
  • Rising awareness of dietary restrictions and nutritional benefits shapes product offerings across markets.

Advancements in Baking Technology and Automation

Technological innovation and automation have reshaped the market, enabling producers to meet rising demand more efficiently. Advances in food science and processing technologies have led to the development of ingredients that offer improved functionality, consistency, and shelf life.

Automation in large-scale commercial baking allows for the mass production of high-quality products, while maintaining optimal texture and taste. This shift toward technology-driven solutions is expected to continue supporting market growth, especially as global urbanization increases the need for convenient, ready-to-eat bakery products.

  • Baking technology advancements improve ingredient quality, consistency, and performance.
  • Automation in production allows for large-scale production with reduced costs and enhanced product quality.
  • Efficiency gains in production are driven by faster, more reliable baking processes that meet global demand.

Analysis of Top Countries Manufacturing, Exporting and Supplying Bakery Ingredients Globally

Bakery Ingredients Market Country Wise Analysis

Country CAGR (2025 to 2035)
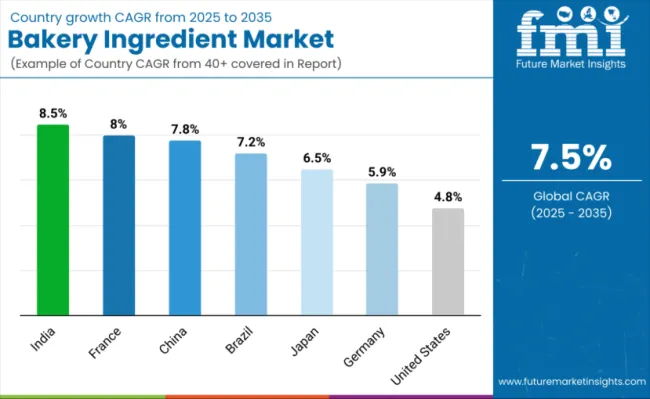
United States 4.8%
Japan 6.5%
France 8%
China 7.3%
India 8.5%

The global bakery ingredient market reflects a bifurcated growth pattern between mature OECD economies and rapidly expanding BRICS markets. India leads all countries with an 8.5% CAGR, driven by rising urban incomes, proliferation of bakery chains, and increasing adoption of Western-style foods.

China follows at 7.3%, where industrial-scale demand aligns with urban expansion and evolving breakfast consumption habits. Among OECD markets, France posts a 8.0% CAGR, fueled by a strong artisanal baking culture and demand for organic formulations. Japan (6.5%) focuses on functional and health-centric ingredients amid an aging demographic. The USA, with 4.85%, sees moderate growth supported by clean-label innovation and specialty formats. Volume expansion is led by BRICS, while OECD markets sustain growth through value-added differentiation.

United States Bakery Ingredients Industry Expansion

The USA bakery ingredients market is expected to grow at a CAGR of 4.8% during the forecast period. This growth is primarily attributed to the increasing demand for healthier bakery options, along with the rising popularity of convenient, ready-to-eat baked goods. The country has witnessed a surge in consumer awareness about gluten-free, organic, and low-calorie ingredients, which is significantly influencing the market.

FAs more consumers opt for functional foods, ingredient suppliers are focusing on developing clean-label, natural alternatives to cater to these evolving preferences. The rise in artisanal baking, combined with technological advancements in food processing, is enabling bakers to create higher-quality, innovative products. The booming foodservice industry and the shift towards healthier fast-food options further contribute to the growing market in the USA.

  • Health-conscious trends, such as the shift toward gluten-free and organic bakery products, are accelerating demand.
  • Artisanal baking and technological innovation in food production drive the market for high-quality ingredients.
  • The rise of convenience and on-the-go bakery products, combined with strong foodservice demand, supports market growth.

China Bakery Ingredients Industry Growth

The China bakery ingredients market is estimated to register a CAGR of 7.3% during the forecast period, driven by the country’s increasing consumption of processed and baked goods. As urbanization accelerates, there is a growing demand for convenience foods, including ready-to-eat bakery products.

China’s evolving dietary habits and a rising middle class are also contributing to the shift toward bakery products that cater to both traditional tastes and modern, health-conscious preferences. The rapid expansion of retail channels and supermarkets has made the product more accessible, thus further stimulating growth.

Additionally, China's growing interest in Western-style baked goods, such as cakes, bread, and pastries, has spurred an increase in demand for high-quality products. With the rising awareness of food quality and nutritional benefits, Chinese consumers are seeking clean-label and functional ingredients, encouraging suppliers to innovate.

  • Increasing urbanization and the rising middle class are driving demand for ready-to-eat bakery products.
  • Growing consumer interest in Western-style baked goods increases demand for high-quality ingredients.
  • Health-conscious trends lead to higher demand for clean-label, gluten-free, and low-calorie products.

India Bakery Ingredients Market Insights

The India bakery ingredients market is projected to grow at a CAGR of 8.5% during the forecast period, fueled by the country's expanding population and evolving food culture. India’s bakery market is undergoing a transformation, with consumers increasingly adopting Western-style eating habits and seeking convenient food options.

This trend is coupled with the rise in demand for healthier and more nutritious bakery products, as consumers become more conscious of their dietary choices. The increase in disposable income, combined with the growing demand for indulgent and premium bakery products, further accelerates market growth.

Additionally, India's large and diverse population is increasingly looking for a variety of bakery products, creating opportunities for innovation in the ingredients used, such as gluten-free, organic, and protein-enriched alternatives. The market is also supported by the rapid expansion of modern retail formats and foodservice outlets.

  • Adoption of Western eating habits and the growing need for convenience foods fuel market growth.
  • Health-conscious trends drive demand for gluten-free, organic, and premium bakery ingredients.
  • Rising disposable income and increasing demand for diverse bakery products lead to expanding market opportunities.

Bakery Ingredients Market Growth Outlook in Japan

Demand for bakery ingredients in Japan is estimated to grow at a CAGR of 6.5% during the forecast period, in line with the global market growth. The rise in bakery consumption, particularly bread and cakes, has been observed in urban areas where convenience and ready-to-eat foods are highly valued.

The Japanese market is particularly influenced by the growing interest in healthier alternatives, such as low-calorie and functional bakery products, which are increasingly sought after by the health-conscious population. Innovations in ingredients, such as those that improve texture and flavor while maintaining low-calorie counts, are driving demand.

Japan's strong foodservice industry, with a growing number of cafés, restaurants, and bakeries, continues to support the need for high-quality, consistent product. The steady incorporation of more international bakery styles, such as French and American pastries, has also influenced ingredient demand in the country.

  • Demand for healthier, low-calorie, and functional bakery products is shaping market growth.
  • Innovations in ingredient technology support the desire for improved textures and flavors in bakery goods.
  • Japan's growing foodservice industry, combined with international bakery trends, fuels ingredient demand.

Analysis of Bakery Ingredients Market in France

The France bakery ingredients market is estimated to grow at a CAGR of 8.0% during the forecast period, driven by the country’s deep-rooted bakery culture and the increasing demand for innovative, healthier products. France, known for its traditional bread and pastry products, is seeing a shift toward healthier options, with consumers seeking organic, low-sugar, and gluten-free ingredients.

As French consumers become more health-conscious, the demand for functional ingredients, such as those that enhance nutritional value and extend shelf life, is expected to rise. France’s strong foodservice and retail industries are fueling demand for ready-to-eat baked goods, such as baguettes, croissants, and artisan breads. The continuous innovation in the French bakery sector, coupled with increasing consumer awareness about the benefits of clean-label and organic products, is propelling the market growth.

  • Growing health-conscious trends in France drive demand for organic and gluten-free bakery ingredients.
  • France’s rich bakery culture, combined with innovation in functional ingredients, supports market growth.
  • The expansion of retail and foodservice industries, offering convenience and premium bakery products, fuels demand.

Leading Bakery Ingredients Suppliers

The bakery ingredients market is driven by a mix of established players and emerging innovators focusing on delivering high-quality ingredients for both commercial and artisanal baking. Key companies such as Cargill Inc., DuPont De Nemours and Company, and Archer Daniel Midland are leaders in providing a wide array of functional ingredients, from emulsifiers to starches and preservatives.

Ingredion Inc. and Tate & Lyle PLC focus on providing sustainable and health-conscious alternatives, driving the market with low-calorie, organic, and clean-label ingredient innovations. DSM N.V., Associated British Foods, and Corbion N.V. stand out with their advanced enzyme technologies and natural additives, playing a pivotal role in improving the texture, shelf-life, and nutritional profile of bakery products.

Novozymes N.V. and Puratos Group N.V. lead innovation with enzymes and other functional ingredients that support both the flavor and health benefits of modern bakery items. These global leaders, along with other market players, shape the competitive landscape of the bakery ingredients industry.

Recent Bakery Ingredients Industry News

  • In May 2024, DuPont announced plans to separate its Electronics and Water businesses. On January 15, 2025, it targeted November 1, 2025, for the completion of the Electronics business separation. This restructuring will realign management and reporting structure, impacting future segment reporting.

Leading Players

  • Cargill Inc.
  • DuPont De Nemours and Company
  • Archer Daniel Midland
  • Ingredion Inc.
  • Tate & Lyle PLC
  • DSM N.V.
  • Associated British Foods
  • Corbion N.V.
  • Novozymes N.V.
  • Puratos Group N.V.
  • Other Market Players

Report Coverage and Scope Summary

Report Attributes Details
Market Size (2025) USD 23.67 billion
Projected Market Size (2035) USD 48.79 billion
CAGR (2025 to 2035) 7.5%
Base Year for Estimation 2024
Historical Period 2020 to 2024
Projections Period 2025 to 2035
Quantitative Units USD billion for value and volume in kilo tons
Form Analyzed (Segment 1) Dry and Liquid.
Ingredient Type Analyzed (Segment 2) Fiber, Emulsifiers, Enzymes, Starches, Oils, Fats, And Shortenings, Baking Powder And Mixes, Preservatives, Colors And Flavors, And Leavening Agents.
Applications Analyzed (Segment 3) Foodservice Industry (Bread, Cookies And Biscuits, Rolls And Pies), Cakes And Pastries, And Others.
Regions Covered North America, Europe, Asia Pacific, Middle East & Africa, Latin America
Countries Covered United States, Canada, Germany, United Kingdom, France, Italy, Spain, China, Japan, South Korea, India, Australia, Brazil, Mexico, Argentina, Saudi Arabia, UAE, South Africa
Key Players Cargill Inc., DuPont De Nemours and Company, Archer Daniel Midland, Ingredion Inc., Tate & Lyle PLC, DSM N.V., Associated British Foods, Corbion N.V., Novozymes N.V., Puratos Group N.V., and other market players.
Additional Attributes Dollar sales, market share, growth trends, consumer preferences, competitive landscape, emerging ingredients, and regional demand variations to make informed business decisions.

Key Segments of the Report

By Form:

The industry is segmented into dry and liquid.

By Ingredient Type:

The key ingredients include fiber, emulsifiers, enzymes, starches, oils, fats, and shortenings, baking powder and mixes, preservatives, colors and flavors, and leavening agents.

By Application:

The industry finds applications in foodservice industry (bread, cookies and biscuits, rolls and pies), cakes and pastries, and others.

By Region:

The industry covers regions including North America, Europe, Asia Pacific, Latin America, and the Middle East & Africa.

Table of Content

  1. Executive Summary
    • Global Market Outlook
    • Demand-side Trends
    • Supply-side Trends
    • Technology Roadmap Analysis
    • Analysis and Recommendations
  2. Market Overview
    • Market Coverage / Taxonomy
    • Market Definition / Scope / Limitations
  3. Market Background
    • Market Dynamics
      • Drivers
      • Restraints
      • Opportunity
      • Trends
    • Scenario Forecast
      • Demand in Optimistic Scenario
      • Demand in Likely Scenario
      • Demand in Conservative Scenario
    • Opportunity Map Analysis
    • Product Life Cycle Analysis
    • Supply Chain Analysis
      • Supply Side Participants and their Roles
        • Producers
        • Mid-Level Participants (Traders/ Agents/ Brokers)
        • Wholesalers and Distributors
      • Value Added and Value Created at Node in the Supply Chain
      • List of Raw Material Suppliers
      • List of Existing and Potential Buyer’s
    • Investment Feasibility Matrix
    • Value Chain Analysis
      • Profit Margin Analysis
      • Wholesalers and Distributors
      • Retailers
    • PESTLE and Porter’s Analysis
    • Regulatory Landscape
      • By Key Regions
      • By Key Countries
    • Regional Parent Market Outlook
    • Production and Consumption Statistics
    • Import and Export Statistics
  4. Global Market Analysis 2020 to 2024 and Forecast, 2025 to 2035
    • Historical Market Size Value (USD Billion) & Volume ( kilo tons) Analysis, 2020 to 2024
    • Current and Future Market Size Value (USD Billion) & Volume ( kilo tons) Projections, 2025 to 2035
      • Y-o-Y Growth Trend Analysis
      • Absolute $ Opportunity Analysis
  5. Global Market Pricing Analysis 2020 to 2024 and Forecast 2025 to 2035
  6. Global Market Analysis 2020 to 2024 and Forecast 2025 to 2035, By Form
    • Introduction / Key Findings
    • Historical Market Size Value (USD Billion) & Volume ( kilo tons) Analysis By Form, 2020 to 2024
    • Current and Future Market Size Value (USD Billion) & Volume ( kilo tons) Analysis and Forecast By Form, 2025 to 2035
      • Dry
      • Liquid
    • Y-o-Y Growth Trend Analysis By Form, 2020 to 2024
    • Absolute $ Opportunity Analysis By Form, 2025 to 2035
  7. Global Market Analysis 2020 to 2024 and Forecast 2025 to 2035, By Ingredient Type
    • Introduction / Key Findings
    • Historical Market Size Value (USD Billion) & Volume ( kilo tons) Analysis By Ingredient Type, 2020 to 2024
    • Current and Future Market Size Value (USD Billion) & Volume ( kilo tons) Analysis and Forecast By Ingredient Type, 2025 to 2035
      • Fiber
      • Emulsifiers
      • Enzymes
      • Starches
      • Oils, Fats, and Shortenings
      • Baking Powder and Mixes
      • Preservatives
      • Colors and Flavors
      • Leavening Agents
    • Y-o-Y Growth Trend Analysis By Ingredient Type, 2020 to 2024
    • Absolute $ Opportunity Analysis By Ingredient Type, 2025 to 2035
  8. Global Market Analysis 2020 to 2024 and Forecast 2025 to 2035, By Application
    • Introduction / Key Findings
    • Historical Market Size Value (USD Billion) & Volume ( kilo tons) Analysis By Application, 2020 to 2024
    • Current and Future Market Size Value (USD Billion) & Volume ( kilo tons) Analysis and Forecast By Application, 2025 to 2035
      • Foodservice Industry
        • Bread
        • Cookies and Biscuits
        • Rolls and Pies
      • Cakes and Pastries
      • Others
    • Y-o-Y Growth Trend Analysis By Application, 2020 to 2024
    • Absolute $ Opportunity Analysis By Application, 2025 to 2035
  9. Global Market Analysis 2020 to 2024 and Forecast 2025 to 2035, By Region
    • Introduction
    • Historical Market Size Value (USD Billion) & Volume ( kilo tons) Analysis By Region, 2020 to 2024
    • Current Market Size Value (USD Billion) & Volume ( kilo tons) Analysis and Forecast By Region, 2025 to 2035
      • North America
      • Latin America
      • Western Europe
      • Eastern Europe
      • East Asia
      • South Asia & Pacific
      • Middle East and Africa
    • Market Attractiveness Analysis By Region
  10. North America Market Analysis 2020 to 2024 and Forecast 2025 to 2035, By Country
    • Historical Market Size Value (USD Billion) & Volume ( kilo tons) Trend Analysis By Market Taxonomy, 2020 to 2024
    • Market Size Value (USD Billion) & Volume ( kilo tons) Forecast By Market Taxonomy, 2025 to 2035
      • By Country
        • USA
        • Canada
        • Mexico
      • By Form
      • By Ingredient Type
      • By Application
    • Market Attractiveness Analysis
      • By Country
      • By Form
      • By Ingredient Type
      • By Application
    • Key Takeaways
  11. Latin America Market Analysis 2020 to 2024 and Forecast 2025 to 2035, By Country
    • Historical Market Size Value (USD Billion) & Volume ( kilo tons) Trend Analysis By Market Taxonomy, 2020 to 2024
    • Market Size Value (USD Billion) & Volume ( kilo tons) Forecast By Market Taxonomy, 2025 to 2035
      • By Country
        • Brazil
        • Argentina
        • Rest of LATAM
      • By Form
      • By Ingredient Type
      • By Application
    • Market Attractiveness Analysis
      • By Country
      • By Form
      • By Ingredient Type
      • By Application
    • Key Takeaways
  12. Western Europe Market Analysis 2020 to 2024 and Forecast 2025 to 2035, By Country
    • Historical Market Size Value (USD Billion) & Volume ( kilo tons) Trend Analysis By Market Taxonomy, 2020 to 2024
    • Market Size Value (USD Billion) & Volume ( kilo tons) Forecast By Market Taxonomy, 2025 to 2035
      • By Country
        • Germany
        • Italy
        • France
        • UK
        • Spain
        • BENELUX
        • Nordic
        • Rest of W.Europe
      • By Form
      • By Ingredient Type
      • By Application
    • Market Attractiveness Analysis
      • By Country
      • By Form
      • By Ingredient Type
      • By Application
    • Key Takeaways
  13. Eastern Europe Market Analysis 2020 to 2024 and Forecast 2025 to 2035, By Country
    • Historical Market Size Value (USD Billion) & Volume ( kilo tons) Trend Analysis By Market Taxonomy, 2020 to 2024
    • Market Size Value (USD Billion) & Volume ( kilo tons) Forecast By Market Taxonomy, 2025 to 2035
      • By Country
        • Russia
        • Hungary
        • Poland
        • Balkan & Baltics
        • Rest of E. Europe
      • By Form
      • By Ingredient Type
      • By Application
    • Market Attractiveness Analysis
      • By Country
      • By Form
      • By Ingredient Type
      • By Application
    • Key Takeaways
  14. East Asia Market Analysis 2020 to 2024 and Forecast 2025 to 2035, By Country
    • Historical Market Size Value (USD Billion) & Volume ( kilo tons) Trend Analysis By Market Taxonomy, 2020 to 2024
    • Market Size Value (USD Billion) & Volume ( kilo tons) Forecast By Market Taxonomy, 2025 to 2035
      • By Country
        • China
        • Japan
        • South Korea
      • By Form
      • By Ingredient Type
      • By Application
    • Market Attractiveness Analysis
      • By Country
      • By Form
      • By Ingredient Type
      • By Application
    • Key Takeaways
  15. South Asia & Pacific Market Analysis 2020 to 2024 and Forecast 2025 to 2035, By Country
    • Historical Market Size Value (USD Billion) & Volume ( kilo tons) Trend Analysis By Market Taxonomy, 2020 to 2024
    • Market Size Value (USD Billion) & Volume ( kilo tons) Forecast By Market Taxonomy, 2025 to 2035
      • By Country
        • India
        • Australia & New Zealand
        • ASEAN
        • Rest of SAP
      • By Form
      • By Ingredient Type
      • By Application
    • Market Attractiveness Analysis
      • By Country
      • By Form
      • By Ingredient Type
      • By Application
    • Key Takeaways
  16. Middle East and Africa Market Analysis 2020 to 2024 and Forecast 2025 to 2035, By Country
    • Historical Market Size Value (USD Billion) & Volume ( kilo tons) Trend Analysis By Market Taxonomy, 2020 to 2024
    • Market Size Value (USD Billion) & Volume ( kilo tons) Forecast By Market Taxonomy, 2025 to 2035
      • By Country
        • GCC Countries
        • Northern Africa
        • South Africa
        • Turkiye
        • Rest of MEA
      • By Form
      • By Ingredient Type
      • By Application
    • Market Attractiveness Analysis
      • By Country
      • By Form
      • By Ingredient Type
      • By Application
    • Key Takeaways
  17. Key Countries Market Analysis
    • USA
      • Pricing Analysis
      • Market Share Analysis, 2024
        • By Form
        • By Ingredient Type
        • By Application
    • Canada
      • Pricing Analysis
      • Market Share Analysis, 2024
        • By Form
        • By Ingredient Type
        • By Application
    • Brazil
      • Pricing Analysis
      • Market Share Analysis, 2024
        • By Form
        • By Ingredient Type
        • By Application
    • Mexico
      • Pricing Analysis
      • Market Share Analysis, 2024
        • By Form
        • By Ingredient Type
        • By Application
    • Argentina
      • Pricing Analysis
      • Market Share Analysis, 2024
        • By Form
        • By Ingredient Type
        • By Application
  18. Market Structure Analysis
    • Competition Dashboard
    • Competition Benchmarking
    • Market Share Analysis of Top Players
      • By Regional
      • By Form
      • By Ingredient Type
      • By Application
  19. Competition Analysis
    • Competition Deep Dive
      • Cargill Inc.
        • Overview
        • Product Portfolio
        • Profitability by Market Segments (Product/Age /Sales Channel/Region)
        • Sales Footprint
        • Strategy Overview
          • Marketing Strategy
          • Product Strategy
          • Channel Strategy
      • DuPont De Nemours and Company
        • Overview
        • Product Portfolio
        • Profitability by Market Segments (Product/Age /Sales Channel/Region)
        • Sales Footprint
        • Strategy Overview
          • Marketing Strategy
          • Product Strategy
          • Channel Strategy
      • Archer Daniel Midland
        • Overview
        • Product Portfolio
        • Profitability by Market Segments (Product/Age /Sales Channel/Region)
        • Sales Footprint
        • Strategy Overview
          • Marketing Strategy
          • Product Strategy
          • Channel Strategy
      • Ingredion Inc.
        • Overview
        • Product Portfolio
        • Profitability by Market Segments (Product/Age /Sales Channel/Region)
        • Sales Footprint
        • Strategy Overview
          • Marketing Strategy
          • Product Strategy
          • Channel Strategy
      • Tate & Lyle PLC
        • Overview
        • Product Portfolio
        • Profitability by Market Segments (Product/Age /Sales Channel/Region)
        • Sales Footprint
        • Strategy Overview
          • Marketing Strategy
          • Product Strategy
          • Channel Strategy
      • DSM N.V.
        • Overview
        • Product Portfolio
        • Profitability by Market Segments (Product/Age /Sales Channel/Region)
        • Sales Footprint
        • Strategy Overview
          • Marketing Strategy
          • Product Strategy
          • Channel Strategy
      • Associated British Foods
        • Overview
        • Product Portfolio
        • Profitability by Market Segments (Product/Age /Sales Channel/Region)
        • Sales Footprint
        • Strategy Overview
          • Marketing Strategy
          • Product Strategy
          • Channel Strategy
      • Corbion N.V.
        • Overview
        • Product Portfolio
        • Profitability by Market Segments (Product/Age /Sales Channel/Region)
        • Sales Footprint
        • Strategy Overview
          • Marketing Strategy
          • Product Strategy
          • Channel Strategy
      • Novozymes N.V.
        • Overview
        • Product Portfolio
        • Profitability by Market Segments (Product/Age /Sales Channel/Region)
        • Sales Footprint
        • Strategy Overview
          • Marketing Strategy
          • Product Strategy
          • Channel Strategy
      • Puratos Group N.V.
        • Overview
        • Product Portfolio
        • Profitability by Market Segments (Product/Age /Sales Channel/Region)
        • Sales Footprint
        • Strategy Overview
          • Marketing Strategy
          • Product Strategy
          • Channel Strategy
      • Other Market Players
        • Overview
        • Product Portfolio
        • Profitability by Market Segments (Product/Age /Sales Channel/Region)
        • Sales Footprint
        • Strategy Overview
          • Marketing Strategy
          • Product Strategy
          • Channel Strategy
  20. Assumptions & Acronyms Used
  21. Research Methodology

List of Tables

  • Table 1: Global Market Value (USD Billion) Forecast by Region, 2020-2035
  • Table 2: Global Market Volume ( kilo tons) Forecast by Region, 2020-2035
  • Table 3: Global Market Value (USD Billion) Forecast by Form, 2020-2035
  • Table 4: Global Market Volume ( kilo tons) Forecast by Form, 2020-2035
  • Table 5: Global Market Value (USD Billion) Forecast by Ingredient Type, 2020-2035
  • Table 6: Global Market Volume ( kilo tons) Forecast by Ingredient Type, 2020-2035
  • Table 7: Global Market Value (USD Billion) Forecast by Application, 2020-2035
  • Table 8: Global Market Volume ( kilo tons) Forecast by Application, 2020-2035
  • Table 9: North America Market Value (USD Billion) Forecast by Country, 2020-2035
  • Table 10: North America Market Volume ( kilo tons) Forecast by Country, 2020-2035
  • Table 11: North America Market Value (USD Billion) Forecast by Form, 2020-2035
  • Table 12: North America Market Volume ( kilo tons) Forecast by Form, 2020-2035
  • Table 13: North America Market Value (USD Billion) Forecast by Ingredient Type, 2020-2035
  • Table 14: North America Market Volume ( kilo tons) Forecast by Ingredient Type, 2020-2035
  • Table 15: North America Market Value (USD Billion) Forecast by Application, 2020-2035
  • Table 16: North America Market Volume ( kilo tons) Forecast by Application, 2020-2035
  • Table 17: Latin America Market Value (USD Billion) Forecast by Country, 2020-2035
  • Table 18: Latin America Market Volume ( kilo tons) Forecast by Country, 2020-2035
  • Table 19: Latin America Market Value (USD Billion) Forecast by Form, 2020-2035
  • Table 20: Latin America Market Volume ( kilo tons) Forecast by Form, 2020-2035
  • Table 21: Latin America Market Value (USD Billion) Forecast by Ingredient Type, 2020-2035
  • Table 22: Latin America Market Volume ( kilo tons) Forecast by Ingredient Type, 2020-2035
  • Table 23: Latin America Market Value (USD Billion) Forecast by Application, 2020-2035
  • Table 24: Latin America Market Volume ( kilo tons) Forecast by Application, 2020-2035
  • Table 25: Western Europe Market Value (USD Billion) Forecast by Country, 2020-2035
  • Table 26: Western Europe Market Volume ( kilo tons) Forecast by Country, 2020-2035
  • Table 27: Western Europe Market Value (USD Billion) Forecast by Form, 2020-2035
  • Table 28: Western Europe Market Volume ( kilo tons) Forecast by Form, 2020-2035
  • Table 29: Western Europe Market Value (USD Billion) Forecast by Ingredient Type, 2020-2035
  • Table 30: Western Europe Market Volume ( kilo tons) Forecast by Ingredient Type, 2020-2035
  • Table 31: Western Europe Market Value (USD Billion) Forecast by Application, 2020-2035
  • Table 32: Western Europe Market Volume ( kilo tons) Forecast by Application, 2020-2035
  • Table 33: Eastern Europe Market Value (USD Billion) Forecast by Country, 2020-2035
  • Table 34: Eastern Europe Market Volume ( kilo tons) Forecast by Country, 2020-2035
  • Table 35: Eastern Europe Market Value (USD Billion) Forecast by Form, 2020-2035
  • Table 36: Eastern Europe Market Volume ( kilo tons) Forecast by Form, 2020-2035
  • Table 37: Eastern Europe Market Value (USD Billion) Forecast by Ingredient Type, 2020-2035
  • Table 38: Eastern Europe Market Volume ( kilo tons) Forecast by Ingredient Type, 2020-2035
  • Table 39: Eastern Europe Market Value (USD Billion) Forecast by Application, 2020-2035
  • Table 40: Eastern Europe Market Volume ( kilo tons) Forecast by Application, 2020-2035
  • Table 41: East Asia Market Value (USD Billion) Forecast by Country, 2020-2035
  • Table 42: East Asia Market Volume ( kilo tons) Forecast by Country, 2020-2035
  • Table 43: East Asia Market Value (USD Billion) Forecast by Form, 2020-2035
  • Table 44: East Asia Market Volume ( kilo tons) Forecast by Form, 2020-2035
  • Table 45: East Asia Market Value (USD Billion) Forecast by Ingredient Type, 2020-2035
  • Table 46: East Asia Market Volume ( kilo tons) Forecast by Ingredient Type, 2020-2035
  • Table 47: East Asia Market Value (USD Billion) Forecast by Application, 2020-2035
  • Table 48: East Asia Market Volume ( kilo tons) Forecast by Application, 2020-2035
  • Table 49: South Asia & Pacific Market Value (USD Billion) Forecast by Country, 2020-2035
  • Table 50: South Asia & Pacific Market Volume ( kilo tons) Forecast by Country, 2020-2035
  • Table 51: South Asia & Pacific Market Value (USD Billion) Forecast by Form, 2020-2035
  • Table 52: South Asia & Pacific Market Volume ( kilo tons) Forecast by Form, 2020-2035
  • Table 53: South Asia & Pacific Market Value (USD Billion) Forecast by Ingredient Type, 2020-2035
  • Table 54: South Asia & Pacific Market Volume ( kilo tons) Forecast by Ingredient Type, 2020-2035
  • Table 55: South Asia & Pacific Market Value (USD Billion) Forecast by Application, 2020-2035
  • Table 56: South Asia & Pacific Market Volume ( kilo tons) Forecast by Application, 2020-2035
  • Table 57: Middle East and Africa Market Value (USD Billion) Forecast by Country, 2020-2035
  • Table 58: Middle East and Africa Market Volume ( kilo tons) Forecast by Country, 2020-2035
  • Table 59: Middle East and Africa Market Value (USD Billion) Forecast by Form, 2020-2035
  • Table 60: Middle East and Africa Market Volume ( kilo tons) Forecast by Form, 2020-2035
  • Table 61: Middle East and Africa Market Value (USD Billion) Forecast by Ingredient Type, 2020-2035
  • Table 62: Middle East and Africa Market Volume ( kilo tons) Forecast by Ingredient Type, 2020-2035
  • Table 63: Middle East and Africa Market Value (USD Billion) Forecast by Application, 2020-2035
  • Table 64: Middle East and Africa Market Volume ( kilo tons) Forecast by Application, 2020-2035

List of Figures

  • Figure 1: Global Market Volume ( kilo tons) Forecast 2020-2035
  • Figure 2: Global Market Pricing Analysis
  • Figure 3: Global Market Value (USD Billion) Forecast 2020-2035
  • Figure 4: Global Market Value Share and BPS Analysis by Form, 2025 and 2035
  • Figure 5: Global Market Y-o-Y Growth Comparison by Form, 2025-2035
  • Figure 6: Global Market Attractiveness Analysis by Form
  • Figure 7: Global Market Value Share and BPS Analysis by Ingredient Type, 2025 and 2035
  • Figure 8: Global Market Y-o-Y Growth Comparison by Ingredient Type, 2025-2035
  • Figure 9: Global Market Attractiveness Analysis by Ingredient Type
  • Figure 10: Global Market Value Share and BPS Analysis by Application, 2025 and 2035
  • Figure 11: Global Market Y-o-Y Growth Comparison by Application, 2025-2035
  • Figure 12: Global Market Attractiveness Analysis by Application
  • Figure 13: Global Market Value (USD Billion) Share and BPS Analysis by Region, 2025 and 2035
  • Figure 14: Global Market Y-o-Y Growth Comparison by Region, 2025-2035
  • Figure 15: Global Market Attractiveness Analysis by Region
  • Figure 16: North America Market Incremental $ Opportunity, 2025-2035
  • Figure 17: Latin America Market Incremental $ Opportunity, 2025-2035
  • Figure 18: Western Europe Market Incremental $ Opportunity, 2025-2035
  • Figure 19: Eastern Europe Market Incremental $ Opportunity, 2025-2035
  • Figure 20: East Asia Market Incremental $ Opportunity, 2025-2035
  • Figure 21: South Asia & Pacific Market Incremental $ Opportunity, 2025-2035
  • Figure 22: Middle East and Africa Market Incremental $ Opportunity, 2025-2035
  • Figure 23: North America Market Value Share and BPS Analysis by Country, 2025 and 2035
  • Figure 24: North America Market Value Share and BPS Analysis by Form, 2025 and 2035
  • Figure 25: North America Market Y-o-Y Growth Comparison by Form, 2025-2035
  • Figure 26: North America Market Attractiveness Analysis by Form
  • Figure 27: North America Market Value Share and BPS Analysis by Ingredient Type, 2025 and 2035
  • Figure 28: North America Market Y-o-Y Growth Comparison by Ingredient Type, 2025-2035
  • Figure 29: North America Market Attractiveness Analysis by Ingredient Type
  • Figure 30: North America Market Value Share and BPS Analysis by Application, 2025 and 2035
  • Figure 31: North America Market Y-o-Y Growth Comparison by Application, 2025-2035
  • Figure 32: North America Market Attractiveness Analysis by Application
  • Figure 33: Latin America Market Value Share and BPS Analysis by Country, 2025 and 2035
  • Figure 34: Latin America Market Value Share and BPS Analysis by Form, 2025 and 2035
  • Figure 35: Latin America Market Y-o-Y Growth Comparison by Form, 2025-2035
  • Figure 36: Latin America Market Attractiveness Analysis by Form
  • Figure 37: Latin America Market Value Share and BPS Analysis by Ingredient Type, 2025 and 2035
  • Figure 38: Latin America Market Y-o-Y Growth Comparison by Ingredient Type, 2025-2035
  • Figure 39: Latin America Market Attractiveness Analysis by Ingredient Type
  • Figure 40: Latin America Market Value Share and BPS Analysis by Application, 2025 and 2035
  • Figure 41: Latin America Market Y-o-Y Growth Comparison by Application, 2025-2035
  • Figure 42: Latin America Market Attractiveness Analysis by Application
  • Figure 43: Western Europe Market Value Share and BPS Analysis by Country, 2025 and 2035
  • Figure 44: Western Europe Market Value Share and BPS Analysis by Form, 2025 and 2035
  • Figure 45: Western Europe Market Y-o-Y Growth Comparison by Form, 2025-2035
  • Figure 46: Western Europe Market Attractiveness Analysis by Form
  • Figure 47: Western Europe Market Value Share and BPS Analysis by Ingredient Type, 2025 and 2035
  • Figure 48: Western Europe Market Y-o-Y Growth Comparison by Ingredient Type, 2025-2035
  • Figure 49: Western Europe Market Attractiveness Analysis by Ingredient Type
  • Figure 50: Western Europe Market Value Share and BPS Analysis by Application, 2025 and 2035
  • Figure 51: Western Europe Market Y-o-Y Growth Comparison by Application, 2025-2035
  • Figure 52: Western Europe Market Attractiveness Analysis by Application
  • Figure 53: Eastern Europe Market Value Share and BPS Analysis by Country, 2025 and 2035
  • Figure 54: Eastern Europe Market Value Share and BPS Analysis by Form, 2025 and 2035
  • Figure 55: Eastern Europe Market Y-o-Y Growth Comparison by Form, 2025-2035
  • Figure 56: Eastern Europe Market Attractiveness Analysis by Form
  • Figure 57: Eastern Europe Market Value Share and BPS Analysis by Ingredient Type, 2025 and 2035
  • Figure 58: Eastern Europe Market Y-o-Y Growth Comparison by Ingredient Type, 2025-2035
  • Figure 59: Eastern Europe Market Attractiveness Analysis by Ingredient Type
  • Figure 60: Eastern Europe Market Value Share and BPS Analysis by Application, 2025 and 2035
  • Figure 61: Eastern Europe Market Y-o-Y Growth Comparison by Application, 2025-2035
  • Figure 62: Eastern Europe Market Attractiveness Analysis by Application
  • Figure 63: East Asia Market Value Share and BPS Analysis by Country, 2025 and 2035
  • Figure 64: East Asia Market Value Share and BPS Analysis by Form, 2025 and 2035
  • Figure 65: East Asia Market Y-o-Y Growth Comparison by Form, 2025-2035
  • Figure 66: East Asia Market Attractiveness Analysis by Form
  • Figure 67: East Asia Market Value Share and BPS Analysis by Ingredient Type, 2025 and 2035
  • Figure 68: East Asia Market Y-o-Y Growth Comparison by Ingredient Type, 2025-2035
  • Figure 69: East Asia Market Attractiveness Analysis by Ingredient Type
  • Figure 70: East Asia Market Value Share and BPS Analysis by Application, 2025 and 2035
  • Figure 71: East Asia Market Y-o-Y Growth Comparison by Application, 2025-2035
  • Figure 72: East Asia Market Attractiveness Analysis by Application
  • Figure 73: South Asia & Pacific Market Value Share and BPS Analysis by Country, 2025 and 2035
  • Figure 74: South Asia & Pacific Market Value Share and BPS Analysis by Form, 2025 and 2035
  • Figure 75: South Asia & Pacific Market Y-o-Y Growth Comparison by Form, 2025-2035
  • Figure 76: South Asia & Pacific Market Attractiveness Analysis by Form
  • Figure 77: South Asia & Pacific Market Value Share and BPS Analysis by Ingredient Type, 2025 and 2035
  • Figure 78: South Asia & Pacific Market Y-o-Y Growth Comparison by Ingredient Type, 2025-2035
  • Figure 79: South Asia & Pacific Market Attractiveness Analysis by Ingredient Type
  • Figure 80: South Asia & Pacific Market Value Share and BPS Analysis by Application, 2025 and 2035
  • Figure 81: South Asia & Pacific Market Y-o-Y Growth Comparison by Application, 2025-2035
  • Figure 82: South Asia & Pacific Market Attractiveness Analysis by Application
  • Figure 83: Middle East and Africa Market Value Share and BPS Analysis by Country, 2025 and 2035
  • Figure 84: Middle East and Africa Market Value Share and BPS Analysis by Form, 2025 and 2035
  • Figure 85: Middle East and Africa Market Y-o-Y Growth Comparison by Form, 2025-2035
  • Figure 86: Middle East and Africa Market Attractiveness Analysis by Form
  • Figure 87: Middle East and Africa Market Value Share and BPS Analysis by Ingredient Type, 2025 and 2035
  • Figure 88: Middle East and Africa Market Y-o-Y Growth Comparison by Ingredient Type, 2025-2035
  • Figure 89: Middle East and Africa Market Attractiveness Analysis by Ingredient Type
  • Figure 90: Middle East and Africa Market Value Share and BPS Analysis by Application, 2025 and 2035
  • Figure 91: Middle East and Africa Market Y-o-Y Growth Comparison by Application, 2025-2035
  • Figure 92: Middle East and Africa Market Attractiveness Analysis by Application
  • Figure 93: Global Market - Tier Structure Analysis
  • Figure 94: Global Market - Company Share Analysis

Frequently Asked Questions

What is the estimated market size of the bakery ingredients industry in 2025?

The industry is valued at USD 23.67 billion in 2025.

What is the projected industry size of the bakery ingredients industry by 2035?

It is forecasted to reach USD 48.79 billion by 2035.

What is the expected CAGR for the bakery ingredients industry between 2025 and 2035?

The industry is anticipated to grow at a CAGR of 7.5% during this period.

Which segment is expected to lead the bakery ingredients market in 2025?

Dry form is projected to lead the market with a 65% share in 2025.

Which region is expected to witness the highest growth in the bakery ingredients market?

Asia Pacific, particularly India, is expected to be the key growth region with a projected growth rate of 8.5%.

Explore Similar Insights

Future Market Insights

Bakery Ingredients Market