The Sugarcane Bottle market is experiencing steady growth, driven by the increasing global emphasis on sustainable packaging and eco-friendly materials. Rising environmental awareness among consumers and corporate commitments toward reducing plastic waste are accelerating the adoption of bio-based packaging solutions. Sugarcane-derived bottles are gaining popularity as they are renewable, recyclable, and biodegradable, aligning with circular economy initiatives.
The packaging industry’s shift toward low-carbon alternatives is further propelling market demand. Advancements in biopolymer technology and cost optimization in manufacturing have improved the quality, durability, and performance of sugarcane bottles, making them suitable for various end-use applications such as food, beverages, cosmetics, and personal care. Supportive government policies promoting green packaging and restrictions on single-use plastics are encouraging large-scale industrial adoption.
Moreover, leading FMCG brands are incorporating sugarcane-based bottles to meet sustainability goals and consumer expectations As global demand for environmentally responsible packaging continues to rise, the Sugarcane Bottle market is projected to maintain robust growth, supported by innovation in materials and expanding application scope across industries.
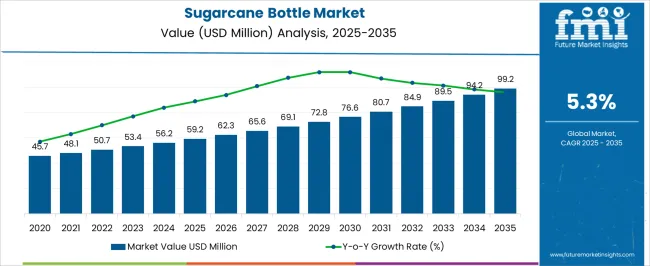
| Metric | Value |
|---|---|
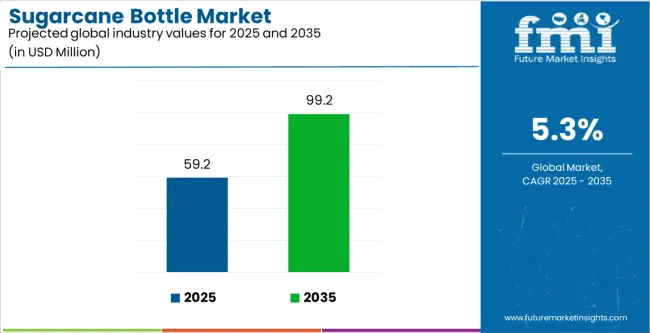
| Sugarcane Bottle Market Estimated Value in (2025 E) | USD 59.2 million |
| Sugarcane Bottle Market Forecast Value in (2035 F) | USD 99.2 million |
| Forecast CAGR (2025 to 2035) | 5.3% |
The market is segmented by Capacity, Material Type, End Use, and Distribution Channel and region. By Capacity, the market is divided into 251 Ml To 500 Ml, Less Than 100 Ml, 101 Ml To 250 Ml, and More Than 500 Ml. In terms of Material Type, the market is classified into Sugar and Bagasse. Based on End Use, the market is segmented into Cosmetics And Personal Care, Pharmaceutical, Consumer Durables, and Food And Beverage. By Distribution Channel, the market is divided into Offline and Online. Regionally, the market is classified into North America, Latin America, Western Europe, Eastern Europe, Balkan & Baltic Countries, Russia & Belarus, Central Asia, East Asia, South Asia & Pacific, and the Middle East & Africa.
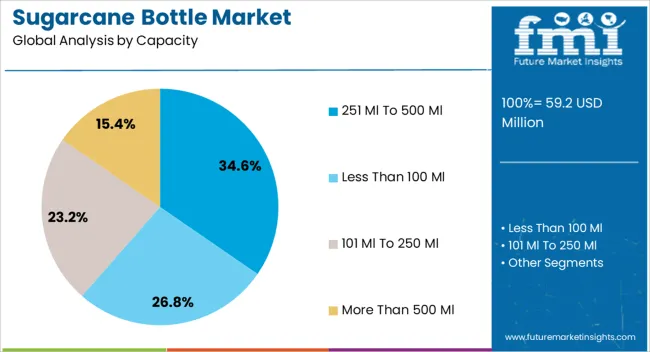
The 251 ml to 500 ml capacity segment is expected to account for 34.6% of the Sugarcane Bottle market revenue share in 2025, establishing it as the leading capacity range. This segment’s dominance is attributed to its versatility, suitability for multiple product types, and convenience for daily consumer use. Manufacturers prefer this capacity range as it balances cost efficiency and practicality for packaging beverages, cosmetics, and household products.
The compact size supports portability while maintaining adequate volume, appealing to eco-conscious consumers seeking sustainable alternatives to traditional plastic bottles. Additionally, the 251 ml to 500 ml bottles are increasingly being adopted by small and medium enterprises that target single-use and travel-friendly packaging solutions.
Their adaptability across various distribution channels, including retail and e-commerce, further strengthens their market position Continuous innovation in lightweight biopolymer design and manufacturing scalability is expected to enhance affordability, reinforcing the segment’s leadership in the Sugarcane Bottle market.
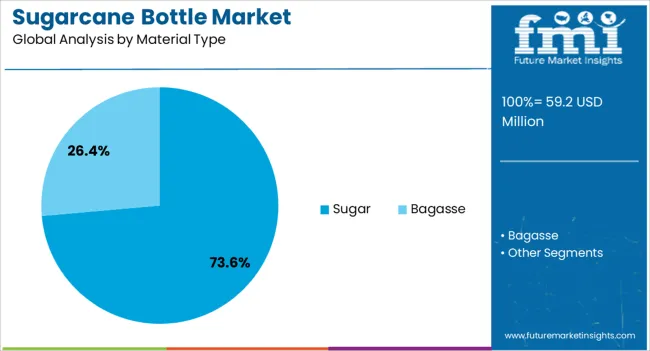
The sugar material type segment is projected to hold 73.6% of the Sugarcane Bottle market revenue share in 2025, making it the leading material type. Its dominance stems from sugarcane’s renewable nature, high yield efficiency, and carbon-neutral characteristics. The use of sugarcane-based polyethylene provides a sustainable substitute for fossil-fuel-derived plastics without compromising strength or durability.
The material’s ability to undergo efficient recycling and biodegradation supports environmental compliance and enhances brand value for eco-focused manufacturers. Moreover, sugarcane-derived materials contribute to reducing greenhouse gas emissions, aligning with global climate targets. Growing consumer preference for natural, bio-based materials is encouraging packaging companies to expand their production capacities and invest in R&D.
As regulatory authorities impose stricter rules on petroleum-based plastics, demand for sugarcane-based alternatives continues to surge With expanding adoption across FMCG and personal care sectors, the sugar material type segment is expected to maintain its dominant position, supported by technological advancements and increasing material accessibility.
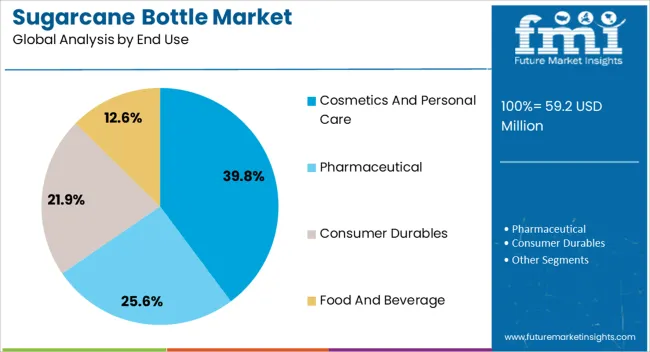
The cosmetics and personal care segment is anticipated to capture 39.8% of the Sugarcane Bottle market revenue share in 2025, positioning it as the leading end-use industry. Growth in this segment is being driven by the rising consumer preference for eco-friendly and premium packaging options that align with sustainability values. Leading cosmetic brands are transitioning toward sugarcane-derived bottles to reduce their environmental footprint and enhance brand image.
The packaging’s aesthetic appeal, combined with durability and biodegradability, makes it a preferred choice for skincare, haircare, and hygiene product manufacturers. Additionally, regulatory support for sustainable packaging and increasing consumer willingness to pay for environmentally responsible products are fueling adoption.
The versatility of sugarcane bottles allows customization in shape, color, and finish, offering brands differentiation in competitive markets As sustainability becomes integral to product innovation strategies, the cosmetics and personal care segment is expected to remain a key driver of demand, strengthening its contribution to the Sugarcane Bottle market.
The amplifying talks about environmental concerns globally are indicated in the sugarcane bottle market. The sugarcane bottle industry is evolving, as these bottles are easy to recycle have zero adverse impact on the environment, and are not impacted by the crude oil cost fluctuations.
Chemical resistance is significant in product packaging in personal care, cosmetics, medicines, and other sectors. The sugarcane bottle is a fabulous replacement for glass or plastic bottles due to the endurance of the product inside the bottle and their reaction to the bottle.
| Attributes | Details |
|---|---|
| Market Value for 2020 | USD 45.70 million |
| Market Value for 2025 | USD 53.60 million |
| Market CAGR from 2020 to 2025 | 3.20% |
The cost of sugarcane bottle production is more than that of manufacturing typical plastic PET bottles because of concerns like where to get raw materials, how they are processed, and the technique used to manufacture. The higher expenses severely inhibit the adoption of sugarcane bottles, particularly in price-sensitive economies.
There is a scarcity of general adoption and awareness of sugarcane bottles, even if environmentally conscious customers actively seek sustainable options. Making the public aware and removing customer doubts about the feasibility and benefits of sugarcane bottles are essential for the market expansion of sugarcane bottles.
The segmented sugarcane bottle market analysis is mentioned in the following subsection. The sugar sector is leading the material type category based on exhaustive studies. Likewise, the cosmetics and personal care segment is commanding the end use category.
| Segment | Sugar |
|---|---|
| Share (2025) | 73.6% |
The sugar segment commands the material type category of the market owing to the economic viability and scalability. The consumer demand and the industry dynamics indicate the flourishing demand of the sugar segment. The sustained growth of sugar-based materials bolsters it to the leading position in the market.
| Segment | Cosmetics and Personal Care |
|---|---|
| Share (2025) | 39.8% |
The cosmetics and personal care industry has undergone substantial changes in recent years, with brands adapting to the environmental change crisis using renewable packaging solutions like sugarcane bottles.
The adoption of sugarcane bottles in cosmetics and personal care packaging types such as pump bottles, lotion bottles, powder bottles, roll-on bottles, and squeeze bottles has witnessed a significant escalation as they provide similar chemical resistance to conventional plastic bottles. The cosmetics and personal care segment remains a profitable segment in the market.
The sugarcane bottle market can be observed in the subsequent data tables, which concentrate on the leading regions in North America, Europe, and Asia Pacific. An inclusive assessment indicates that Asia Pacific has enormous market opportunities for sugarcane bottle.
Market Opportunities for Sugarcane Bottles in Asia Pacific
| Countries | CAGR (2025 to 2035) |
|---|---|
| India | 5.50% |
| China | 5.20% |
| Japan | 3.40% |
| South Korea | 2.80% |
| Thailand | 4.80% |
India is a leading producer of sugarcane that serves as a major resource for sugarcane bottle production. The Indian government programs like the Plastic Waste Management Rules are ramping up the adoption of sugarcane bottles.
Indian manufacturers are continuously making investments in research and development to augment the accessibility of sugarcane bottles.
The surging disposable income of the China consumer spurs the growth of the sugarcane bottle market. The food and beverage industry expansion creates considerable opportunities for sugarcane bottle vendors in China. The awareness of consumers towards ecologically friendly products encourages the adoption of sugarcane bottles in China.
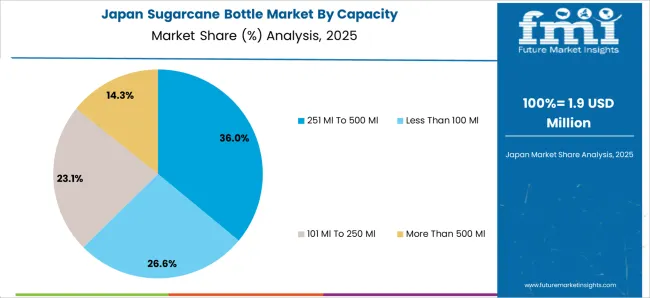
The Japan demand for sugarcane bottles is swelling owing to surged investments in recycling facilities. Japanese sugarcane bottle producers are investing in cutting-edge technologies to amplify the productivity of sugarcane bottle manufacturing.
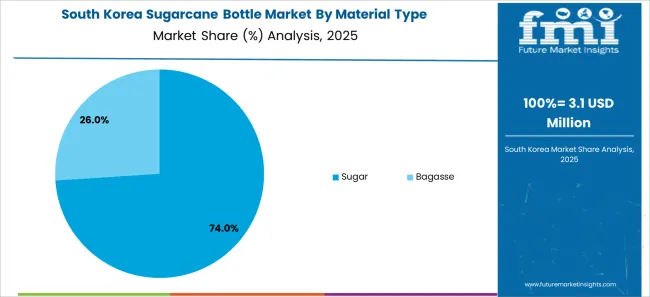
As customers learn about the detrimental effects of plastic packaging, they are inclined to adopt sugarcane bottles in South Korea. The government's plans to cut down plastic usage provoke the demand for sugarcane bottles in South Korea.
Thailand has a significant production of sugarcane which intensifies the sugarcane bottle adoption due to the presence of huge amounts of raw material. The Thailand government provides subsidies, which causes an upsurge in sales of sugarcane bottles.
Demand Analysis of Sugarcane Bottles in North America
| Countries | CAGR (2025 to 2035) |
|---|---|
| United States | 3.10% |
| Canada | 3.30% |
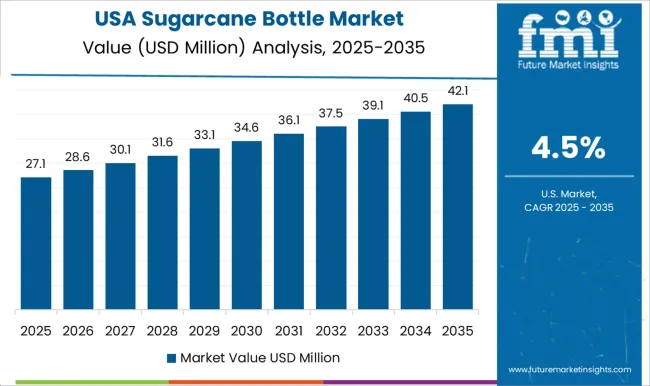
The strict rules and laws advancing sustainable choices are advocating the adoption of sugarcane bottles in the United States. The United States is a leading consumer market, which presents abundant growth potential in the sugarcane bottle market.
The escalating CSR trend intensifies Canadian producers to clutch environment-friendly packaging alternatives like sugarcane bottles. The flourishing food and beverage sector of Canada, linked with booming sustainability worries thrust the demand for an ecological packaging option.
Potential for Sugarcane Bottle Market in Europe
| Countries | CAGR (2025 to 2035) |
|---|---|
| Germany | 2.40% |
| United Kingdom | 2.70% |
| France | 2.50% |
| Italy | 2.30% |
| Spain | 2.0% |
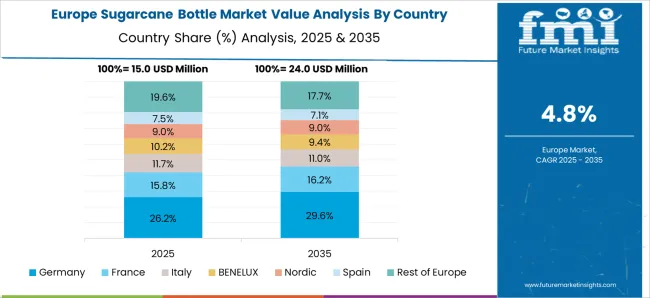
Germany's strong recycling infrastructure adds to the adoption of sugarcane bottles, coordinating with the country's circular economy goals. With a potent emphasis on environmental preservation, German consumers favor products that are packaged in compostable or renewable materials like sugarcane.
This suggests that Germany has the potential to witness the sugarcane bottle market growth.
The dynamic retail sector and emphasis on corporate social responsibility induce producers to transition to eco-friendly packaging solutions like sugarcane bottles in the United Kingdom.
The United Kingdom consumers' mushrooming choice for sustainable products positively provokes manufacturers to employ sugarcane bottles to minimize carbon footprint and plastic waste.
France's commitment to environmental conservancy augments the broad demand for sugarcane bottles, particularly in the food and cosmetics sectors. France's strong agricultural sector and focus on bio-based materials encourage the adoption of sugarcane bottles as a practical packaging solution.
The food and beverage industry is actively adopting sugarcane bottles to establish their brands as sustainable and favor environmentally aware consumers. The rich culture of craftsmanship, integrated with a thriving eco-conscious consumer base, amplifies the sugarcane bottle demand in Italy.
Spain's vibrant tourism industry and spotlight on sustainability induce the adoption of sugarcane bottles in the hotel and catering industry and related sectors. Consumers' developing eco-consciousness is culminating in a boom in demand for sugarcane bottles and other environmentally friendly packaging materials.
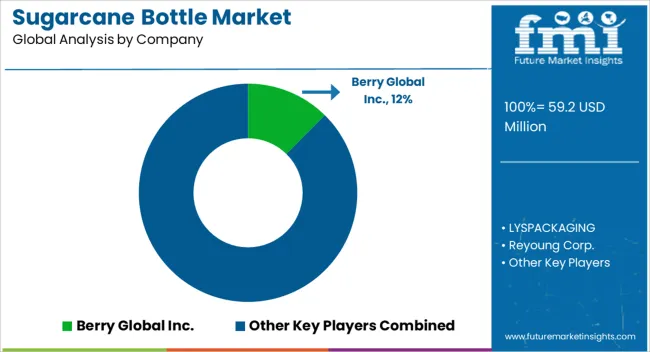
Several prominent sugarcane bottle manufacturers strive for market share and innovation leadership. The sugarcane bottle vendors, such as Bottle Up, Worthy, BE O Lifestyle, LYSPACKAGING, and Berry Global Inc., each bring their diversified expertise and portfolio.
SHENZHEN UNIQUE PACK CO., LTD., Reyoung Corp., and The Natural Bottle positively induce competitive dynamics with their groundbreaking sugarcane bottle solutions.
Suzhou Fomalhaut Eco-Pack Material Tech Co., Ltd. and Bottle Promotions garner attention with their inventions for developing eco-friendly packaging, while Fortis X and Eurobottle focus on quality and strength.
As the significant sugarcane bottle producers steer the shifting sustainable packaging landscape, there is a smooth path for continuous innovation. Partnerships and competition among these sugarcane bottle manufacturers propel breakthroughs in sugarcane bottle technology, delivering the booming demand for eco-friendly alternatives.
The market dynamics are potent, with each sugarcane bottle supplier contending to capitalize on emerging opportunities in the sugarcane bottle sector.
Remarkable Progressions and Breakthroughs
| Company | Details |
|---|---|
| Bottle Up | WHSmith stores started carrying Bottle Up recyclable bottles in 35 international airports in Europe in March 2025. Bottle Up listings were added to 400 transportation websites in the United Kingdom. In Europe, Bottle Up emerged as the first brand to provide reusable water bottles to tourists. |
| Idealpak | Idealpak stated in August 2024 that it was expanding its assortment of products comprising sugarcane bottles, jars, and tubes for use in a variety of categories, including pharmaceuticals and cosmetics. |
| Berry Global Group | Berry Global Group and Bhoomi teamed up and signed an agreement to introduce a bottle made of 100% sugarcane in September 2024, which endorsed the business to fixate its concentration on having an optimistic environmental impact |
The global sugarcane bottle market is estimated to be valued at USD 59.2 million in 2025.
The market size for the sugarcane bottle market is projected to reach USD 99.2 million by 2035.
The sugarcane bottle market is expected to grow at a 5.3% CAGR between 2025 and 2035.
The key product types in sugarcane bottle market are 251 ml to 500 ml, less than 100 ml, 101 ml to 250 ml and more than 500 ml.
In terms of material type, sugar segment to command 73.6% share in the sugarcane bottle market in 2025.


Full Research Suite comprises of:
Market outlook & trends analysis
Interviews & case studies
Strategic recommendations
Vendor profiles & capabilities analysis
5-year forecasts
8 regions and 60+ country-level data splits
Market segment data splits
12 months of continuous data updates
DELIVERED AS:
PDF EXCEL ONLINE
Sugarcane Based PET Bottles Market
Sugarcane-Derived Squalane Market Size and Share Forecast Outlook 2025 to 2035
Sugarcane Fiber Bowls Market – Growth & Demand 2025 to 2035
Sugarcane Packaging Market Analysis by Material and Application 2025 to 2035
Bottle Sealing Wax Market Size and Share Forecast Outlook 2025 to 2035
Bottle Filling Machines Market Size and Share Forecast Outlook 2025 to 2035
Bottle Shippers Market Size and Share Forecast Outlook 2025 to 2035
Bottled Water Packaging Market Size and Share Forecast Outlook 2025 to 2035
Bottle Sticker Labelling Machine Market Size and Share Forecast Outlook 2025 to 2035
Bottle Dividers Market Size and Share Forecast Outlook 2025 to 2035
Bottle Jack Market Size and Share Forecast Outlook 2025 to 2035
Bottles Market Analysis - Growth & Forecast 2025 to 2035
Bottle Capping Machine Market Analysis by Automation, Operating Speed, Machine Type, End-use Industry, and Region Forecast Through 2035
Market Share Distribution Among Bottle Dividers Suppliers
Bottle Carrier Market Trends – Growth & Forecast 2024-2034
Bottle Cap Market Analysis & Industry Forecast 2024-2034
Bottled Water Processing Equipment Market Trends – Growth & Industry Forecast 2025-2035
Bottle Pourers Market
RTD Bottled Cocktail Market - Size, Share, and Forecast Outlook 2025 to 2035
PET Bottles Market Demand and Insights 2025 to 2035

Thank you!
You will receive an email from our Business Development Manager. Please be sure to check your SPAM/JUNK folder too.
Chat With
MaRIA