Bottle Shippers Market Snapshot (2023 to 2033)

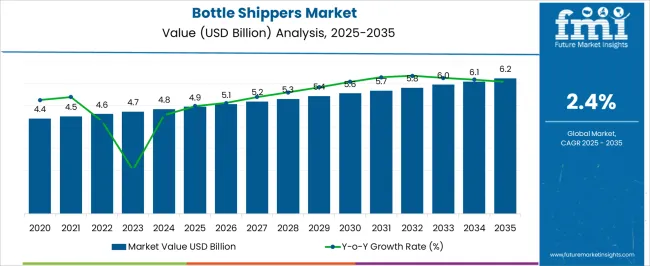
The global bottle shippers market size is expected to be valued at US$ 4.7 billion in 2023. Changing consumer lifestyle and consumption habits, bolsters the overall scope for bottle shippers market, which is projected to grow at a CAGR of 2.5% between 2023 and 2033, totaling around US$ 6.0 billion by 2033.

Data Points Key Statistics
Bottle Shippers Market Value 2023 US$ 4.7 billion
Bottle Shippers Market Projected Value (2033) US$ 6.0 billion
Bottle Shippers Market CAGR (2023 to 2033) 2.5%

The rise of e-commerce and the growing popularity of direct-to-consumer (D2C) sales have had a significant impact on various industries, including the beverage sector. This shift in consumer purchasing behavior has led to a surge in demand for secure and protective packaging solutions, especially for products like bottles, which are fragile and susceptible to damage during transit.

Consumers are increasingly turning to e-commerce platforms for their purchases, with the convenience of online shopping and the wide availability of products. The ease of browsing, ordering, and doorstep delivery appeals to a broader customer base, including those looking for specialty beverages and unique alcoholic offerings.

The diverse range of bottles used in the beverage industry necessitates customized packaging solutions to accommodate varying sizes and shapes. Bottle shippers are designed with specific bottle types in mind, ensuring a snug and secure fit, which minimizes movement and reduces the risk of damage.

Last-mile delivery is a crucial part of the e-commerce process, and it presents unique challenges, especially for fragile items like bottles. Bottle shippers with effective cushioning and padding play a vital role in protecting the contents during this final leg of the delivery journey.

For many D2C brands, the unboxing experience is an essential part of customer satisfaction and brand loyalty. Well-designed bottle shippers not only protect the product but also enhance the overall brand experience, leaving a positive impression on the customer.

Don't pay for what you don't need

Customize your report by selecting specific countries or regions and save 30%!

Global Bottle Shippers Market Historical Analysis (2018 To 2022) Vs. Forecast Outlook (2023 To 2033)

The global demand for bottle shippers is projected to increase at a CAGR of 1.2% during the forecast period between 2018 and 2022, reaching a total of US$ 6.0 billion in 2033.

According to Future Market Insights, a market research and competitive intelligence provider, the bottle shippers market was valued at US$ 4.6 billion in 2022.

The focus on sustainable packaging has emerged as a significant driver in the beverage industry, including the demand for environmentally friendly bottle shippers. Consumers are increasingly aware of the environmental impact of packaging materials, leading them to seek products from brands that prioritize sustainability and take proactive steps to reduce their carbon footprint. The growing awareness has created a shift in consumer preferences, and businesses are responding by adopting sustainable practices in their packaging choices.

Consumers are demanding products that align with their values, with greater access to information and heightened awareness of environmental issues. Sustainable packaging, including recyclable and biodegradable bottle shippers, resonates with eco-conscious consumers who seek to minimize their ecological footprint.

Companies are increasingly incorporating sustainability into their corporate social responsibility initiatives. Businesses can showcase their commitment to environmental stewardship and contribute to a positive brand image, by choosing sustainable packaging materials.

Governments worldwide are implementing stricter regulations on packaging materials to address the growing plastic waste problem. Sustainable packaging solutions, such as recyclable and biodegradable bottle shippers, enable companies to comply with these regulations and demonstrate their dedication to responsible practices.

What is Primarily Driving the Market for Bottle Shippers?

Advancements in Packaging Technology is Likely to be Beneficial for Market Growth

Advancements in packaging technology have significantly impacted the design and functionality of bottle shippers, resulting in more efficient, protective, and reliable packaging solutions. Innovations in cushioning materials, design elements, and closures have been instrumental in ensuring safer transportation of bottles and minimizing product damage during transit.

Packaging technology has introduced advanced cushioning materials that provide better protection to bottles during transit. Materials such as foam inserts, air pillows, molded pulp, and corrugated dividers are designed to absorb shocks and vibrations, reducing the risk of breakage or leakage.

Packaging engineers have developed impact-resistant bottle shipper designs that take into account the fragile nature of glass and other bottle materials. Bottle shippers can withstand external forces and maintain the integrity of the bottles inside, by incorporating specific structural features and reinforcements.

Advanced packaging technology allows for customization based on the specific shape and size of bottles. The flexibility ensures that the bottle shippers provide a snug fit and minimize movement during transit, thereby reducing the potential for collision and breakage.

Growth of Craft Beverages to Fuel the Market Growth

The growth of craft beverages, including craft beers, artisanal spirits, and small-batch wines, has been a significant trend in the beverage industry in recent years. Craft beverages are characterized by their high-quality ingredients, unique flavors, and the artistry of their production, which appeals to a niche and discerning consumer base. The demand for specialized bottle shippers has also risen to cater to the unique packaging requirements of these premium products, as these craft beverages gain popularity.

Craft beverages often come in unique bottle sizes and shapes that differ from standard commercial bottles. Specialized bottle shippers are designed to accommodate these non-traditional dimensions, ensuring a snug fit and optimal protection during transit.

Craft beverages typically feature artistic labeling and branding that reflects the creativity and individuality of the product. Specialized bottle shippers may incorporate clear windows or custom printing to showcase the label artwork, enhancing the presentation and brand identity during transportation.

Craft beverages are often packaged in premium bottles with unique finishes, such as embossing or etching, that require extra protection during shipping. Specialized bottle shippers use high-quality materials and cushioning to safeguard these premium bottles from damage.

Craft beverages are often produced in small batches, making them limited-edition products with a higher perceived value. Specialized bottle shippers may be designed to cater to smaller production volumes, offering more flexible packaging solutions.

Ismail Sutaria
Ismail Sutaria

Principal Consultant

Talk to Analyst

Find your sweet spots for generating winning opportunities in this market.

Category-wise Insights

Which Product Type of Bottle Shippers is to Boost the Market Growth?

Corrugated Boxes to Take the Lion’s Share

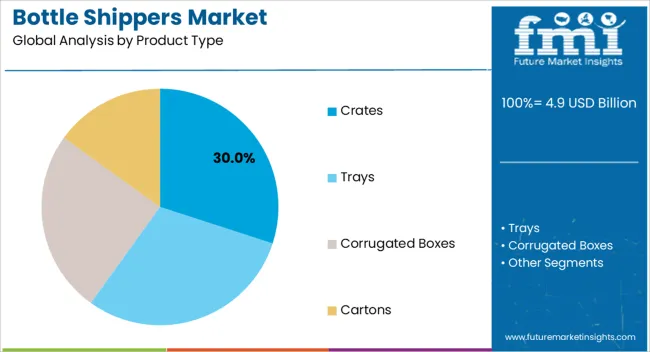
The corrugated boxes are expected to be the major segment that will boost the growth of the market. Corrugated boxes offer high flexibility and customization in design, size, and shape, making them suitable for packaging bottles of various types and dimensions. The versatility attracts beverage manufacturers and retailers seeking tailored packaging solutions.

The boxes are relatively cost-effective compared to other packaging materials. They provide a cost-efficient option for transporting bottles in bulk, making them appealing to businesses aiming to optimize their supply chain costs. The corrugated boxes are designed with multiple layers of durable corrugated material, providing excellent protection and cushioning for bottles during transit. The protective feature is crucial in ensuring that fragile bottles remain intact and undamaged during shipping. The segment is expected to hold a CAGR of 2.4% during the forecast period.

Which Application Generates Heavy Demand for the Bottle Shippers?

Wine to Take the Lion’s Share

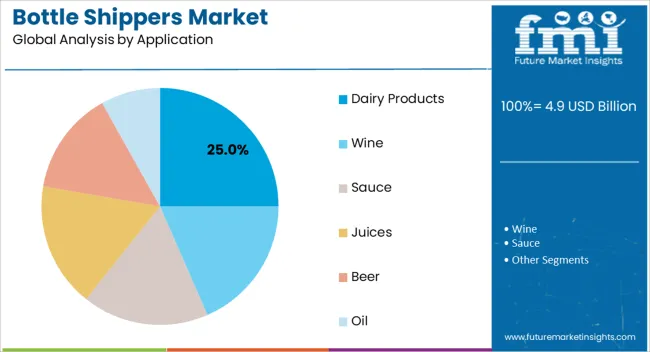
The wine segment under the application generates heavy demand for bottle shippers. The global wine industry has been experiencing steady growth, with an increasing number of consumers enjoying wines from various regions. The demand for reliable and secure bottle shippers to transport wine bottles safely to consumers is expected to rise, as the wine market expands.

There is a growing trend of premiumization in the wine market, with consumers willing to pay more for high-quality and unique wines. Premium wines often come in delicate and aesthetically pleasing bottles, requiring specialized bottle shippers to ensure their protection during transportation. The rise of e-commerce and direct-to-consumer sales of wine has created a need for robust packaging solutions. Wine bottles shipped directly to consumers must be well-protected to avoid damage and leaks during transit, making the use of secure bottle shippers essential. The segment is expected to hold a CAGR of 2.4% during the forecast period.

Region-wise Insights

Why is Asia Pacific Emerging as an Opportunistic Bottle Shippers Market?

Increasing Demand for Spirits to Boost the Market Growth

Asia Pacific is set to remain at the forefront in the assessment period in terms of the bottle shippers' market share. The growth is mainly attributed to China, which is considered to be one of the most significant consumers of alcoholic beverages.

The high demand for spirits, imported beer, wine, and the Chinese rice liquor ‘Baijiu’ is expected to bode well for the market. The rising consumption of alcohol in Asia Pacific, on the other hand, backed by the need to facilitate social interaction and relieve stress is anticipated to drive the market. The region is expected to hold a CAGR of 2.4% over the analysis period.
How is North America Contributing to Growth of the Bottle Shippers Market?

Increasing Awareness About Alcoholic Products to Boost the Market Growth

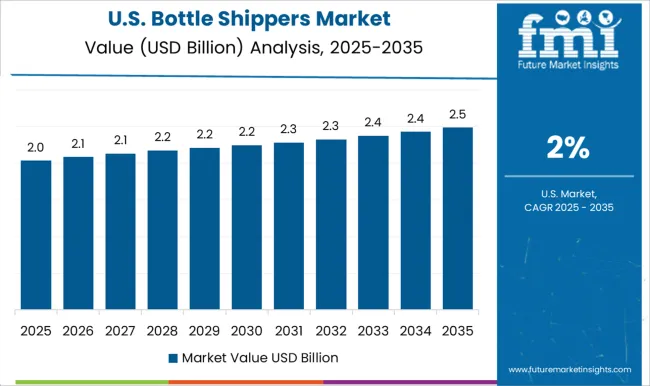
The increasing awareness about differentiating various alcoholic products among manufacturers based on their packaging is likely to boost the North American bottle shippers' market growth in the future years. The increasing focus of several United States-based manufacturers on the development of state-of-the-art, as well as relatively low-cost packaging solutions, such as bottle shippers is another crucial factor that is anticipated to fuel the regional market. The region is expected to hold a CAGR of 2.3% over the analysis period.

The increasing usage of shippers for the efficient transportation of non-alcoholic and alcoholic beverages is set to surge across North America, even though these shippers take more storage space, as compared to other packaging solutions. The easy availability of numerous customizable solutions for brand owners is likely to help in expanding the market foothold of United States-based companies.

Get the data you need at a Fraction of the cost

Personalize your report by choosing insights you need
and save 40%!

The Start-Up Ecosystem: How key Players are opening Frontiers for Future Growth?

Bottle shippers market startup players are adopting various marketing strategies such as new product launches, geographical expansion, merger and acquisitions, partnerships and collaboration to create a larger customer base. For instance,
  • Founded in 2019, Wine Cabana is a startup specializing in wine storage and transportation solutions. The company offers specialized bottle shippers and storage containers for wine enthusiasts and collectors to transport and store their bottles securely.
  • Started in 2020, Recycl3R is a startup focused on sustainability in packaging. The firm offers bottle shippers made from recycled and biodegradable materials, aiming to reduce the environmental impact of packaging waste.
  • Established in 2017, Vessel Packaging is a startup focused on providing innovative and sustainable packaging solutions for the beverage industry. The organization offers premium bottle shippers made from eco-friendly materials to protect craft beers and spirits during shipping.
  • Founded in 2018, Kept Fresh is a startup that offers packaging solutions for food and beverages. The startup provides bottle shippers designed to maintain the freshness and integrity of products during transit, especially for perishable beverages.

Competitive Portfolio

Key players in the bottle shippers market are strongly focusing on profit generation from their existing product portfolios along while exploring potential new applications. The players are emphasizing on increasing their bottle shippers production capacities, to cater to the demand from numerous end use industries. Prominent players are also pushing for geographical expansion to decrease the dependency on imported bottle shippers.

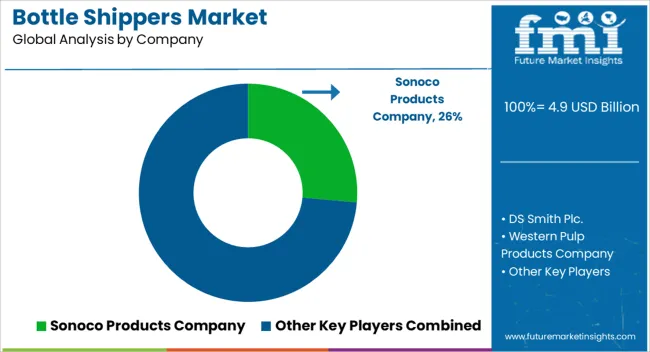
  • Sonoco Products Company: Sonoco is a global provider of diversified consumer packaging, industrial products, protective solutions, and packaging services. The company offers a wide range of packaging solutions, including bottle shippers, designed to protect and transport various types of bottles. Sonoco's bottle shippers are known for their reliability, innovative design, and commitment to sustainability.
  • DS Smith Plc: DS Smith is a leading provider of sustainable packaging solutions with a focus on paper and corrugated packaging. The company offers eco-friendly bottle shippers made from recyclable and renewable materials. DS Smith's bottle shippers are designed to provide maximum protection for bottles during transit while minimizing their environmental impact.
  • Western Pulp Products Company: Western Pulp Products Company is a packaging manufacturer specializing in molded fiber products. The company offers environmentally friendly bottle shippers made from recycled paper pulp. These sustainable bottle shippers provide excellent protection and cushioning for various bottle types.
  • RADVA Corporation: RADVA Corporation is a packaging solutions provider that offers a wide range of protective packaging products, including bottle shippers. The company provides custom-designed bottle shippers that cater to the specific needs of their clients, ensuring secure transportation of bottles.

Scope of the Report

Attributes Details
Forecast Period 2023 to 2033
Historical Data Available for 2018 to 2022
Market Analysis USD Billion for value and Tons for Volume
Key Regions Covered North America; Latin America; Western Europe; Eastern Europe; South Asia & Pacific; East Asia; and Middle East & Africa
Key Countries Covered United States, Canada, Brazil, Mexico, Germany, UK, France, Spain, Italy, Poland, Russia, Czech Republic, Romania, India, Bangladesh, Australia, New Zealand, China, Japan, South Korea, GCC Countries, South Africa, Israel.
Key Segments Covered Product Type, Material Type, Application, and Region
Key Companies Profiled Sonoco Products Company; DS Smith Plc.; Western Pulp Products Company; RADVA Corporation; Packaging Services Industries; Saxon Packaging Limited
Report Coverage Market Forecast, brand share analysis, competition intelligence, DROT analysis, Market Dynamics and Challenges, Strategic Growth Initiatives
Customization & Pricing Available upon Request

Key Segments Profiled In The Global Bottle Shippers Market

By Product Type:

  • Crates
  • Trays
  • Corrugated Boxes
  • Cartons

By Material Type:

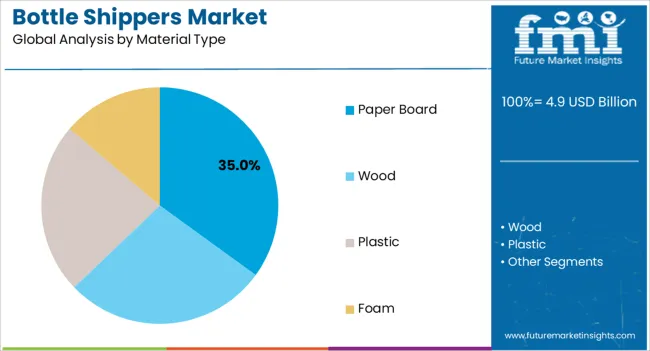
  • Paper Board
  • Wood
  • Plastic
  • Foam

By Application:

  • Dairy Products
  • Wine
  • Sauce
  • Juices
  • Beer
  • Oil

Region:

  • North America
  • Latin America
  • Western Europe
  • Eastern Europe
  • South Asia and Pacific
  • East Asia
  • Middle East and Africa (MEA)

Frequently Asked Questions

How Big is the Bottle Shippers Market?

The market is valued at US$ 4.7 billion in 2023.

What is North America's Expected CAGR over the Forecast Period?

The region is expected to hold a CAGR of 2.3% over the forecast period.

What is the CAGR for the Market until 2033?

The market is likely to register a 2.5% CAGR through 2033.

What is the Anticipated Market Value in 2033?

The market is expected to be worth US$ 6.0 billion by 2033.

How was the Historical Performance of the Market?

The market recorded a CAGR of 1.2% from 2018 to 2022.

Table of Content
1. Executive Summary
    1.1. Global Market Outlook
    1.2. Demand-side Trends
    1.3. Supply-side Trends
    1.4. Technology Roadmap Analysis
    1.5. Analysis and Recommendations
2. Market Overview
    2.1. Market Coverage / Taxonomy
    2.2. Market Definition / Scope / Limitations
3. Market Background
    3.1. Market Dynamics
        3.1.1. Drivers
        3.1.2. Restraints
        3.1.3. Opportunity
        3.1.4. Trends
    3.2. Scenario Forecast
        3.2.1. Demand in Optimistic Scenario
        3.2.2. Demand in Likely Scenario
        3.2.3. Demand in Conservative Scenario
    3.3. Opportunity Map Analysis
    3.4. Product Life Cycle Analysis
    3.5. Supply Chain Analysis
        3.5.1. Supply Side Participants and their Roles
            3.5.1.1. Producers
            3.5.1.2. Mid-Level Participants (Traders/ Agents/ Brokers)
            3.5.1.3. Wholesalers and Distributors
        3.5.2. Value Added and Value Created at Node in the Supply Chain
        3.5.3. List of Raw Material Suppliers
        3.5.4. List of Existing and Potential Buyer’s
    3.6. Investment Feasibility Matrix
    3.7. Value Chain Analysis
        3.7.1. Profit Margin Analysis
        3.7.2. Wholesalers and Distributors
        3.7.3. Retailers
    3.8. PESTLE and Porter’s Analysis
    3.9. Regulatory Landscape
        3.9.1. By Key Regions
        3.9.2. By Key Countries
    3.10. Regional Parent Market Outlook
    3.11. Production and Consumption Statistics
    3.12. Import and Export Statistics
4. Global Market Analysis 2018 to 2022 and Forecast, 2023 to 2033
    4.1. Historical Market Size Value (US$ Million) & Volume (Units) Analysis, 2018 to 2022
    4.2. Current and Future Market Size Value (US$ Million) & Volume (Units) Projections, 2023 to 2033
        4.2.1. Y-o-Y Growth Trend Analysis
        4.2.2. Absolute $ Opportunity Analysis
5. Global Market Analysis 2018 to 2022 and Forecast 2023 to 2033, By Product Type
    5.1. Introduction / Key Findings
    5.2. Historical Market Size Value (US$ Million) & Volume (Units) Analysis By Product Type, 2018 to 2022
    5.3. Current and Future Market Size Value (US$ Million) & Volume (Units) Analysis and Forecast By Product Type, 2023 to 2033
        5.3.1. Crates
        5.3.2. Trays
        5.3.3. Corrugated Boxes
        5.3.4. Cartons
    5.4. Y-o-Y Growth Trend Analysis By Product Type, 2018 to 2022
    5.5. Absolute $ Opportunity Analysis By Product Type, 2023 to 2033
6. Global Market Analysis 2018 to 2022 and Forecast 2023 to 2033, By Material Type
    6.1. Introduction / Key Findings
    6.2. Historical Market Size Value (US$ Million) & Volume (Units) Analysis By Material Type, 2018 to 2022
    6.3. Current and Future Market Size Value (US$ Million) & Volume (Units) Analysis and Forecast By Material Type, 2023 to 2033
        6.3.1. Paper Board
        6.3.2. Wood
        6.3.3. Plastic
        6.3.4. Foam
    6.4. Y-o-Y Growth Trend Analysis By Material Type, 2018 to 2022
    6.5. Absolute $ Opportunity Analysis By Material Type, 2023 to 2033
7. Global Market Analysis 2018 to 2022 and Forecast 2023 to 2033, By Application
    7.1. Introduction / Key Findings
    7.2. Historical Market Size Value (US$ Million) & Volume (Units) Analysis By Application, 2018 to 2022
    7.3. Current and Future Market Size Value (US$ Million) & Volume (Units) Analysis and Forecast By Application, 2023 to 2033
        7.3.1. Dairy Products
        7.3.2. Wine
        7.3.3. Sauce
        7.3.4. Juices
        7.3.5. Beer
        7.3.6. Oil
    7.4. Y-o-Y Growth Trend Analysis By Application, 2018 to 2022
    7.5. Absolute $ Opportunity Analysis By Application, 2023 to 2033
8. Global Market Analysis 2018 to 2022 and Forecast 2023 to 2033, By Region
    8.1. Introduction
    8.2. Historical Market Size Value (US$ Million) & Volume (Units) Analysis By Region, 2018 to 2022
    8.3. Current Market Size Value (US$ Million) & Volume (Units) Analysis and Forecast By Region, 2023 to 2033
        8.3.1. North America
        8.3.2. Latin America
        8.3.3. Western Europe
        8.3.4. Eastern Europe
        8.3.5. South Asia and Pacific
        8.3.6. East Asia
        8.3.7. Middle East and Africa
    8.4. Market Attractiveness Analysis By Region
9. North America Market Analysis 2018 to 2022 and Forecast 2023 to 2033, By Country
    9.1. Historical Market Size Value (US$ Million) & Volume (Units) Trend Analysis By Market Taxonomy, 2018 to 2022
    9.2. Market Size Value (US$ Million) & Volume (Units) Forecast By Market Taxonomy, 2023 to 2033
        9.2.1. By Country
            9.2.1.1. U.S.
            9.2.1.2. Canada
        9.2.2. By Product Type
        9.2.3. By Material Type
        9.2.4. By Application
    9.3. Market Attractiveness Analysis
        9.3.1. By Country
        9.3.2. By Product Type
        9.3.3. By Material Type
        9.3.4. By Application
    9.4. Key Takeaways
10. Latin America Market Analysis 2018 to 2022 and Forecast 2023 to 2033, By Country
    10.1. Historical Market Size Value (US$ Million) & Volume (Units) Trend Analysis By Market Taxonomy, 2018 to 2022
    10.2. Market Size Value (US$ Million) & Volume (Units) Forecast By Market Taxonomy, 2023 to 2033
        10.2.1. By Country
            10.2.1.1. Brazil
            10.2.1.2. Mexico
            10.2.1.3. Rest of Latin America
        10.2.2. By Product Type
        10.2.3. By Material Type
        10.2.4. By Application
    10.3. Market Attractiveness Analysis
        10.3.1. By Country
        10.3.2. By Product Type
        10.3.3. By Material Type
        10.3.4. By Application
    10.4. Key Takeaways
11. Western Europe Market Analysis 2018 to 2022 and Forecast 2023 to 2033, By Country
    11.1. Historical Market Size Value (US$ Million) & Volume (Units) Trend Analysis By Market Taxonomy, 2018 to 2022
    11.2. Market Size Value (US$ Million) & Volume (Units) Forecast By Market Taxonomy, 2023 to 2033
        11.2.1. By Country
            11.2.1.1. Germany
            11.2.1.2. U.K.
            11.2.1.3. France
            11.2.1.4. Spain
            11.2.1.5. Italy
            11.2.1.6. Rest of Western Europe
        11.2.2. By Product Type
        11.2.3. By Material Type
        11.2.4. By Application
    11.3. Market Attractiveness Analysis
        11.3.1. By Country
        11.3.2. By Product Type
        11.3.3. By Material Type
        11.3.4. By Application
    11.4. Key Takeaways
12. Eastern Europe Market Analysis 2018 to 2022 and Forecast 2023 to 2033, By Country
    12.1. Historical Market Size Value (US$ Million) & Volume (Units) Trend Analysis By Market Taxonomy, 2018 to 2022
    12.2. Market Size Value (US$ Million) & Volume (Units) Forecast By Market Taxonomy, 2023 to 2033
        12.2.1. By Country
            12.2.1.1. Poland
            12.2.1.2. Russia
            12.2.1.3. Czech Republic
            12.2.1.4. Romania
            12.2.1.5. Rest of Eastern Europe
        12.2.2. By Product Type
        12.2.3. By Material Type
        12.2.4. By Application
    12.3. Market Attractiveness Analysis
        12.3.1. By Country
        12.3.2. By Product Type
        12.3.3. By Material Type
        12.3.4. By Application
    12.4. Key Takeaways
13. South Asia and Pacific Market Analysis 2018 to 2022 and Forecast 2023 to 2033, By Country
    13.1. Historical Market Size Value (US$ Million) & Volume (Units) Trend Analysis By Market Taxonomy, 2018 to 2022
    13.2. Market Size Value (US$ Million) & Volume (Units) Forecast By Market Taxonomy, 2023 to 2033
        13.2.1. By Country
            13.2.1.1. India
            13.2.1.2. Bangladesh
            13.2.1.3. Australia
            13.2.1.4. New Zealand
            13.2.1.5. Rest of South Asia and Pacific
        13.2.2. By Product Type
        13.2.3. By Material Type
        13.2.4. By Application
    13.3. Market Attractiveness Analysis
        13.3.1. By Country
        13.3.2. By Product Type
        13.3.3. By Material Type
        13.3.4. By Application
    13.4. Key Takeaways
14. East Asia Market Analysis 2018 to 2022 and Forecast 2023 to 2033, By Country
    14.1. Historical Market Size Value (US$ Million) & Volume (Units) Trend Analysis By Market Taxonomy, 2018 to 2022
    14.2. Market Size Value (US$ Million) & Volume (Units) Forecast By Market Taxonomy, 2023 to 2033
        14.2.1. By Country
            14.2.1.1. China
            14.2.1.2. Japan
            14.2.1.3. South Korea
        14.2.2. By Product Type
        14.2.3. By Material Type
        14.2.4. By Application
    14.3. Market Attractiveness Analysis
        14.3.1. By Country
        14.3.2. By Product Type
        14.3.3. By Material Type
        14.3.4. By Application
    14.4. Key Takeaways
15. Middle East and Africa Market Analysis 2018 to 2022 and Forecast 2023 to 2033, By Country
    15.1. Historical Market Size Value (US$ Million) & Volume (Units) Trend Analysis By Market Taxonomy, 2018 to 2022
    15.2. Market Size Value (US$ Million) & Volume (Units) Forecast By Market Taxonomy, 2023 to 2033
        15.2.1. By Country
            15.2.1.1. GCC Countries
            15.2.1.2. South Africa
            15.2.1.3. Israel
            15.2.1.4. Rest of MEA
        15.2.2. By Product Type
        15.2.3. By Material Type
        15.2.4. By Application
    15.3. Market Attractiveness Analysis
        15.3.1. By Country
        15.3.2. By Product Type
        15.3.3. By Material Type
        15.3.4. By Application
    15.4. Key Takeaways
16. Key Countries Market Analysis
    16.1. U.S.
        16.1.1. Pricing Analysis
        16.1.2. Market Share Analysis, 2022
            16.1.2.1. By Product Type
            16.1.2.2. By Material Type
            16.1.2.3. By Application
    16.2. Canada
        16.2.1. Pricing Analysis
        16.2.2. Market Share Analysis, 2022
            16.2.2.1. By Product Type
            16.2.2.2. By Material Type
            16.2.2.3. By Application
    16.3. Brazil
        16.3.1. Pricing Analysis
        16.3.2. Market Share Analysis, 2022
            16.3.2.1. By Product Type
            16.3.2.2. By Material Type
            16.3.2.3. By Application
    16.4. Mexico
        16.4.1. Pricing Analysis
        16.4.2. Market Share Analysis, 2022
            16.4.2.1. By Product Type
            16.4.2.2. By Material Type
            16.4.2.3. By Application
    16.5. Germany
        16.5.1. Pricing Analysis
        16.5.2. Market Share Analysis, 2022
            16.5.2.1. By Product Type
            16.5.2.2. By Material Type
            16.5.2.3. By Application
    16.6. U.K.
        16.6.1. Pricing Analysis
        16.6.2. Market Share Analysis, 2022
            16.6.2.1. By Product Type
            16.6.2.2. By Material Type
            16.6.2.3. By Application
    16.7. France
        16.7.1. Pricing Analysis
        16.7.2. Market Share Analysis, 2022
            16.7.2.1. By Product Type
            16.7.2.2. By Material Type
            16.7.2.3. By Application
    16.8. Spain
        16.8.1. Pricing Analysis
        16.8.2. Market Share Analysis, 2022
            16.8.2.1. By Product Type
            16.8.2.2. By Material Type
            16.8.2.3. By Application
    16.9. Italy
        16.9.1. Pricing Analysis
        16.9.2. Market Share Analysis, 2022
            16.9.2.1. By Product Type
            16.9.2.2. By Material Type
            16.9.2.3. By Application
    16.10. Poland
        16.10.1. Pricing Analysis
        16.10.2. Market Share Analysis, 2022
            16.10.2.1. By Product Type
            16.10.2.2. By Material Type
            16.10.2.3. By Application
    16.11. Russia
        16.11.1. Pricing Analysis
        16.11.2. Market Share Analysis, 2022
            16.11.2.1. By Product Type
            16.11.2.2. By Material Type
            16.11.2.3. By Application
    16.12. Czech Republic
        16.12.1. Pricing Analysis
        16.12.2. Market Share Analysis, 2022
            16.12.2.1. By Product Type
            16.12.2.2. By Material Type
            16.12.2.3. By Application
    16.13. Romania
        16.13.1. Pricing Analysis
        16.13.2. Market Share Analysis, 2022
            16.13.2.1. By Product Type
            16.13.2.2. By Material Type
            16.13.2.3. By Application
    16.14. India
        16.14.1. Pricing Analysis
        16.14.2. Market Share Analysis, 2022
            16.14.2.1. By Product Type
            16.14.2.2. By Material Type
            16.14.2.3. By Application
    16.15. Bangladesh
        16.15.1. Pricing Analysis
        16.15.2. Market Share Analysis, 2022
            16.15.2.1. By Product Type
            16.15.2.2. By Material Type
            16.15.2.3. By Application
    16.16. Australia
        16.16.1. Pricing Analysis
        16.16.2. Market Share Analysis, 2022
            16.16.2.1. By Product Type
            16.16.2.2. By Material Type
            16.16.2.3. By Application
    16.17. New Zealand
        16.17.1. Pricing Analysis
        16.17.2. Market Share Analysis, 2022
            16.17.2.1. By Product Type
            16.17.2.2. By Material Type
            16.17.2.3. By Application
    16.18. China
        16.18.1. Pricing Analysis
        16.18.2. Market Share Analysis, 2022
            16.18.2.1. By Product Type
            16.18.2.2. By Material Type
            16.18.2.3. By Application
    16.19. Japan
        16.19.1. Pricing Analysis
        16.19.2. Market Share Analysis, 2022
            16.19.2.1. By Product Type
            16.19.2.2. By Material Type
            16.19.2.3. By Application
    16.20. South Korea
        16.20.1. Pricing Analysis
        16.20.2. Market Share Analysis, 2022
            16.20.2.1. By Product Type
            16.20.2.2. By Material Type
            16.20.2.3. By Application
    16.21. GCC Countries
        16.21.1. Pricing Analysis
        16.21.2. Market Share Analysis, 2022
            16.21.2.1. By Product Type
            16.21.2.2. By Material Type
            16.21.2.3. By Application
    16.22. South Africa
        16.22.1. Pricing Analysis
        16.22.2. Market Share Analysis, 2022
            16.22.2.1. By Product Type
            16.22.2.2. By Material Type
            16.22.2.3. By Application
    16.23. Israel
        16.23.1. Pricing Analysis
        16.23.2. Market Share Analysis, 2022
            16.23.2.1. By Product Type
            16.23.2.2. By Material Type
            16.23.2.3. By Application
17. Market Structure Analysis
    17.1. Competition Dashboard
    17.2. Competition Benchmarking
    17.3. Market Share Analysis of Top Players
        17.3.1. By Regional
        17.3.2. By Product Type
        17.3.3. By Material Type
        17.3.4. By Application
18. Competition Analysis
    18.1. Competition Deep Dive
        18.1.1. Sonoco Products Company
            18.1.1.1. Overview
            18.1.1.2. Product Portfolio
            18.1.1.3. Profitability by Market Segments
            18.1.1.4. Sales Footprint
            18.1.1.5. Strategy Overview
                18.1.1.5.1. Marketing Strategy
                18.1.1.5.2. Product Strategy
                18.1.1.5.3. Channel Strategy
        18.1.2. DS Smith Plc.
            18.1.2.1. Overview
            18.1.2.2. Product Portfolio
            18.1.2.3. Profitability by Market Segments
            18.1.2.4. Sales Footprint
            18.1.2.5. Strategy Overview
                18.1.2.5.1. Marketing Strategy
                18.1.2.5.2. Product Strategy
                18.1.2.5.3. Channel Strategy
        18.1.3. Western Pulp Products Company
            18.1.3.1. Overview
            18.1.3.2. Product Portfolio
            18.1.3.3. Profitability by Market Segments
            18.1.3.4. Sales Footprint
            18.1.3.5. Strategy Overview
                18.1.3.5.1. Marketing Strategy
                18.1.3.5.2. Product Strategy
                18.1.3.5.3. Channel Strategy
        18.1.4. RADVA Corporation
            18.1.4.1. Overview
            18.1.4.2. Product Portfolio
            18.1.4.3. Profitability by Market Segments
            18.1.4.4. Sales Footprint
            18.1.4.5. Strategy Overview
                18.1.4.5.1. Marketing Strategy
                18.1.4.5.2. Product Strategy
                18.1.4.5.3. Channel Strategy
        18.1.5. Packaging Services Industries
            18.1.5.1. Overview
            18.1.5.2. Product Portfolio
            18.1.5.3. Profitability by Market Segments
            18.1.5.4. Sales Footprint
            18.1.5.5. Strategy Overview
                18.1.5.5.1. Marketing Strategy
                18.1.5.5.2. Product Strategy
                18.1.5.5.3. Channel Strategy
        18.1.6. Saxon Packaging Limited
            18.1.6.1. Overview
            18.1.6.2. Product Portfolio
            18.1.6.3. Profitability by Market Segments
            18.1.6.4. Sales Footprint
            18.1.6.5. Strategy Overview
                18.1.6.5.1. Marketing Strategy
                18.1.6.5.2. Product Strategy
                18.1.6.5.3. Channel Strategy
        18.1.7. Polar Tech Industries Inc.
            18.1.7.1. Overview
            18.1.7.2. Product Portfolio
            18.1.7.3. Profitability by Market Segments
            18.1.7.4. Sales Footprint
            18.1.7.5. Strategy Overview
                18.1.7.5.1. Marketing Strategy
                18.1.7.5.2. Product Strategy
                18.1.7.5.3. Channel Strategy
        18.1.8. Nakpack
            18.1.8.1. Overview
            18.1.8.2. Product Portfolio
            18.1.8.3. Profitability by Market Segments
            18.1.8.4. Sales Footprint
            18.1.8.5. Strategy Overview
                18.1.8.5.1. Marketing Strategy
                18.1.8.5.2. Product Strategy
                18.1.8.5.3. Channel Strategy
        18.1.9. Mondi Plc
            18.1.9.1. Overview
            18.1.9.2. Product Portfolio
            18.1.9.3. Profitability by Market Segments
            18.1.9.4. Sales Footprint
            18.1.9.5. Strategy Overview
                18.1.9.5.1. Marketing Strategy
                18.1.9.5.2. Product Strategy
                18.1.9.5.3. Channel Strategy
        18.1.10. UFP Technlologies Inc
            18.1.10.1. Overview
            18.1.10.2. Product Portfolio
            18.1.10.3. Profitability by Market Segments
            18.1.10.4. Sales Footprint
            18.1.10.5. Strategy Overview
                18.1.10.5.1. Marketing Strategy
                18.1.10.5.2. Product Strategy
                18.1.10.5.3. Channel Strategy
        18.1.11. The Spirited Shipper
            18.1.11.1. Overview
            18.1.11.2. Product Portfolio
            18.1.11.3. Profitability by Market Segments
            18.1.11.4. Sales Footprint
            18.1.11.5. Strategy Overview
                18.1.11.5.1. Marketing Strategy
                18.1.11.5.2. Product Strategy
                18.1.11.5.3. Channel Strategy
        18.1.12. Gorilla Shipper
            18.1.12.1. Overview
            18.1.12.2. Product Portfolio
            18.1.12.3. Profitability by Market Segments
            18.1.12.4. Sales Footprint
            18.1.12.5. Strategy Overview
                18.1.12.5.1. Marketing Strategy
                18.1.12.5.2. Product Strategy
                18.1.12.5.3. Channel Strategy
19. Assumptions & Acronyms Used
20. Research Methodology
Recommendations

Packaging

Reagent Bottle Market

January 2023

REP-GB-13504

280 pages

Packaging

Coffee Bottle Market

January 2023

REP-GB-13553

250 pages

Packaging

Carton Bottle Market

October 2022

REP-GB-5931

250 pages

Explore Packaging Insights

View Reports
Future Market Insights

Bottle Shippers Market

Schedule a Call