Bottle Filling Machines Market
Get an In-depth Analysis of Emerging Trends Changing Bottle Filling Machines Market Dynamics
Bottle Filling Machines Market by Operating Type, Bottling Speed, End-Use Industry & Region - Forecast 2022-2032
Bottle Filling Machines Market Outlook (2022-2032)
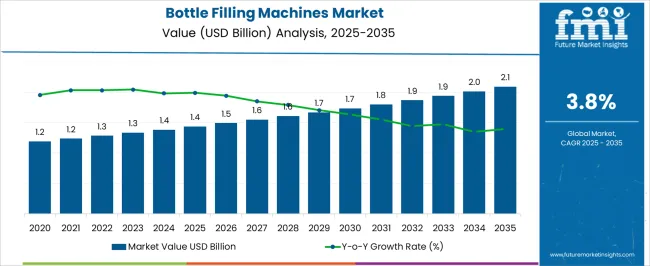
[202 Pages Report] Registering a year-on-year (Y-o-Y) growth rate of 4%, the global bottle filling machines market size reached around US$ 1.24 Bn in 2021 and is likely to touch a valuation of US$ 1.28 Bn in 2022.
Furthermore, with rising adoption across industries like food & beverages, pharmaceutical, oil & lubricants, and cosmetics, the overall demand for bottle filling machines is poised to grow at a steady CAGR of 4.0% between 2022 and 2032, totaling US$ 1.9 Bn by 2032.
Attributes |
Key Statistics |
Bottle Filling Machines Market Size (2022E) |
US$ 1.2 Bn |
Projected Market Size (2032F) |
US$ 1.9 Bn |
Value-based CAGR (2022-2032) |
4.0% |
Top 3 Countries Market Share |
34.0% |
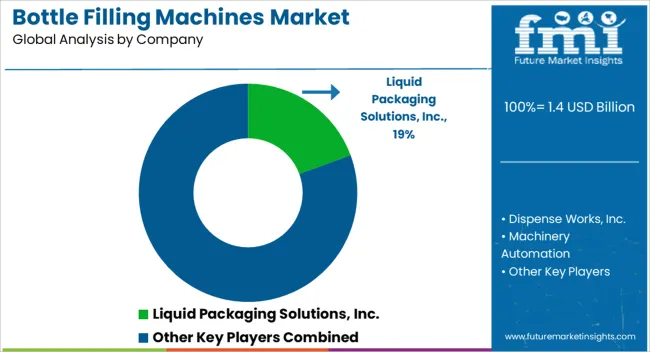
The global bottle filling machines market accounts for approximately 2% to 3% share of the global packaging machinery market, which is valued at US$ 60 billion in 2022. Similarly, recent data reveals that the top five vendors will own 10-15% of the bottling machines market in 2022.
Bottle filling machines are equipment used for filling liquids and powders into bottles and other containers. They are suitable for large-scale filling of containers with fast and accurate measurements.
Filling large-scale materials and substances manually into bottles and containers generally takes longer time. In order to make this task easier, faster, and more accurate, industries employ bottle filling machines. This is providing a major impetus to the growth of bottles filling machines market.
Bottle filling machines help industries like food & beverages, chemical, and pharmaceutical to improve their productivity and reduce labour costs by allowing them to quickly fill materials in containers such as bottles and jars while maintaining volume and weight.
Let us know your requirement to get
100% FREE customization
2015 -2021 Global Bottle Filling Machines Market Outlook Compared to 2022-2032 Forecast:
The global demand for bottle machines is projected to grow at a CAGR of 4% between 2022 and 2032, in comparison to 3.3% CAGR registered from 2015 to 2021. Growing usage of bottle filling machines across diverse industries including food & beverages, and pharmaceuticals is a key factor driving growth in the global bottles filling machines market.
Bottle filling machines offer various benefits such as higher accuracy, optimal filling speed, less power consumption, and better hygiene. As a result, they are being increasingly installed across various industries to improve the overall productivity.
Rapid expansion of industries like food & beverages, pharmaceutical, chemicals & fertilizer, oils & lubricants, cosmetics & personal care, etc. due to rapidly growing population, changing lifestyle, and economic boom is expected to create lucrative opportunities for bottle filling machines manufacturers during the forecast period.
What are the Key Trends Driving the Global Bottle Filling Machines Market?
“ Increasing Consumption of Cosmetic Products Boosting Sales of Bottle Filling Machines”
Over the years, rising disposable income and changing lifestyle has resulted in the surge in cosmetics consumption across the world. People are spending large amounts on cosmetic products like perfumes, shampoos, skin moisturizers, and hair oils. As these cosmetic products are mostly packed and stored in bottles and other containers, rise in their production and consumption will continue to trigger sales of bottle filling machines.
Leading cosmetics manufacturers are increasingly employing bottle filling machines in their facilities to facilitate the filing of various products in bottles and other containers.
Demand for bottle machines is especially rising across European countries like Germany and France due to booming cosmetics and personal care industry. For instance, according to Cosmetic Europe, European cosmetics and personal care industry reached a valuation of US$ 80 billion in 2021 and this number is expected to further surge during the forthcoming years. This will create strong demand for bottle filling machines in the region.
Find your sweet spots for generating winning opportunities in this market.
Talk to AnalystCountry-wise insights
Will the U.S. Continue to Dominate Bottle Filling Machines Market?
“Growing Adoption of Advanced Technologies Pushing Sales of Bottle Filling Machines in the U.S.”
Over the years, the U.S. has become one of the most dominating bottle filling machines markets and the trend is likely to continue during the forecast period.
As per FMI, the U.S. bottle filling machines market size was valued at US$ 222 Mn in 2021 and is expected to reach US$ 320 Mn by 2032, exhibiting a CAGR of 3.2% during the forecast period. Growth in the U.S. bottle machines market is driven by rising consumption of beverages like wine, growing adoption of advanced technologies, and strong presence of leading bottle filling machines manufacturers.
According to data released by the Wine Institute of the United States, the wine business generates about US$ 114 billion in economic activity annually and employs a total of about 800,000 Americans. Furthermore, average consumption per U.S. resident was about 12 bottles in 2021.This rise in wine consumption is prompting manufacturers to employ bottle filling machines to improve their productivity as well as to reduce labour costs.
What is the Demand Outlook for Bottle Filling Machines Market in India?
“Rapid Expansion of End-Use Industries Pushing Demand for Bottle Filling Machines in India”
As per FMI, demand for bottle filling machines is expected to grow at the fastest CAGR of 5% across India during the forecast period from 2022 and 2032. This can be attributed to the rapid expansion of end-use industries like food & beverages, chemicals & fertilizers, and pharmaceuticals, booming export business, rising penetration of automation.
Similarly, increasing production of cooking oils like mustard oil will boost sales of bottle filling machines in India during the forecast period.
By the end of 2032, the Indian bottle filling machines market is anticipated to create an incremental $ opportunity of around US$ 55 Mn.
Category-wise Insights
Why is Demand for Automatic Bottle Filling Machines Rising?
“Faster Speed and Error Free Nature of Automatic Bottle Filling Machines Pushing Their Sales”
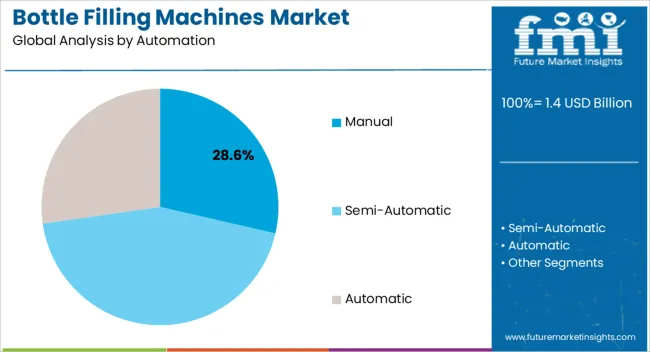
Based on operating type, demand for automatic bottle filling machines is likely to grow at the highest CAGR of 5% during the forecast period, totalling approximately US$ 440 million by 2032. This can be attributed to the rising end user preference for automatic machines on account of their various benefits including faster nature and error reduction.
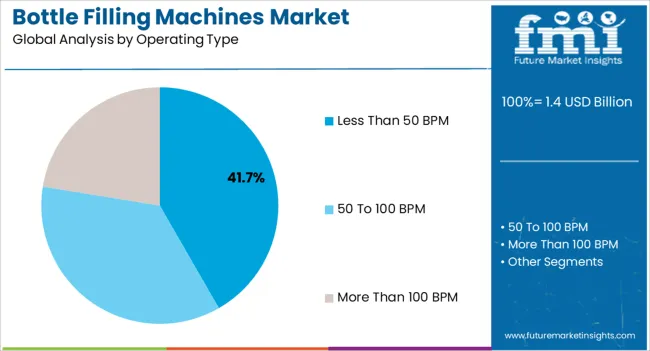
Automatic bottle filling machines can fill more than 100 bottles per minute and can thus save time as well as reduce labor costs.
Which End-Use Industry Dominates the Global Bottle Filling Machines Market?
“Majority of the Bottle Filling Machines Sales to Remain Concentrated in Food & Beverages Industry”
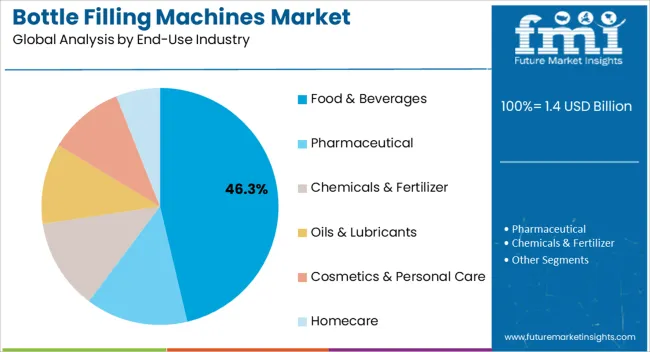
As per FMI, the food & beverages segment will continue to lead the global bottle filling machines market during the forecast period. This is due to the rising adoption of bottle filling machines across food and beverage industry.
Most of the food and beverage manufacturers today employ bottle filling machines to increase their productivity and cut labour costs. Thus, rapid expansion of food and beverage industry due to increasing consumption of processed foods, beverages, and other products will continue to support growth of the bottle filling machines market over the next decade.
The food & beverages segment is expected to grow at a CAGR of 4.9% between 2022 and 2032, generating market revenues worth US$ 610 Mn by 2032.

An unified Market Research Subscription Platform, built for today’s disparate research needs.
Competitive Landscape
Presence of a large number of local and regional players has made bottle filling machines market fragmented and competitive in nature. Key players use a variety of strategies including new product launches, mergers & acquisitions, expansions, collaborations, and partnerships to gain an upper hand in the market.
For instance,
- In June 2022, Preach, a worldwide leader in packaging machinery solutions, acquired Reepack, one of the leading manufacturers of high-quality flexible packaging machinery. The acquisition will help the company to continue expansion in the food packaging space.
- In August 2019, Ecolean, a global producer of lightweight packaging solutions for both ambient and chilled distribution of liquid food, launched EL1+filling machines with increased capacity up to 140%
- In November 2021, SIG unveiled SIG NEO, the next generation filling technology.
- In September 2022, PACK`R opened a new facility in Singapore.
Similarly, startups like Machpack Process Machines Pvt. Ltd. are introducing quality bottle packaging machinery & process equipment to meet the requirements of various segments including pharmaceutical, ayurvedic, cosmetic, lubrication oil, edible oil, chemical and many more.
Scope of the Report
Attribute |
Details |
Estimated Market Size (2022) |
US$ 1.28 Bn |
Projected Market Size (2032) |
US$ 1.9 Bn |
Anticipated Growth rate (2022-2032) |
4% |
Historical Data |
2015-2021 |
Forecast Period |
2022-2032 |
Quantitative Units |
Revenue in US$ Million, Volume in Units and CAGR from 2022-2032 |
Segment Covered |
|
Regions Covered |
|
Key Countries Profiled |
|
Key Companies Profiled |
|
Report Coverage |
Market Forecast, Company Share Analysis, Competition Intelligence, DROT Analysis, Market Dynamics and Challenges, and Strategic Growth Initiatives |
Bottle Filling Machines Market Segmentation
By Automation:
- Manual
- Semi-automatic
- Automatic
By Operating Type:
- Less than 50 BPM
- 50 to 100 BPM
- More than 100 BPM
By End-Use Industry:
- Food & Beverages
- Pharmaceutical
- Chemicals & Fertilizer
- Oils & Lubricants
- Cosmetics & Personal Care
- Homecare
By Region:
- North America
- Latin America
- Europe
- South Asia
- East Asia
- Middle East & Africa
- Oceania
Frequently Asked Questions
The global bottle filling machines market size was valued at US$ 1.24 Bn in 2021 and is expected to 1.28 Bn by 2032.
The global bottle filling machines market is projected to reach a valuation of US$ 1.9 Bn by 2032
Developments of advanced bottle filling machines and rapid expansion of industries like food & beverages, homecare, cosmetics etc. are expected to boost the market.
Food & beverages segment dominated the global bottle filling machines market with an estimated market valuation of US$ 380 Mn in 2022.
Table of Content
1. Executive Summary
1.1. Global Market Outlook
1.2. Demand-side Trends
1.3. Supply-side Trends
1.4. Technology Roadmap Analysis
1.5. Analysis and Recommendations
2. Market Overview
2.1. Market Coverage / Taxonomy
2.2. Market Definition / Scope / Limitations
3. Market Background
3.1. Market Dynamics
3.1.1. Drivers
3.1.2. Restraints
3.1.3. Opportunity
3.1.4. Trends
3.2. Impact of Covid-19
3.2.1. Demand in Optimistic Scenario
3.2.2. Demand in Likely Scenario
3.2.3. Demand in Conservative Scenario
3.3. Macro Factors and Forecast Factors
3.4. Value Chain Analysis
3.4.1. Profit Margin Analysis
3.4.2. Raw Operating Type Suppliers
3.4.3. Manufacturers, Wholesalers and Distributors
3.4.4. End Users/ Customers
3.5. Regional Parent Market Outlook
3.6. Production and Consumption Statistics
3.7. Global Average Pricing Analysis Benchmark
4. Global Bottle Filling Machines Market Analysis 2015-2021 and Forecast, 2022-2032
4.1. Historical Market Size Value (US$ Mn) & Volume (Units) Analysis, 2015-2021
4.2. Current and Future Market Size Value (US$ Mn) & Volume (Units) Projections, 2022-2032
4.2.1. Y-o-Y Growth Trend Analysis
4.2.2. Absolute $ Opportunity Analysis
5. Global Bottle Filling Machines Market Analysis 2015–2021 and Forecast 2022–2032, By Operating Type
5.1. Introduction / Key Findings
5.2. Historical Market Size Value (US$ Mn) & Volume (Units) Analysis by Operating type, 2015-2021
5.3. Current and Future Market Size Value (US$ Mn) & Volume (Units) Analysis and Forecast by Operating type, 2022-2032
5.3.1. Manual
5.3.2. Semi-automatic
5.3.3. Automatic
5.4. Y-o-Y Growth Trend Analysis by Operating type, 2015-2021
5.5. Absolute $ Opportunity Analysis by Operating type, 2022-2032
6. Global Bottle Filling Machines Market Analysis 2015–2021 and Forecast 2022–2032, By Bottling Speed
6.1. Introduction / Key Findings
6.2. Historical Market Size Value (US$ Mn) & Volume (Units) Analysis by Bottling Speed, 2015-2021
6.3. Current and Future Market Size Value (US$ Mn) & Volume (Units) Analysis and Forecast by Bottling Speed, 2022-2032
6.3.1. Less than 50 BPM
6.3.2. 50 to 100 BPM
6.3.3. More than 100 BPM
6.4. Y-o-Y Growth Trend Analysis by Bottling Speed, 2015-2021
6.5. Absolute $ Opportunity Analysis by Bottling Speed, 2022-2032
7. Global Bottle Filling Machines Market Analysis 2015–2021 and Forecast 2022–2032, By End-Use Industry
7.1. Introduction / Key Findings
7.2. Historical Market Size Value (US$ Mn) & Volume (Units) Analysis by End-Use Industry, 2015-2021
7.3. Current and Future Market Size Value (US$ Mn) & Volume (Units) Analysis and Forecast by End-Use Industry, 2022-2032
7.3.1. Food & Beverages
7.3.2. Pharmaceutical
7.3.3. Chemicals & Fertilizer
7.3.4. Oils & Lubricants
7.3.5. Cosmetics & Personal Care
7.3.6. Homecare
7.4. Y-o-Y Growth Trend Analysis by End-Use Industry, 2015-2021
7.5. Absolute $ Opportunity Analysis by End-Use Industry, 2022-2032
8. Global Bottle Filling Machines Market Analysis 2015–2021 and Forecast 2022–2032, by Region
8.1. Introduction / Key Findings
8.2. Historical Market Size Value (US$ Mn) & Volume (Units) Analysis by Region, 2015-2021
8.3. Current and Future Market Size Value (US$ Mn) & Volume (Units) Analysis and Forecast by Region, 2022-2032
8.3.1. North America
8.3.2. Latin America
8.3.3. Europe
8.3.4. East Asia
8.3.5. South Asia
8.3.6. Oceania
8.3.7. Middle East and Africa (MEA)
8.4. Market Attractiveness Analysis, by Region
9. North America Bottle Filling Machines Market Analysis 2015–2021 and Forecast 2022–2032, By Country
9.1. Historical Market Size Value (US$ Mn) & Volume (Units) Trend Analysis by Market Taxonomy, 2015-2021
9.2. Market Size Value (US$ Mn) & Volume (Units) Forecast by Market Taxonomy, 2022-2032
9.2.1. By Country
9.2.1.1. U.S.
9.2.1.2. Canada
9.2.2. By Operating type
9.2.3. By Bottling Speed
9.2.4. By End-Use Industry
9.3. Market Attractiveness Analysis
9.3.1. By Country
9.3.2. By Operating type
9.3.3. By Bottling Speed
9.3.4. By End-Use Industry
9.4. Key Takeaways
10. Latin America Bottle Filling Machines Market Analysis 2015–2021 and Forecast 2022–2032, By Country
10.1. Historical Market Size Value (US$ Mn) & Volume (Units) Trend Analysis by Market Taxonomy, 2015-2021
10.2. Market Size Value (US$ Mn) & Volume (Units) Forecast by Market Taxonomy, 2022-2032
10.2.1. By Country
10.2.1.1. Brazil
10.2.1.2. Mexico
10.2.1.3. Argentina
10.2.1.4. Chile
10.2.1.5. Peru
10.2.1.6. Rest of Latin America
10.2.2. By Operating type
10.2.3. By Bottling Speed
10.2.4. By End-Use Industry
10.3. Market Attractiveness Analysis
10.3.1. By Country
10.3.2. By Operating type
10.3.3. By Bottling Speed
10.3.4. By End-Use Industry
10.4. Key Takeaways
11. Europe Bottle Filling Machines Market Analysis 2015–2021 and Forecast 2022–2032, By Country
11.1. Historical Market Size Value (US$ Mn) & Volume (Units) Trend Analysis by Market Taxonomy, 2015-2021
11.2. Market Size Value (US$ Mn) & Volume (Units) Forecast by Market Taxonomy, 2022-2032
11.2.1. By Country
11.2.1.1. Germany
11.2.1.2. Italy
11.2.1.3. France
11.2.1.4. U.K.
11.2.1.5. Spain
11.2.1.6. BENELUX
11.2.1.7. Nordic
11.2.1.8. Russia
11.2.1.9. Poland
11.2.1.10. Rest of Europe
11.2.2. By Operating type
11.2.3. By Bottling Speed
11.2.4. By End-Use Industry
11.3. Market Attractiveness Analysis
11.3.1. By Country
11.3.2. By Operating type
11.3.3. By Bottling Speed
11.3.4. By End-Use Industry
11.4. Key Takeaways
12. East Asia Bottle Filling Machines Market Analysis 2015–2021 and Forecast 2022–2032, By Country
12.1. Historical Market Size Value (US$ Mn) & Volume (Units) Trend Analysis by Market Taxonomy, 2015-2021
12.2. Market Size Value (US$ Mn) & Volume (Units) Forecast by Market Taxonomy, 2022-2032
12.2.1. By Country
12.2.1.1. China
12.2.1.2. Japan
12.2.1.3. South Korea
12.2.2. By Operating type
12.2.3. By Bottling Speed
12.2.4. By End-Use Industry
12.3. Market Attractiveness Analysis
12.3.1. By Country
12.3.2. By Operating type
12.3.3. By Bottling Speed
12.3.4. By End-Use Industry
12.4. Key Takeaways
13. South Asia Bottle Filling Machines Market Analysis 2015–2021 and Forecast 2022–2032, By Country
13.1. Historical Market Size Value (US$ Mn) & Volume (Units) Trend Analysis by Market Taxonomy, 2015-2021
13.2. Market Size Value (US$ Mn) & Volume (Units) Forecast by Market Taxonomy, 2022-2032
13.2.1. By Country
13.2.1.1. India
13.2.1.2. Thailand
13.2.1.3. Malaysia
13.2.1.4. Indonesia
13.2.1.5. Rest of South Asia
13.2.2. By Operating type
13.2.3. By Bottling Speed
13.2.4. By End-Use Industry
13.3. Market Attractiveness Analysis
13.3.1. By Country
13.3.2. By Operating type
13.3.3. By Bottling Speed
13.3.4. By End-Use Industry
13.4. Key Takeaways
14. Oceania Bottle Filling Machines Market Analysis 2015–2021 and Forecast 2022–2032, By Country
14.1. Historical Market Size Value (US$ Mn) & Volume (Units) Trend Analysis by Market Taxonomy, 2015-2021
14.2. Market Size Value (US$ Mn) & Volume (Units) Forecast by Market Taxonomy, 2022-2032
14.2.1. By Country
14.2.1.1. Australia
14.2.1.2. New Zealand
14.2.2. By Operating type
14.2.3. By Bottling Speed
14.2.4. By End-Use Industry
14.3. Market Attractiveness Analysis
14.3.1. By Country
14.3.2. By Operating type
14.3.3. By Bottling Speed
14.3.4. By End-Use Industry
14.4. Key Takeaways
15. Middle East & Africa Bottle Filling Machines Market Analysis 2015–2021 and Forecast 2022–2032, By Country
15.1. Historical Market Size Value (US$ Mn) & Volume (Units) Trend Analysis by Market Taxonomy, 2015-2021
15.2. Market Size Value (US$ Mn) & Volume (Units) Forecast by Market Taxonomy, 2022-2032
15.2.1. By Country
15.2.1.1. GCC Countries
15.2.1.2. Turkey
15.2.1.3. Northern Africa
15.2.1.4. South Africa
15.2.1.5. Rest of MEA
15.2.2. By Operating type
15.2.3. By Bottling Speed
15.2.4. By End-Use Industry
15.3. Market Attractiveness Analysis
15.3.1. By Country
15.3.2. By Operating type
15.3.3. By Bottling Speed
15.3.4. By End-Use Industry
15.4. Key Takeaways
16. Country wise Bottle Filling Machines Market Analysis
16.1. United States (U.S.)
16.1.1. Market Share Analysis, 2022
16.1.2. By Operating type
16.1.3. By Bottling Speed
16.1.4. By End-Use Industry
16.2. Canada
16.2.1. Market Share Analysis, 2022
16.2.2. By Operating type
16.2.3. By Bottling Speed
16.2.4. By End-Use Industry
16.3. Brazil
16.3.1. Market Share Analysis, 2022
16.3.2. By Operating type
16.3.3. By Bottling Speed
16.3.4. By End-Use Industry
16.4. Mexico
16.4.1. Market Share Analysis, 2022
16.4.2. By Operating type
16.4.3. By Bottling Speed
16.4.4. By End-Use Industry
16.5. Germany
16.5.1. Market Share Analysis, 2022
16.5.2. By Operating type
16.5.3. By Bottling Speed
16.5.4. By End-Use Industry
16.6. Italy
16.6.1. Market Share Analysis, 2022
16.6.2. By Operating type
16.6.3. By Bottling Speed
16.6.4. By End-Use Industry
16.7. France
16.7.1. Market Share Analysis, 2022
16.7.2. By Operating type
16.7.3. By Bottling Speed
16.7.4. By End-Use Industry
16.8. Spain
16.8.1. Market Share Analysis, 2022
16.8.2. By Operating type
16.8.3. By Bottling Speed
16.8.4. By End-Use Industry
16.9. U.K.
16.9.1. Market Share Analysis, 2022
16.9.2. By Operating type
16.9.3. By Bottling Speed
16.9.4. By End-Use Industry
16.10. Russia
16.10.1. Market Share Analysis, 2022
16.10.2. By Operating type
16.10.3. By Bottling Speed
16.10.4. By End-Use Industry
16.11. China
16.11.1. Market Share Analysis, 2022
16.11.2. By Operating type
16.11.3. By Bottling Speed
16.11.4. By End-Use Industry
16.12. Japan
16.12.1. Market Share Analysis, 2022
16.12.2. By Operating type
16.12.3. By Bottling Speed
16.12.4. By End-Use Industry
16.13. India
16.13.1. Market Share Analysis, 2022
16.13.2. By Operating type
16.13.3. By Bottling Speed
16.13.4. By End-Use Industry
16.14. GCC Countries
16.14.1. Market Share Analysis, 2022
16.14.2. By Operating type
16.14.3. By Bottling Speed
16.14.4. By End-Use Industry
16.15. Australia
16.15.1. Market Share Analysis, 2022
16.15.2. By Operating type
16.15.3. By Bottling Speed
16.15.4. By End-Use Industry
17. Market Structure Analysis
17.1. Competition Dashboard
17.2. Competition Benchmarking
17.3. Market Share Analysis of Top Players
17.3.1. By Region
17.3.2. By Product Portfolio
18. Competition Analysis
18.1. Competition Deep Dive
18.1.1. Liquid Packaging Solutions, Inc.
18.1.1.1. Overview
18.1.1.2. Product Portfolio
18.1.1.3. Profitability by Market Segments (Product/Channel/Region)
18.1.1.4. Sales Footprint
18.1.1.5. Strategy Overview
18.1.1.5.1. Marketing Strategy
18.1.1.5.2. Product Strategy
18.1.1.5.3. Channel Strategy
18.1.2. Dispense Works, Inc.
18.1.2.1. Overview
18.1.2.2. Product Portfolio
18.1.2.3. Profitability by Market Segments (Product/Channel/Region)
18.1.2.4. Sales Footprint
18.1.2.5. Strategy Overview
18.1.2.5.1. Marketing Strategy
18.1.2.5.2. Product Strategy
18.1.2.5.3. Channel Strategy
18.1.3. Machinesry Operating type
18.1.3.1. Overview
18.1.3.2. Product Portfolio
18.1.3.3. Profitability by Market Segments (Product/Channel/Region)
18.1.3.4. Sales Footprint
18.1.3.5. Strategy Overview
18.1.3.5.1. Marketing Strategy
18.1.3.5.2. Product Strategy
18.1.3.5.3. Channel Strategy
18.1.4. ProMach
18.1.4.1. Overview
18.1.4.2. Product Portfolio
18.1.4.3. Profitability by Market Segments (Product/Channel/Region)
18.1.4.4. Sales Footprint
18.1.4.5. Strategy Overview
18.1.4.5.1. Marketing Strategy
18.1.4.5.2. Product Strategy
18.1.4.5.3. Channel Strategy
18.1.5. Filamatic
18.1.5.1. Overview
18.1.5.2. Product Portfolio
18.1.5.3. Profitability by Market Segments (Product/Channel/Region)
18.1.5.4. Sales Footprint
18.1.5.5. Strategy Overview
18.1.5.5.1. Marketing Strategy
18.1.5.5.2. Product Strategy
18.1.5.5.3. Channel Strategy
18.1.6. Acasi
18.1.6.1. Overview
18.1.6.2. Product Portfolio
18.1.6.3. Profitability by Market Segments (Product/Channel/Region)
18.1.6.4. Sales Footprint
18.1.6.5. Strategy Overview
18.1.6.5.1. Marketing Strategy
18.1.6.5.2. Product Strategy
18.1.6.5.3. Channel Strategy
18.1.7. APACKS
18.1.7.1. Overview
18.1.7.2. Product Portfolio
18.1.7.3. Profitability by Market Segments (Product/Channel/Region)
18.1.7.4. Sales Footprint
18.1.7.5. Strategy Overview
18.1.7.5.1. Marketing Strategy
18.1.7.5.2. Product Strategy
18.1.7.5.3. Channel Strategy
18.1.8. Co.Mac srl
18.1.8.1. Overview
18.1.8.2. Product Portfolio
18.1.8.3. Profitability by Market Segments (Product/Channel/Region)
18.1.8.4. Sales Footprint
18.1.8.5. Strategy Overview
18.1.8.5.1. Marketing Strategy
18.1.8.5.2. Product Strategy
18.1.8.5.3. Channel Strategy
18.1.9. PACK’R
18.1.9.1. Overview
18.1.9.2. Product Portfolio
18.1.9.3. Profitability by Market Segments (Product/Channel/Region)
18.1.9.4. Sales Footprint
18.1.9.5. Strategy Overview
18.1.9.5.1. Marketing Strategy
18.1.9.5.2. Product Strategy
18.1.9.5.3. Channel Strategy
18.1.10. KBW Packaging
18.1.10.1. Overview
18.1.10.2. Product Portfolio
18.1.10.3. Profitability by Market Segments (Product/Channel/Region)
18.1.10.4. Sales Footprint
18.1.10.5. Strategy Overview
18.1.10.5.1. Marketing Strategy
18.1.10.5.2. Product Strategy
18.1.10.5.3. Channel Strategy
18.1.11. THE ADELPHI GROUP OF COMPANIES
18.1.11.1. Overview
18.1.11.2. Product Portfolio
18.1.11.3. Profitability by Market Segments (Product/Channel/Region)
18.1.11.4. Sales Footprint
18.1.11.5. Strategy Overview
18.1.11.5.1. Marketing Strategy
18.1.11.5.2. Product Strategy
18.1.11.5.3. Channel Strategy
18.1.12. SP Filling Systems Ltd
18.1.12.1. Overview
18.1.12.2. Product Portfolio
18.1.12.3. Profitability by Market Segments (Product/Channel/Region)
18.1.12.4. Sales Footprint
18.1.12.5. Strategy Overview
18.1.12.5.1. Marketing Strategy
18.1.12.5.2. Product Strategy
18.1.12.5.3. Channel Strategy
18.1.13. Flow Tronix
18.1.13.1. Overview
18.1.13.2. Product Portfolio
18.1.13.3. Profitability by Market Segments (Product/Channel/Region)
18.1.13.4. Sales Footprint
18.1.13.5. Strategy Overview
18.1.13.5.1. Marketing Strategy
18.1.13.5.2. Product Strategy
18.1.13.5.3. Channel Strategy
18.1.14. Carbonation Techniques
18.1.14.1. Overview
18.1.14.2. Product Portfolio
18.1.14.3. Profitability by Market Segments (Product/Channel/Region)
18.1.14.4. Sales Footprint
18.1.14.5. Strategy Overview
18.1.14.5.1. Marketing Strategy
18.1.14.5.2. Product Strategy
18.1.14.5.3. Channel Strategy
18.1.15. Countec Co., Ltd.
18.1.15.1. Overview
18.1.15.2. Product Portfolio
18.1.15.3. Profitability by Market Segments (Product/Channel/Region)
18.1.15.4. Sales Footprint
18.1.15.5. Strategy Overview
18.1.15.5.1. Marketing Strategy
18.1.15.5.2. Product Strategy
18.1.15.5.3. Channel Strategy
18.1.16. Siddhivinayak Operating type
18.1.16.1. Overview
18.1.16.2. Product Portfolio
18.1.16.3. Profitability by Market Segments (Product/Channel/Region)
18.1.16.4. Sales Footprint
18.1.16.5. Strategy Overview
18.1.16.5.1. Marketing Strategy
18.1.16.5.2. Product Strategy
18.1.16.5.3. Channel Strategy
18.1.17. Asset Packaging Machiness PTY LTD
18.1.17.1. Overview
18.1.17.2. Product Portfolio
18.1.17.3. Profitability by Market Segments (Product/Channel/Region)
18.1.17.4. Sales Footprint
18.1.17.5. Strategy Overview
18.1.17.5.1. Marketing Strategy
18.1.17.5.2. Product Strategy
18.1.17.5.3. Channel Strategy
18.1.18. HongKong SINBON Industrial Limited
18.1.18.1. Overview
18.1.18.2. Product Portfolio
18.1.18.3. Profitability by Market Segments (Product/Channel/Region)
18.1.18.4. Sales Footprint
18.1.18.5. Strategy Overview
18.1.18.5.1. Marketing Strategy
18.1.18.5.2. Product Strategy
18.1.18.5.3. Channel Strategy
18.1.19. COZZOLI MACHINES COMPANY
18.1.19.1. Overview
18.1.19.2. Product Portfolio
18.1.19.3. Profitability by Market Segments (Product/Channel/Region)
18.1.19.4. Sales Footprint
18.1.19.5. Strategy Overview
18.1.19.5.1. Marketing Strategy
18.1.19.5.2. Product Strategy
18.1.19.5.3. Channel Strategy
18.1.20. Nichrome Packaging Solutions.
18.1.20.1. Overview
18.1.20.2. Product Portfolio
18.1.20.3. Profitability by Market Segments (Product/Channel/Region)
18.1.20.4. Sales Footprint
18.1.20.5. Strategy Overview
18.1.20.5.1. Marketing Strategy
18.1.20.5.2. Product Strategy
18.1.20.5.3. Channel Strategy
19. Assumptions and Acronyms Used
20. Research Methodology
Let us know your requirement to get
100% FREE customization
List of Tables
Table 01: Global Bottle Filling Machines Market Value (US$ Mn) Forecast by Region, 2015-2032
Table 02: Global Bottle Filling Machines Market Volume (Units) Forecast by Region, 2015-2032
Table 03: Global Bottle Filling Machines Market Value (US$ Mn) Forecast by Operating type, 2015-2032
Table 04: Global Bottle Filling Machines Market Volume (Units) Forecast by Operating type, 2015-2032
Table 05: Global Bottle Filling Machines Market Value (US$ Mn) Forecast by Bottling Speed, 2015-2032
Table 06: Global Bottle Filling Machines Market Volume (Units) Forecast by Bottling Speed, 2015-2032
Table 07: Global Bottle Filling Machines Market Value (US$ Mn) Forecast by End-Use Industry, 2015-2032
Table 08: Global Bottle Filling Machines Market Volume (Units) Forecast by End-Use Industry, 2015-2032
Table 09: North America Bottle Filling Machines Market Value (US$ Mn) Forecast by Country, 2015-2032
Table 10: North America Bottle Filling Machines Market Volume (Units) Forecast by Country, 2015-2032
Table 11: North America Bottle Filling Machines Market Value (US$ Mn) Forecast by Operating type, 2015-2032
Table 12: North America Bottle Filling Machines Market Volume (Units) Forecast by Operating type, 2015-2032
Table 13: North America Bottle Filling Machines Market Value (US$ Mn) Forecast by Bottling Speed, 2015-2032
Table 14: North America Bottle Filling Machines Market Volume (Units) Forecast by Bottling Speed, 2015-2032
Table 15: North America Bottle Filling Machines Market Value (US$ Mn) Forecast by End-Use Industry, 2015-2032
Table 16: North America Bottle Filling Machines Market Volume (Units) Forecast by End-Use Industry, 2015-2032
Table 17: Latin America Bottle Filling Machines Market Value (US$ Mn) Forecast by Country, 2015-2032
Table 18: Latin America Bottle Filling Machines Market Volume (Units) Forecast by Country, 2015-2032
Table 19: Latin America Bottle Filling Machines Market Value (US$ Mn) Forecast by Operating type, 2015-2032
Table 20: Latin America Bottle Filling Machines Market Volume (Units) Forecast by Operating type, 2015-2032
Table 21: Latin America Bottle Filling Machines Market Value (US$ Mn) Forecast by Bottling Speed, 2015-2032
Table 22: Latin America Bottle Filling Machines Market Volume (Units) Forecast by Bottling Speed, 2015-2032
Table 23: Latin America Bottle Filling Machines Market Value (US$ Mn) Forecast by End-Use Industry, 2015-2032
Table 24: Latin America Bottle Filling Machines Market Volume (Units) Forecast by End-Use Industry, 2015-2032
Table 25: Europe Bottle Filling Machines Market Value (US$ Mn) Forecast by Country, 2015-2032
Table 26: Europe Bottle Filling Machines Market Volume (Units) Forecast by Country, 2015-2032
Table 27: Europe Bottle Filling Machines Market Value (US$ Mn) Forecast by Operating type, 2015-2032
Table 28: Europe Bottle Filling Machines Market Volume (Units) Forecast by Operating type, 2015-2032
Table 29: Europe Bottle Filling Machines Market Value (US$ Mn) Forecast by Bottling Speed, 2015-2032
Table 30: Europe Bottle Filling Machines Market Volume (Units) Forecast by Bottling Speed, 2015-2032
Table 31: Europe Bottle Filling Machines Market Value (US$ Mn) Forecast by End-Use Industry, 2015-2032
Table 32: Europe Bottle Filling Machines Market Volume (Units) Forecast by End-Use Industry, 2015-2032
Table 33: East Asia Bottle Filling Machines Market Value (US$ Mn) Forecast by Country, 2015-2032
Table 34: East Asia Bottle Filling Machines Market Volume (Units) Forecast by Country, 2015-2032
Table 35: East Asia Bottle Filling Machines Market Value (US$ Mn) Forecast by Operating type, 2015-2032
Table 36: East Asia Bottle Filling Machines Market Volume (Units) Forecast by Operating type, 2015-2032
Table 37: East Asia Bottle Filling Machines Market Value (US$ Mn) Forecast by Bottling Speed, 2015-2032
Table 38: East Asia Bottle Filling Machines Market Volume (Units) Forecast by Bottling Speed, 2015-2032
Table 39: East Asia Bottle Filling Machines Market Value (US$ Mn) Forecast by End-Use Industry, 2015-2032
Table 40: East Asia Bottle Filling Machines Market Volume (Units) Forecast by End-Use Industry, 2015-2032
Table 41: South Asia Bottle Filling Machines Market Value (US$ Mn) Forecast by Country, 2015-2032
Table 42: South Asia Bottle Filling Machines Market Volume (Units) Forecast by Country, 2015-2032
Table 43: South Asia Bottle Filling Machines Market Value (US$ Mn) Forecast by Operating type, 2015-2032
Table 44: South Asia Bottle Filling Machines Market Volume (Units) Forecast by Operating type, 2015-2032
Table 45: South Asia Bottle Filling Machines Market Value (US$ Mn) Forecast by Bottling Speed, 2015-2032
Table 46: South Asia Bottle Filling Machines Market Volume (Units) Forecast by Bottling Speed, 2015-2032
Table 47: South Asia Bottle Filling Machines Market Value (US$ Mn) Forecast by End-Use Industry, 2015-2032
Table 48: South Asia Bottle Filling Machines Market Volume (Units) Forecast by End-Use Industry, 2015-2032
Table 49: Oceania Bottle Filling Machines Market Value (US$ Mn) Forecast by Country, 2015-2032
Table 50: Oceania Bottle Filling Machines Market Volume (Units) Forecast by Country, 2015-2032
Table 51: Oceania Bottle Filling Machines Market Value (US$ Mn) Forecast by Operating type, 2015-2032
Table 52: Oceania Bottle Filling Machines Market Volume (Units) Forecast by Operating type, 2015-2032
Table 53: Oceania Bottle Filling Machines Market Value (US$ Mn) Forecast by Bottling Speed, 2015-2032
Table 54: Oceania Bottle Filling Machines Market Volume (Units) Forecast by Bottling Speed, 2015-2032
Table 55: Oceania Bottle Filling Machines Market Value (US$ Mn) Forecast by End-Use Industry, 2015-2032
Table 56: Oceania Bottle Filling Machines Market Volume (Units) Forecast by End-Use Industry, 2015-2032
Table 57: MEA Bottle Filling Machines Market Value (US$ Mn) Forecast by Country, 2015-2032
Table 58: MEA Bottle Filling Machines Market Volume (Units) Forecast by Country, 2015-2032
Table 59: MEA Bottle Filling Machines Market Value (US$ Mn) Forecast by Operating type, 2015-2032
Table 60: MEA Bottle Filling Machines Market Volume (Units) Forecast by Operating type, 2015-2032
Table 61: MEA Bottle Filling Machines Market Value (US$ Mn) Forecast by Bottling Speed, 2015-2032
Table 62: MEA Bottle Filling Machines Market Volume (Units) Forecast by Bottling Speed, 2015-2032
Table 63: MEA Bottle Filling Machines Market Value (US$ Mn) Forecast by End-Use Industry, 2015-2032
Table 64: MEA Bottle Filling Machines Market Volume (Units) Forecast by End-Use Industry, 2015-2032
Table 65: U.S. Bottle Filling Machines Market Value (US$ Mn) Forecast by Operating type, Bottling Speed, and End-Use Industry (2022(E) & 2032(F))
Table 66: Brazil Bottle Filling Machines Market Value (US$ Mn) Forecast by Operating type, Bottling Speed, and End-Use Industry (2022(E) & 2032(F))
Table 67: Mexico Bottle Filling Machines Market Value (US$ Mn) Forecast by Operating type, Bottling Speed, and End-Use Industry (2022(E) & 2032(F))
Table 68: Germany Bottle Filling Machines Market Value (US$ Mn) Forecast by Operating type, Bottling Speed, and End-Use Industry (2022(E) & 2032(F))
Table 69: Italy Bottle Filling Machines Market Value (US$ Mn) Forecast by Operating type, Bottling Speed, and End-Use Industry (2022(E) & 2032(F))
Table 70: France Bottle Filling Machines Market Value (US$ Mn) Forecast by Operating type, Bottling Speed, and End-Use Industry (2022(E) & 2032(F))
Table 71: Spain Bottle Filling Machines Market Value (US$ Mn) Forecast by Operating type, Bottling Speed, and End-Use Industry (2022(E) & 2032(F))
Table 72: U.K. Bottle Filling Machines Market Value (US$ Mn) Forecast by Operating type, Bottling Speed, and End-Use Industry (2022(E) & 2032(F))
Table 73: China Bottle Filling Machines Market Value (US$ Mn) Forecast by Operating type, Bottling Speed, and End-Use Industry (2022(E) & 2032(F))
Table 74: Japan Bottle Filling Machines Market Value (US$ Mn) Forecast by Operating type, Bottling Speed, and End-Use Industry (2022(E) & 2032(F))
Table 75: India Bottle Filling Machines Market Value (US$ Mn) Forecast by Operating type, Bottling Speed, and End-Use Industry (2022(E) & 2032(F))
Table 76: Australia Bottle Filling Machines Market Value (US$ Mn) Forecast by Operating type, Bottling Speed, and End-Use Industry (2022(E) & 2032(F))
Find your sweet spots for generating winning opportunities in this market.
Talk to AnalystList of Charts
Figure 01: Global Bottle Filling Machines Market Value (US$ Mn) by Operating type, 2022-2032
Figure 02: Global Bottle Filling Machines Market Value (US$ Mn) by Bottling Speed, 2022-2032
Figure 03: Global Bottle Filling Machines Market Value (US$ Mn) by End-Use Industry, 2022-2032
Figure 04: Global Bottle Filling Machines Market Value (US$ Mn) by Region, 2022-2032
Figure 05: Global Bottle Filling Machines Market Value (US$ Mn) Analysis by Region, 2015-2021
Figure 06: Global Bottle Filling Machines Market Volume (Units) Analysis by Region, 2015-2032
Figure 07: Global Bottle Filling Machines Market Value Share (%) and BPS Analysis by Region, 2022 & 2032
Figure 08: Global Bottle Filling Machines Market Y-o-Y Growth (%) Projections by Region, 2022-2032
Figure 09: Global Bottle Filling Machines Market Value (US$ Mn) Analysis by Operating type, 2015-2021
Figure 10: Global Bottle Filling Machines Market Volume (Units) Analysis by Operating type, 2015-2032
Figure 11: Global Bottle Filling Machines Market Value Share (%) and BPS Analysis by Operating type, 2022 & 2032
Figure 12: Global Bottle Filling Machines Market Y-o-Y Growth (%) Projections by Operating type, 2022-2032
Figure 13: Global Bottle Filling Machines Market Value (US$ Mn) Analysis by Bottling Speed, 2015-2021
Figure 14: Global Bottle Filling Machines Market Volume (Units) Analysis by Bottling Speed, 2015-2032
Figure 15: Global Bottle Filling Machines Market Value Share (%) and BPS Analysis by Bottling Speed, 2022 & 2032
Figure 16: Global Bottle Filling Machines Market Y-o-Y Growth (%) Projections by Bottling Speed, 2022-2032
Figure 17: Global Bottle Filling Machines Market Value (US$ Mn) Analysis by End-Use Industry, 2015-2021
Figure 18: Global Bottle Filling Machines Market Volume (Units) Analysis by End-Use Industry, 2015-2032
Figure 19: Global Bottle Filling Machines Market Value Share (%) and BPS Analysis by End-Use Industry, 2022 & 2032
Figure 20: Global Bottle Filling Machines Market Y-o-Y Growth (%) Projections by End-Use Industry, 2022-2032
Figure 21: Global Bottle Filling Machines Market Attractiveness by Operating type, 2022-2032
Figure 22: Global Bottle Filling Machines Market Attractiveness by Bottling Speed, 2022-2032
Figure 23: Global Bottle Filling Machines Market Attractiveness by Bottling Speed, 2022-2032
Figure 24: Global Bottle Filling Machines Market Attractiveness by End-Use Industry, 2022-2032
Figure 25: Global Bottle Filling Machines Market Attractiveness by Region, 2022-2032
Figure 26: North America Bottle Filling Machines Market Value (US$ Mn) by Operating type, 2022-2032
Figure 27: North America Bottle Filling Machines Market Value (US$ Mn) by Bottling Speed, 2022-2032
Figure 28: North America Bottle Filling Machines Market Value (US$ Mn) by End-Use Industry, 2022-2032
Figure 29: North America Bottle Filling Machines Market Value (US$ Mn) by Country, 2022-2032
Figure 30: North America Bottle Filling Machines Market Value (US$ Mn) Analysis by Country, 2015-2021
Figure 31: North America Bottle Filling Machines Market Volume (Units) Analysis by Country, 2015-2032
Figure 32: North America Bottle Filling Machines Market Value Share (%) and BPS Analysis by Country, 2022 & 2032
Figure 33: North America Bottle Filling Machines Market Y-o-Y Growth (%) Projections by Country, 2022-2032
Figure 34: North America Bottle Filling Machines Market Value (US$ Mn) Analysis by Operating type, 2015-2021
Figure 35: North America Bottle Filling Machines Market Volume (Units) Analysis by Operating type, 2015-2032
Figure 36: North America Bottle Filling Machines Market Value Share (%) and BPS Analysis by Operating type, 2022 & 2032
Figure 37: North America Bottle Filling Machines Market Y-o-Y Growth (%) Projections by Operating type, 2022-2032
Figure 38: North America Bottle Filling Machines Market Value (US$ Mn) Analysis by Bottling Speed, 2015-2021
Figure 39: North America Bottle Filling Machines Market Volume (Units) Analysis by Bottling Speed, 2015-2032
Figure 40: North America Bottle Filling Machines Market Value Share (%) and BPS Analysis by Bottling Speed, 2022 & 2032
Figure 41: North America Bottle Filling Machines Market Y-o-Y Growth (%) Projections by Bottling Speed, 2022-2032
Figure 42: North America Bottle Filling Machines Market Value (US$ Mn) Analysis by End-Use Industry, 2015-2021
Figure 43: North America Bottle Filling Machines Market Volume (Units) Analysis by End-Use Industry, 2015-2032
Figure 44: North America Bottle Filling Machines Market Value Share (%) and BPS Analysis by End-Use Industry, 2022 & 2032
Figure 45: North America Bottle Filling Machines Market Y-o-Y Growth (%) Projections by End-Use Industry, 2022-2032
Figure 46: North America Bottle Filling Machines Market Attractiveness by Operating type, 2022-2032
Figure 47: North America Bottle Filling Machines Market Attractiveness by Bottling Speed, 2022-2032
Figure 48: North America Bottle Filling Machines Market Attractiveness by End-Use Industry, 2022-2032
Figure 49: North America Bottle Filling Machines Market Attractiveness by Country, 2022-2032
Figure 50: Latin America Bottle Filling Machines Market Value (US$ Mn) by Operating type, 2022 & 2032
Figure 51: Latin America Bottle Filling Machines Market Value (US$ Mn) by Bottling Speed, 2022-2032
Figure 52: Latin America Bottle Filling Machines Market Value (US$ Mn) by End-Use Industry, 2022-2032
Figure 53: Latin America Bottle Filling Machines Market Value (US$ Mn) by Country, 2022-2032
Figure 54: Latin America Bottle Filling Machines Market Value (US$ Mn) Analysis by Country, 2015-2021
Figure 55: Latin America Bottle Filling Machines Market Volume (Units) Analysis by Country, 2015-2032
Figure 56: Latin America Bottle Filling Machines Market Value Share (%) and BPS Analysis by Country, 2022 & 2032
Figure 57: Latin America Bottle Filling Machines Market Y-o-Y Growth (%) Projections by Country, 2022-2032
Figure 58: Latin America Bottle Filling Machines Market Value (US$ Mn) Analysis by Operating type, 2015-2021
Figure 59: Latin America Bottle Filling Machines Market Volume (Units) Analysis by Operating type, 2015-2032
Figure 60: Latin America Bottle Filling Machines Market Value Share (%) and BPS Analysis by Operating type, 2022 & 2032
Figure 61: Latin America Bottle Filling Machines Market Y-o-Y Growth (%) Projections by Operating type, 2022-2032
Figure 62: Latin America Bottle Filling Machines Market Value (US$ Mn) Analysis by Bottling Speed, 2015-2021
Figure 63: Latin America Bottle Filling Machines Market Volume (Units) Analysis by Bottling Speed, 2015-2032
Figure 64: Latin America Bottle Filling Machines Market Value Share (%) and BPS Analysis by Bottling Speed, 2022 & 2032
Figure 65: Latin America Bottle Filling Machines Market Y-o-Y Growth (%) Projections by Bottling Speed, 2022-2032
Figure 66: Latin America Bottle Filling Machines Market Value (US$ Mn) Analysis by End-Use Industry, 2015-2021
Figure 67: Latin America Bottle Filling Machines Market Volume (Units) Analysis by End-Use Industry, 2015-2032
Figure 68: Latin America Bottle Filling Machines Market Value Share (%) and BPS Analysis by End-Use Industry, 2022 & 2032
Figure 69: Latin America Bottle Filling Machines Market Y-o-Y Growth (%) Projections by End-Use Industry, 2022-2032
Figure 70: Latin America Bottle Filling Machines Market Attractiveness by Operating type, 2022-2032
Figure 71: Latin America Bottle Filling Machines Market Attractiveness by Bottling Speed, 2022-2032
Figure 72: Latin America Bottle Filling Machines Market Attractiveness by End-Use Industry, 2022-2032
Figure 73: Latin America Bottle Filling Machines Market Attractiveness by Country, 2022-2032
Figure 74: Europe Bottle Filling Machines Market Value (US$ Mn) by Operating type, 2022-2032
Figure 75: Europe Bottle Filling Machines Market Value (US$ Mn) by Bottling Speed, 2022-2032
Figure 76: Europe Bottle Filling Machines Market Value (US$ Mn) by End-Use Industry, 2022-2032
Figure 77: Europe Bottle Filling Machines Market Value (US$ Mn) by Country, 2022-2032
Figure 78: Europe Bottle Filling Machines Market Value (US$ Mn) Analysis by Country, 2015-2021
Figure 79: Europe Bottle Filling Machines Market Volume (Units) Analysis by Country, 2015-2032
Figure 80: Europe Bottle Filling Machines Market Value Share (%) and BPS Analysis by Country, 2022 & 2032
Figure 81: Europe Bottle Filling Machines Market Y-o-Y Growth (%) Projections by Country, 2022-2032
Figure 82: Europe Bottle Filling Machines Market Value (US$ Mn) Analysis by Operating type, 2015-2021
Figure 83: Europe Bottle Filling Machines Market Volume (Units) Analysis by Operating type, 2015-2032
Figure 84: Europe Bottle Filling Machines Market Value Share (%) and BPS Analysis by Operating type, 2022 & 2032
Figure 85: Europe Bottle Filling Machines Market Y-o-Y Growth (%) Projections by Operating type, 2022-2032
Figure 86: Europe Bottle Filling Machines Market Value (US$ Mn) Analysis by Bottling Speed, 2015-2021
Figure 87: Europe Bottle Filling Machines Market Volume (Units) Analysis by Bottling Speed, 2015-2032
Figure 88: Europe Bottle Filling Machines Market Value Share (%) and BPS Analysis by Bottling Speed, 2022 & 2032
Figure 89: Europe Bottle Filling Machines Market Y-o-Y Growth (%) Projections by Bottling Speed, 2022-2032
Figure 90: Europe Bottle Filling Machines Market Value (US$ Mn) Analysis by End-Use Industry, 2015-2021
Figure 91: Europe Bottle Filling Machines Market Volume (Units) Analysis by End-Use Industry, 2015-2032
Figure 92: Europe Bottle Filling Machines Market Value Share (%) and BPS Analysis by End-Use Industry, 2022 & 2032
Figure 93: Europe Bottle Filling Machines Market Y-o-Y Growth (%) Projections by End-Use Industry, 2022-2032
Figure 94: Europe Bottle Filling Machines Market Attractiveness by Operating type, 2022-2032
Figure 95: Europe Bottle Filling Machines Market Attractiveness by Bottling Speed, 2022-2032
Figure 96: Europe Bottle Filling Machines Market Attractiveness by End-Use Industry, 2022-2032
Figure 97: Europe Bottle Filling Machines Market Attractiveness by Country, 2022-2032
Figure 98: East Asia Bottle Filling Machines Market Value (US$ Mn) by Operating type, 2022-2032
Figure 99: East Asia Bottle Filling Machines Market Value (US$ Mn) by Bottling Speed, 2022-2032
Figure 100: East Asia Bottle Filling Machines Market Value (US$ Mn) by End-Use Industry, 2022-2032
Figure 101: East Asia Bottle Filling Machines Market Value (US$ Mn) by Country, 2022-2032
Figure 102: East Asia Bottle Filling Machines Market Value (US$ Mn) Analysis by Country, 2015-2021
Figure 103: East Asia Bottle Filling Machines Market Volume (Units) Analysis by Country, 2015-2032
Figure 104: East Asia Bottle Filling Machines Market Value Share (%) and BPS Analysis by Country, 2022 & 2032
Figure 105: East Asia Bottle Filling Machines Market Y-o-Y Growth (%) Projections by Country, 2022-2032
Figure 106: East Asia Bottle Filling Machines Market Value (US$ Mn) Analysis by Operating type, 2015-2021
Figure 107: East Asia Bottle Filling Machines Market Volume (Units) Analysis by Operating type, 2015-2032
Figure 108: East Asia Bottle Filling Machines Market Value Share (%) and BPS Analysis by Operating type, 2022 & 2032
Figure 109: East Asia Bottle Filling Machines Market Y-o-Y Growth (%) Projections by Operating type, 2022-2032
Figure 110: East Asia Bottle Filling Machines Market Value (US$ Mn) Analysis by Bottling Speed, 2015-2021
Figure 111: East Asia Bottle Filling Machines Market Volume (Units) Analysis by Bottling Speed, 2015-2032
Figure 112: East Asia Bottle Filling Machines Market Value Share (%) and BPS Analysis by Bottling Speed, 2022 & 2032
Figure 113: East Asia Bottle Filling Machines Market Y-o-Y Growth (%) Projections by Bottling Speed, 2022-2032
Figure 114: East Asia Bottle Filling Machines Market Value (US$ Mn) Analysis by End-Use Industry, 2015-2021
Figure 115: East Asia Bottle Filling Machines Market Volume (Units) Analysis by End-Use Industry, 2015-2032
Figure 116: East Asia Bottle Filling Machines Market Value Share (%) and BPS Analysis by End-Use Industry, 2022 & 2032
Figure 117: East Asia Bottle Filling Machines Market Y-o-Y Growth (%) Projections by End-Use Industry, 2022-2032
Figure 118: East Asia Bottle Filling Machines Market Attractiveness by Operating type, 2022-2032
Figure 119: East Asia Bottle Filling Machines Market Attractiveness by Bottling Speed, 2022-2032
Figure 120: East Asia Bottle Filling Machines Market Attractiveness by End-Use Industry, 2022-2032
Figure 121: East Asia Bottle Filling Machines Market Attractiveness by Country, 2022-2032
Figure 122: South Asia Bottle Filling Machines Market Value (US$ Mn) by Operating type, 2022-2032
Figure 123: South Asia Bottle Filling Machines Market Value (US$ Mn) by Bottling Speed, 2022-2032
Figure 124: South Asia Bottle Filling Machines Market Value (US$ Mn) by End-Use Industry, 2022-2032
Figure 125: South Asia Bottle Filling Machines Market Value (US$ Mn) by Country, 2022-2032
Figure 126: South Asia Bottle Filling Machines Market Value (US$ Mn) Analysis by Country, 2015-2021
Figure 127: South Asia Bottle Filling Machines Market Volume (Units) Analysis by Country, 2015-2032
Figure 128: South Asia Bottle Filling Machines Market Value Share (%) and BPS Analysis by Country, 2022 & 2032
Figure 129: South Asia Bottle Filling Machines Market Y-o-Y Growth (%) Projections by Country, 2022-2032
Figure 130: South Asia Bottle Filling Machines Market Value (US$ Mn) Analysis by Operating type, 2015-2021
Figure 131: South Asia Bottle Filling Machines Market Volume (Units) Analysis by Operating type, 2015-2032
Figure 132: South Asia Bottle Filling Machines Market Value Share (%) and BPS Analysis by Operating type, 2022 & 2032
Figure 133: South Asia Bottle Filling Machines Market Y-o-Y Growth (%) Projections by Operating type, 2022-2032
Figure 134: South Asia Bottle Filling Machines Market Value (US$ Mn) Analysis by Bottling Speed, 2015-2021
Figure 135: South Asia Bottle Filling Machines Market Volume (Units) Analysis by Bottling Speed, 2015-2032
Figure 136: South Asia Bottle Filling Machines Market Value Share (%) and BPS Analysis by Bottling Speed, 2022 & 2032
Figure 137: South Asia Bottle Filling Machines Market Y-o-Y Growth (%) Projections by Bottling Speed, 2022-2032
Figure 138: South Asia Bottle Filling Machines Market Value (US$ Mn) Analysis by End-Use Industry, 2015-2021
Figure 139: South Asia Bottle Filling Machines Market Volume (Units) Analysis by End-Use Industry, 2015-2032
Figure 140: South Asia Bottle Filling Machines Market Value Share (%) and BPS Analysis by End-Use Industry, 2022 & 2032
Figure 141: South Asia Bottle Filling Machines Market Y-o-Y Growth (%) Projections by End-Use Industry, 2022-2032
Figure 142: South Asia Bottle Filling Machines Market Attractiveness by Operating type, 2022-2032
Figure 143: South Asia Bottle Filling Machines Market Attractiveness by Bottling Speed, 2022-2032
Figure 144: South Asia Bottle Filling Machines Market Attractiveness by End-Use Industry, 2022-2032
Figure 145: South Asia Bottle Filling Machines Market Attractiveness by Country, 2022-2032
Figure 146: Oceania Bottle Filling Machines Market Value (US$ Mn) by Operating type, 2022-2032
Figure 147: Oceania Bottle Filling Machines Market Value (US$ Mn) by Bottling Speed, 2022-2032
Figure 148: Oceania Bottle Filling Machines Market Value (US$ Mn) by End-Use Industry, 2022-2032
Figure 149: Oceania Bottle Filling Machines Market Value (US$ Mn) by Country, 2022-2032
Figure 150: Oceania Bottle Filling Machines Market Value (US$ Mn) Analysis by Country, 2015-2021
Figure 151: Oceania Bottle Filling Machines Market Volume (Units) Analysis by Country, 2015-2032
Figure 152: Oceania Bottle Filling Machines Market Value Share (%) and BPS Analysis by Country, 2022 & 2032
Figure 153: Oceania Bottle Filling Machines Market Y-o-Y Growth (%) Projections by Country, 2022-2032
Figure 154: Oceania Bottle Filling Machines Market Value (US$ Mn) Analysis by Operating type, 2015-2021
Figure 155: Oceania Bottle Filling Machines Market Volume (Units) Analysis by Operating type, 2015-2032
Figure 156: Oceania Bottle Filling Machines Market Value Share (%) and BPS Analysis by Operating type, 2022 & 2032
Figure 157: Oceania Bottle Filling Machines Market Y-o-Y Growth (%) Projections by Operating type, 2022-2032
Figure 158: Oceania Bottle Filling Machines Market Value (US$ Mn) Analysis by Bottling Speed, 2015-2021
Figure 159: Oceania Bottle Filling Machines Market Volume (Units) Analysis by Bottling Speed, 2015-2032
Figure 160: Oceania Bottle Filling Machines Market Value Share (%) and BPS Analysis by Bottling Speed, 2022 & 2032
Figure 161: Oceania Bottle Filling Machines Market Y-o-Y Growth (%) Projections by Bottling Speed, 2022-2032
Figure 162: Oceania Bottle Filling Machines Market Value (US$ Mn) Analysis by End-Use Industry, 2015-2021
Figure 163: Oceania Bottle Filling Machines Market Volume (Units) Analysis by End-Use Industry, 2015-2032
Figure 164: Oceania Bottle Filling Machines Market Value Share (%) and BPS Analysis by End-Use Industry, 2022 & 2032
Figure 165: Oceania Bottle Filling Machines Market Y-o-Y Growth (%) Projections by End-Use Industry, 2022-2032
Figure 166: Oceania Bottle Filling Machines Market Attractiveness by Operating type, 2022-2032
Figure 167: Oceania Bottle Filling Machines Market Attractiveness by Bottling Speed, 2022-2032
Figure 168: Oceania Bottle Filling Machines Market Attractiveness by End-Use Industry, 2022-2032
Figure 169 Oceania Bottle Filling Machines Market Attractiveness by Country, 2022-2032
Figure 170: MEA Bottle Filling Machines Market Value (US$ Mn) by Operating type, 2022-2032
Figure 171: MEA Bottle Filling Machines Market Value (US$ Mn) by Bottling Speed, 2022-2032
Figure 172: MEA Bottle Filling Machines Market Value (US$ Mn) by End-Use Industry, 2022-2032
Figure 173: MEA Bottle Filling Machines Market Value (US$ Mn) by Country, 2022-2032
Figure 174: MEA Bottle Filling Machines Market Value (US$ Mn) Analysis by Country, 2015-2021
Figure 175: MEA Bottle Filling Machines Market Volume (Units) Analysis by Country, 2015-2032
Figure 176: MEA Bottle Filling Machines Market Value Share (%) and BPS Analysis by Country, 2022 & 2032
Figure 177: MEA Bottle Filling Machines Market Y-o-Y Growth (%) Projections by Country, 2022-2032
Figure 178: MEA Bottle Filling Machines Market Value (US$ Mn) Analysis by Operating type, 2015-2021
Figure 179: MEA Bottle Filling Machines Market Volume (Units) Analysis by Operating type, 2015-2032
Figure 180: MEA Bottle Filling Machines Market Value Share (%) and BPS Analysis by Operating type, 2022 & 2032
Figure 181: MEA Bottle Filling Machines Market Y-o-Y Growth (%) Projections by Operating type, 2022-2032
Figure 182: MEA Bottle Filling Machines Market Value (US$ Mn) Analysis by Bottling Speed, 2015-2021
Figure 183: MEA Bottle Filling Machines Market Volume (Units) Analysis by Bottling Speed, 2015-2032
Figure 184: MEA Bottle Filling Machines Market Value Share (%) and BPS Analysis by Bottling Speed, 2022 & 2032
Figure 185: MEA Bottle Filling Machines Market Y-o-Y Growth (%) Projections by Bottling Speed, 2022-2032
Figure 186: MEA Bottle Filling Machines Market Value (US$ Mn) Analysis by End-Use Industry, 2015-2021
Figure 187: MEA Bottle Filling Machines Market Volume (Units) Analysis by End-Use Industry, 2015-2032
Figure 188: MEA Bottle Filling Machines Market Value Share (%) and BPS Analysis by End-Use Industry, 2022 & 2032
Figure 189: MEA Bottle Filling Machines Market Y-o-Y Growth (%) Projections by End-Use Industry, 2022-2032
Figure 190: MEA Bottle Filling Machines Market Attractiveness by Operating type, 2022-2032
Figure 191: MEA Bottle Filling Machines Market Attractiveness by Bottling Speed, 2022-2032
Figure 192: MEA Bottle Filling Machines Market Attractiveness by End-Use Industry, 2022-2032
Figure 193 MEA Bottle Filling Machines Market Attractiveness by Country, 2022-2032
Need specific information?
Request CustomizationExplore Packaging Insights
View Reports