RTD Bottled Cocktails Market
Market Insights on RTD Bottled Cocktails covering sales outlook, demand forecast & up-to-date key trends
RTD Bottled Cocktails Market By Product Type, Flavour, Price Range, Sales Channel, Packaging & Region - Forecast 2022-2032
RTD Bottled Cocktails Market Outlook (2022-2032)
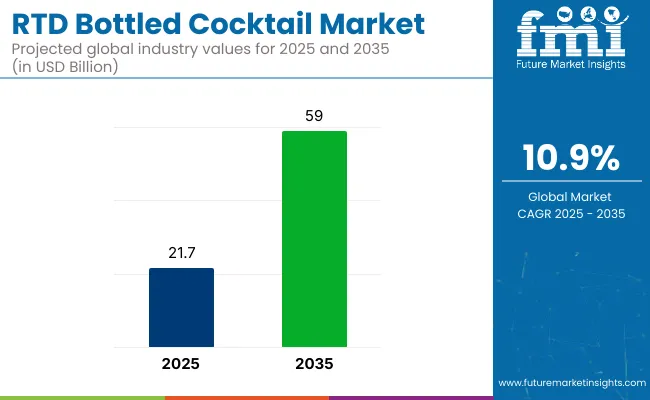
[300 Pages Report] The RTD bottled cocktails market is expected to be valued at US$ 16,073.1 Mn in 2022 and is projected to grow at a CAGR of 10.9% during the forecast period (2022-2032). The global market is anticipated to reach a valuation of US$ 45,228.8 Mn by 2032. The market for RTD bottled cocktails is likely to showcase year-on-year (YoY) growth of 10.4% in 2022.
Attributes |
Key Statistics |
Global RTD Bottled Cocktails Market Estimated Size (2022E) |
US$ ~16,073.1 Mn |
Projected Market Valuation (2032F) |
US$ ~45,228.8 Mn |
Value-based CAGR (2022-2032) |
~10.9% CAGR |
Collective Value Share: Top 3 Countries (2021A) |
33.9% |
The flavored RTD bottled cocktails segment grew at a CAGR of 8.7% over the historical period (2017-2021), while the natural/unflavored RTD bottled cocktails segment was up by 7.6% through 2017-2021. According to a report by Future Market Insights, Bottoms Up Cocktail, Diageo plc, Brown Farman, Bacardi Inc., and RTM Beverages Ltd. are considered to be leading players in the RTD bottled cocktails market.
Let us know your requirement to get
100% FREE customization
2017-2021 RTD Bottled Cocktails Market Outlook Compared to 2022-2032 Forecast
Demand for RTD bottled cocktails grew at 8.5% CAGR between 2017 and 2021. Over the forthcoming years, the market is expected to thrive even more due to increasing demand from the beverage sector across the globe.
High demand for flavored beverages with low alcohol content among health-conscious consumers in both developed and developing countries is projected to accelerate the market. Besides, surging popularity of wine-based cocktails owing to their inclusion of fruit juices, including berries, mangoes, lemons, grapefruits, passionfruit, and oranges is expected to bode well for the market.
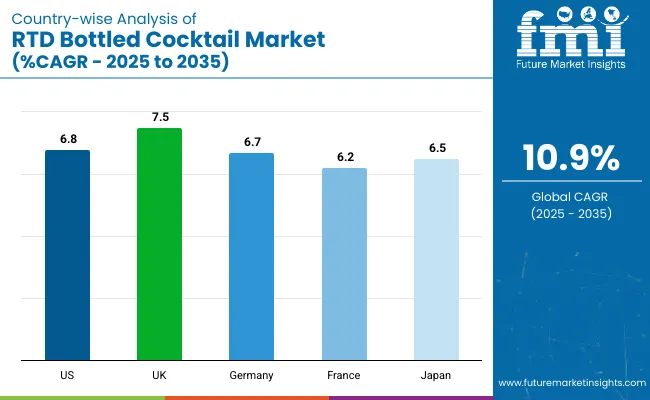
Driven by the aforementioned factors, the global RTD bottled cocktails market is anticipated to exhibit a CAGR of 10.9% in the forecast period from 2022 to 2032.
Country-wise Insights
Why is the U.S. Projected to be the Most Lucrative RTD Bottled Cocktails Market?
“Amaro Liquor-based Pre-bottled Cocktails to Gain Traction”
Increasing production of bitter cocktail ingredients owing to rapid inclination of consumers towards a healthy lifestyle and high disposable income is expected to boost the U.S. RTD bottled cocktails market in the next decade.
As per Bacardi Global Brand Ambassador Survey respondents, Amaro liquor-based cocktails in the U.S. is generating high sales as a bitter cocktails ingredient. The country is also embracing Italian Aperitivo culture at a fast pace. This has further resulted in surging sales of RTD bottled cocktails in the U.S. and thus, the country is projected to generate an estimated market share of 78.0% in 2022.
What is the Australia RTD Bottled Cocktails Market Outlook?
“Companies Are Adopting New Technologies to Launch Bottle Alcoholic Drinks”
Small and mid-sized brands in Australia are competing for private-label growth, while leading companies remain relatively safe with fiercely brand-loyal consumers of RTD bottled cocktails. Kraken, for instance, has adapted advanced technologies and equipment to produce premium-quality RTD bottled cocktails in Australia.
The company is offering consumer centric products to maintain sustainable consumer relationships. Spurred by the above-mentioned factors, Australia RTD bottled cocktails market is anticipated to generate nearly 56.5% of share in 2022 in Oceania.
How is the China RTD Bottled Cocktails Market Progressing?
“E-commerce Companies to Sell Low Alcoholic Bottled Drinks”
China is likely to exhibit high sales of RTD bottled cocktails and is anticipated to generate a market share of about 54.5% in 2022 in East Asia. Growth is attributed to rapid expansion of the e-commerce sector and investments by manufacturers in facility developments in the country.
Jiuxian.com, for instance, is a renowned alcohol-only e-commerce company in the country. It has undergone several equity financing to accelerate huge expansions in recent years, which is driving the production and consumption of RTD bottled cocktails in China.
Find your sweet spots for generating winning opportunities in this market.
Talk to AnalystCategory-wise Insights
Which is the Most Preferred Flavor of RTD Bottled Cocktails?
“Flavored Signature Drink Bottles to Gain Immense Popularity”
Premiumization and re-invention of classic cocktails such as Cosmopolitan, Moscow Mule, Margarita, and Bloody Mary among others by using natural ingredients and flavors are ramping up production and sales worldwide. These strategies are also helping key players to meet surging consumer demand for beverages with lower alcohol content.
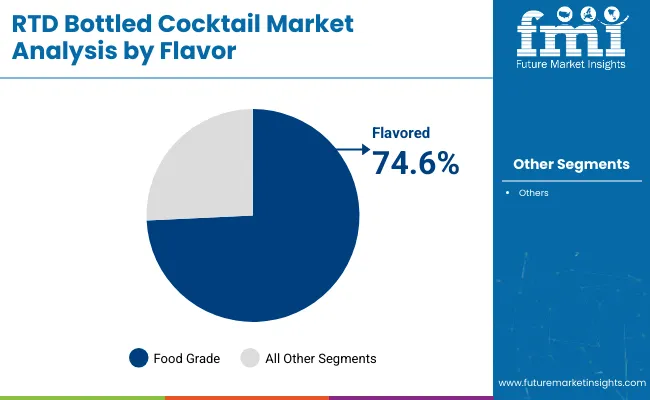
Consumers are expected to look for new products that would provide them with a refreshing taste and it is further set to drive the need for flavored RTD bottled cocktails. As per FMI, the flavored RTD bottled cocktails segment is projected to exhibit growth at a CAGR of 10.5% in the forecast period.
Which is the Leading Product Type in the RTD Bottled Cocktails Market?
“Bottled Vodka Drinks to Generate High Sales in Future”
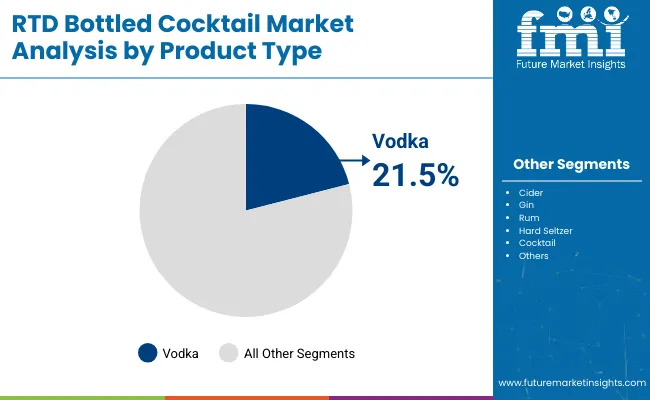
By product type, the vodka segment is expected to generate a global RTD bottled cocktails market share of nearly 20.3% in 2022, says FMI. Increasing demand for new beverages with exotic flavors and tastes in developing countries is likely to augur well for the segment.
Moreover, rising trading of alcoholic beverages through offline trading is projected to drive the segment. Increasing demand for cost-effective citrus cocktails and advertisements of key players by including social media influencers and celebrities are also expected to push sales of vodka in the evaluation period.
Which is the Most Popular Price Range in the RTD Bottled Cocktails Market?
“Premium Cocktail Bottle Drinks to Exhibit Surging Demand”
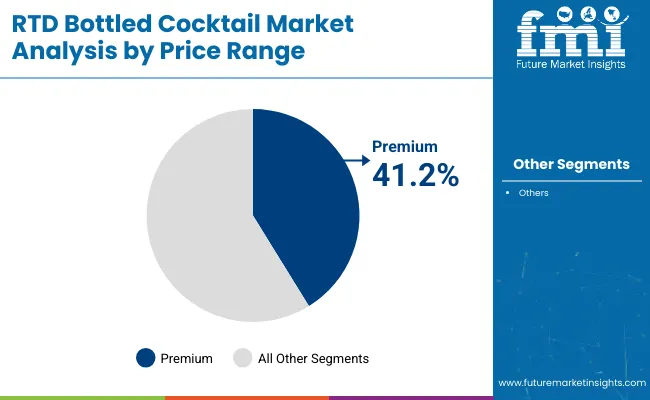
As absolute luxury is a marker of exclusivity, consumers are nowadays looking for premium products. By price range, the premium segment is likely to exhibit a CAGR of 12.1% over the forecast period in the global RTD bottled cocktails market.
Several brands are focusing on producing spirits that have exceptional packaging, are made with excellent ingredients, and superior in quality. Consumers are thus reaching out for more high-quality and premium beverages which is mainly propelled by the trend of quality over quantity.
Why is Online Retail Sales Channel Pushing the RTD Bottled Cocktails Market?
“Companies Are Adopting Internet Retailing to Push Cocktail Mix Bottle Sales”
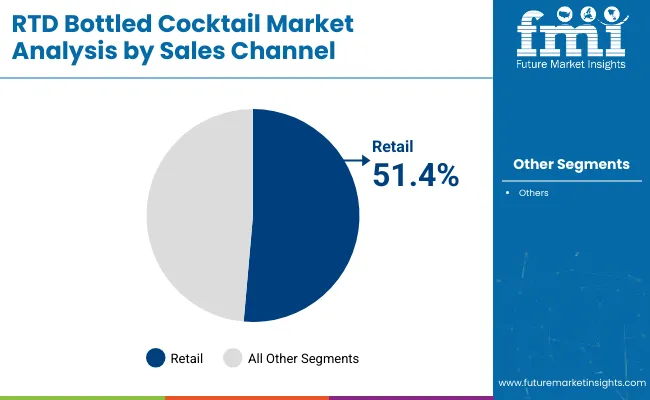
Based on sales channel, the online retail segment is leading the global RTD bottle cocktails market and is projected to exhibit a CAGR of 11.6% throughout the forecast period. Rising focus of retailers on the adoption of internet retailing to expand their businesses by utilizing modern trade technology is set to aid growth.
According to the Foundation for Alcohol Research and Education (Australia), 107 alcoholic beverage advertisements were shown on a personal Instagram and Facebook account within one hour, which is an average of 1 ad in 35 seconds. About 66% of those ads had a direct link with ‘Shop now’ option which redirected customers to their respective e-commerce stores, further increasing the popularity of the segment.
Is the Glass Packaging Segment Dominating the RTD Bottled Cocktails Market?
“Premixed Cocktails in Glass Bottles to Increase Consumer Appeal”
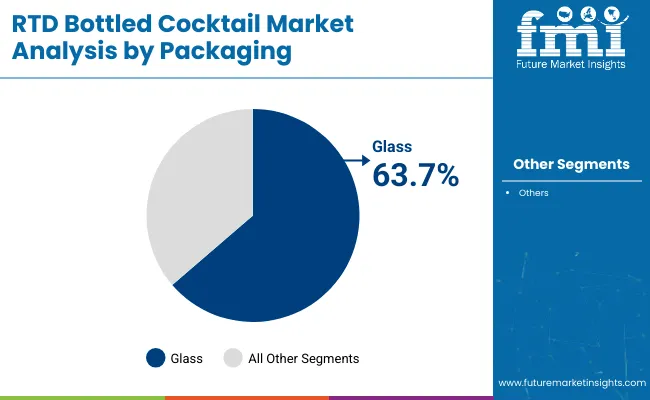
By packaging, the glass segment is projected to generate a share of around 66.0% in 2022 in the global RTD bottled cocktails market. Digital storefronts are coming up with various packaging options, however, RTD bottled cocktails with glass packaging are being preferred over plastic by both manufacturers and consumers. High demand for premium packaging solutions and ability of glass packaging to surge consumer appeal are a couple of crucial factors that would bolster the segment.
Competitive Landscape
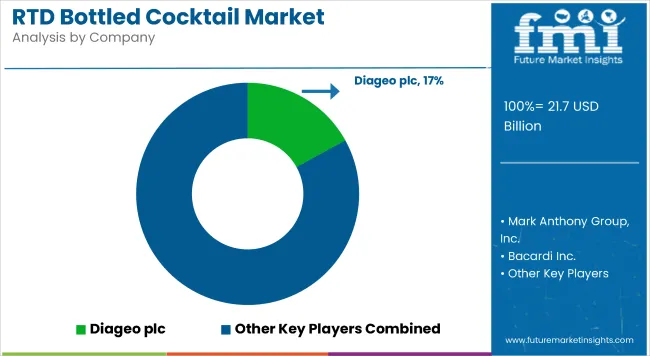
Bottoms Up Cocktail, Diageo plc, Brown Farman, Bacardi Inc., and RTM Beverages Ltd. among others are some of the leading players in the global RTD bottled cocktails market. Key market players are focusing on increasing their brand value with the launch of high-quality products. They are also engaging in mergers and acquisitions to expand their regional footprints.
For instance:
- In June 2022, Three Floyds Distilling, a manufacturer of spirits based in Indiana, debuted Sanctus, Barnabus, and Brutta- three premium bottled cocktails. The company aims to attract more consumers and want them to level up their at-home drinks game. All three cocktails include rare and high-quality ingredients with a base of the company’s award-winning line-up of super-premium spirits.
- In June 2022, Brody's Crafted Cocktails, a producer of RTD craft cocktails, broadened its distribution network in Hawaii and announced that its products are available exclusively at Foodland locations. The company joined hands with Republic National Distributing Company, which is one of the largest wholesale distributors of beer, wine, and spirits in the U.S. to sell its novel range of RTD premium spirits-based bottled cocktails across Hawaii.

A unified Market Research Subscription Platform, built for today's disparate research needs.
Scope of the Report
Attribute |
Details |
Estimated Market Size (2022) |
US$ ~16,073.1 Mn |
Projected Market Valuation (2032) |
US$ ~45,228.8 Mn |
Value-based CAGR (2022-2032) |
~10.9% CAGR |
Forecast Period |
2022-2032 |
Historical Data Available for |
2017-2021 |
Market Analysis |
Value (US$ Mn) and Volume (MT) |
Key Regions Covered |
North America, Latin America, Europe, East Asia, South Asia, Oceania, and MEA |
Key Countries Covered |
United States, Canada, Brazil, Mexico, Argentina, Peru, Chile, Germany, France, Italy, Spain, UK, Benelux, Nordic, Russia, Poland, China, Japan, South Korea, India, Thailand, Indonesia, Malaysia, Singapore, Australia, New Zealand, GCC Countries, Turkey, South Africa, North Africa, and Central Africa |
Key Segments Covered |
Product Type, Flavor, Price Range, Sales Channel, Packaging, and Region |
Key Companies Profiled |
|
Report Coverage |
Market forecast, company share analysis, competition intelligence, DROT analysis, market dynamics and challenges, and strategic growth initiatives |
RTD Bottled Cocktails Market Outlook by Category
By Product Type:
- Cider
- Gin
- Vodka
- Wine
- Whiskey
- Rum
- Hard Sheltzer
- Cocktail
By Flavour:
- Natural/Unflavored
- Flavored
- Citrus
- Ginger
- Apple
- Vanilla
- Berry
- Tropical
- Coconut
- Jerk
- Plantain
- Mixed Fruits
- Others
By Price Range:
- Economic
- Mid-Range
- Premium
By Sales Channel:
- On-Trade/Food Service
- Institutional Sale
- Retail
- Hyper Market/Super market
- Convenience Store
- Specialty Stores
- Liquor Shop/Beverage Exclusive
- Airport Retail
- Online Retail
By Packaging:
- Glass
- Plastic
By Region:
- North America
- Latin America
- Europe
- East Asia
- South Asia
- Oceania
- Middle East & Africa
Frequently Asked Questions
The RTD bottled cocktails market is estimated to reach nearly US$ 16,073.1 Mn by 2022.
The RTD bottled cocktails market is expected to grow at a CAGR of around 10.9% during the forecast period of 2022-2032.
The RTD bottled cocktails market showcased a CAGR of around 8.5% over the past half-decade.
The global RTD bottled cocktails market size is projected to be US$ 45,228.8 Mn in 2032.
Availability of omni channel buying options, at-home shopping and drinking trend, and influence of social media are the primary drivers propelling the global RTD bottled cocktails market.
Increasing focus of leading players on capacity expansion will help them to increase sales in the RTD bottled cocktails market during the upcoming decade.
Bottoms Up Cocktail, Diageo plc, Brown Farman, Bacardi Inc., and RTM Beverages Ltd. are the key players operating in the RTD bottled cocktails market.
The U.S., Australia, China, New Zealand, and India are the top countries driving the RTD bottled cocktails market.
Demand for RTD bottled cocktails in North America is expected to grow at 10.1% CAGR through 2032.
India is expected to account for over 38.1% of the market share in South Asia in 2022.
Table of Content
1. Executive Summary
1.1. Global Market Outlook
1.2. Demand-side Trends
1.3. Supply-side Trends
1.4. Technology Roadmap Analysis
1.5. Analysis and Recommendations
2. Market Overview
2.1. Market Coverage / Taxonomy
2.2. Market Definition / Scope / Limitations
3. The Massive Impact of the Crisis
3.1. Global RTD Bottled Cocktails Market Forecast Scenario Comparison of Annual Growth Rates for Sshort Term (2022-2026) and Long Term (2027-2032)
3.1.1. Optimistic Scenario
3.1.1.1. China
3.1.1.2. US
3.1.1.3. India
3.1.1.4. Euro Zone
3.1.1.5. Asia Pacific
3.1.1.6. Rest of the World
3.1.2. Likely Scenario
3.1.2.1. China
3.1.2.2. US
3.1.2.3. India
3.1.2.4. Euro Zone
3.1.2.5. Asia Pacific
3.1.2.6. Rest of the World
3.1.3. Pessimistic Scenario
3.1.3.1. China
3.1.3.2. US
3.1.3.3. India
3.1.3.4. Euro Zone
3.1.3.5. Asia Pacific
3.1.3.6. Rest of the World
3.2. Key Factors Impacting the Market
3.3. Note: Market Assessment shall be Provided for Likely Scenario
4. Market Dynamics
4.1. Drivers
4.1.1. Supply Side Drivers
4.1.2. Demand Side drivers
4.1.3. Economic Side Drivers
4.2. Restraints
4.3. Opportunity
4.4. Market Ttrends By Region
4.5. Product Launches
4.6. Product Claims & Nutritional Information Scan by Buyers
4.7. Macro-Economic Factors
4.8. Forecast Factors - Relevance & Impact
4.9. Consumers Survey Analysis
5. Key Regulations
5.1. Packaging & Labelling Regulations
5.2. Certifications and Certifying Agency Overview
5.3. Import/Export Policies
6. Global RTD Bottled Cocktails Market Demand Analysis 2017-2021 and Forecast, 2022-2032
6.1. Historical Market Volume (TL) Analysis, 2017-2021
6.2. Current and Future Market Volume (TL) Projections, 2022-2032
6.3. Y-o-Y Growth Trend Analysis
7. Global RTD Bottled Cocktails Market - Pricing Analysis
7.1. Regional Pricing Analysis (USD/TL) By Product Type (2017,2022,2032)
7.1.1. Cider
7.1.2. Gin
7.1.3. Vodka
7.1.4. Wine
7.1.5. Whiskey
7.1.6. Rum
7.1.7. Hard Sheltzer
7.1.8. Cocktail
7.2. Pricing Break-up (2017,2022,2032)
7.2.1. Producer Level Pricing
7.2.2. Distributor Level Pricing
7.2.3. Retailer Level Pricing
7.3. Global Average Pricing Analysis Benchmark
8. Global RTD Bottled Cocktails Market Demand (Size in USD Mn) Analysis 2017-2021 and Forecast, 2022-2032
8.1. Historical Market Value (USD Mn) Analysis, 2017-2021
8.2. Current and Future Market Value (USD Mn) Projections, 2022-2032
8.2.1. Y-o-Y Growth Trend Analysis
8.2.2. Absolute $ Opportunity Analysis
9. Global RTD Bottled Cocktails Market Analysis 2017-2021 and Forecast 2022-2032, By Product Type
9.1. Introduction / Key Findings
9.2. Historical Market Size (USD Mn) and Volume Analysis By Product Type, 2017-2021
9.3. Current and Future Market Size (USD Mn) and Volume Analysis and Forecast By Product Type, 2022-2032
9.3.1. Cider
9.3.2. Gin
9.3.3. Vodka
9.3.4. Wine
9.3.5. Whiskey
9.3.6. Rum
9.3.7. Hard Sheltzer
9.3.8. Cocktail
9.4. Market Attractiveness Analysis By Product Type
10. Global RTD Bottled Cocktails Market Analysis 2017-2021 and Forecast 2022-2032, By Flavour
10.1. Introduction / Key Findings
10.2. Historical Market Size (USD Mn) and Volume Analysis By Flavour, 2017-2021
10.3. Current and Future Market Size (USD Mn) and Volume Analysis and Forecast By Flavour, 2022-2032
10.3.1. Natural/Unflavoured
10.3.2. Flavoured
10.3.2.1. Citrus
10.3.2.2. Ginger
10.3.2.3. Apple
10.3.2.4. Vanilla
10.3.2.5. Berry
10.3.2.6. Tropical
10.3.2.7. Coconut
10.3.2.8. Jerk
10.3.2.9. Plantain
10.3.2.10. Mixed Fruits
10.3.2.11. Others
10.4. Market Attractiveness Analysis By Flavour
11. Global RTD Bottled Cocktails Market Analysis 2017-2021 and Forecast 2022-2032, By Price Range
11.1. Introduction / Key Findings
11.2. Historical Market Size (USD Mn) and Volume Analysis By Price Range, 2017-2021
11.3. Current and Future Market Size (USD Mn) and Volume Analysis and Forecast By Price Range, 2022-2032
11.3.1. Economic
11.3.2. Mid-Range
11.3.3. Premium
11.4. Market Attractiveness Analysis By Price Range
12. Global RTD Bottled Cocktails Market Analysis 2017-2021 and Forecast 2022-2032, By Sales Channel
12.1. Introduction / Key Findings
12.2. Historical Market Size (USD Mn) and Volume Analysis By Sales Channel, 2017-2021
12.3. Current and Future Market Size (USD Mn) and Volume Analysis and Forecast By Sales Channel, 2022-2032
12.3.1. On-Trade/Food Service
12.3.2. Institutional Sale
12.3.3. Retail
12.3.3.1. Hyper Mmarket/Super market
12.3.3.2. Convenience Store
12.3.3.3. Specialty Stores
12.3.3.4. Liquor Shop/Beverage Exclusive
12.3.3.5. Airport Retail
12.3.4. Online Retail
12.4. Market Attractiveness Analysis By Sales Channel
13. Global RTD Bottled Cocktails Market Analysis 2017-2021 and Forecast 2022-2032, By Packaging
13.1. Introduction / Key Findings
13.2. Historical Market Size (USD Mn) and Volume Analysis By Packaging, 2017-2021
13.3. Current and Future Market Size (USD Mn) and Volume Analysis and Forecast By Packaging, 2022-2032
13.3.1. Glass
13.3.2. Plastic
13.4. Market Attractiveness Analysis By Packaging
14. Global RTD Bottled Cocktails Market Analysis 2017-2021 and Forecast 2022-2032, By Region
14.1. Introduction
14.2. Historical Market Size (USD Mn) and Volume Analysis By Region, 2017-2021
14.3. Current Market Size (USD Mn) and Volume Analysis and Forecast By Region, 2022-2032
14.3.1. North America
14.3.2. Latin America
14.3.3. Europe
14.3.4. East Asia
14.3.5. South Asia
14.3.6. Oceania
14.3.7. Middle East and Africa (MEA)
14.4. Market Attractiveness Analysis By Region
15. North America RTD Bottled Cocktails Market Analysis 2017-2021 and Forecast 2022-2032
15.1. Introduction
15.2. Pricing Analysis
15.3. Historical Market Size (USD Mn) and Volume Trend Analysis By Market Taxonomy, 2017-2021
15.4. Market Size (USD Mn) and Volume Forecast By Market Taxonomy, 2022-2032
15.4.1. By Country
15.4.1.1. U.S.
15.4.1.2. Canada
15.4.2. By Product Type
15.4.3. By Flavour
15.4.4. By Price Range
15.4.5. By Sales Channel
15.4.6. By Packaging
15.5. Market Attractiveness Analysis
15.5.1. By Product Type
15.5.2. By Flavour
15.5.3. By Price Range
15.5.4. By Sales Channel
15.5.5. By Packaging
15.6. Market Trends
15.7. Key Market Participants - Intensity Mapping
15.8. Drivers and Restraints - Impact Analysis
16. Latin America RTD Bottled Cocktails Market Analysis 2017-2021 and Forecast 2022-2032
16.1. Introduction
16.2. Pricing Analysis
16.3. Historical Market Size (USD Mn) and Volume Trend Analysis By Market Taxonomy, 2017-2021
16.4. Market Size (USD Mn) and Volume Forecast By Market Taxonomy, 2022-2032
16.4.1. By Country
16.4.1.1. Brazil
16.4.1.2. Mexico
16.4.1.3. Argentina
16.4.1.4. Peru
16.4.1.5. Chile
16.4.1.6. Rest of Latin America
16.4.2. By Product Type
16.4.3. By Flavour
16.4.4. By Price Range
16.4.5. By Sales Channel
16.4.6. By Packaging
16.5. Market Attractiveness Analysis
16.5.1. By Product Type
16.5.2. By Flavour
16.5.3. By Price Range
16.5.4. By Sales Channel
16.5.5. By Packaging
16.6. Market Trends
16.7. Key Market Participants - Intensity Mapping
16.8. Drivers and Restraints - Impact Analysis
17. Europe RTD Bottled Cocktails Market Analysis 2017-2021 and Forecast 2022-2032
17.1. Introduction
17.2. Pricing Analysis
17.3. Historical Market Size (USD Mn) and Volume Trend Analysis By Market Taxonomy, 2017-2021
17.4. Market Size (USD Mn) and Volume Forecast By Market Taxonomy, 2022-2032
17.4.1. By Country
17.4.1.1. Germany
17.4.1.2. France
17.4.1.3. Italy
17.4.1.4. Spain
17.4.1.5. UK
17.4.1.6. Benelux
17.4.1.7. Nordic
17.4.1.8. Russia
17.4.1.9. Poland
17.4.1.10. Rest of Europe
17.4.2. By Product Type
17.4.3. By Flavour
17.4.4. By Price Range
17.4.5. By Sales Channel
17.4.6. By Packaging
17.5. Market Attractiveness Analysis
17.5.1. By Product Type
17.5.2. By Flavour
17.5.3. By Price Range
17.5.4. By Sales Channel
17.5.5. By Packaging
17.6. Market Trends
17.7. Key Market Participants - Intensity Mapping
17.8. Drivers and Restraints - Impact Analysis
18. East Asia RTD Bottled Cocktails Market Analysis 2017-2021 and Forecast 2022-2032
18.1. Introduction
18.2. Pricing Analysis
18.3. Historical Market Size (USD Mn) and Volume Trend Analysis By Market Taxonomy, 2017-2021
18.4. Market Size (USD Mn) and Volume Forecast By Market Taxonomy, 2022-2032
18.4.1. By Country
18.4.1.1. China
18.4.1.2. Japan
18.4.1.3. South Korea
18.4.2. By Product Type
18.4.3. By Flavour
18.4.4. By Price Range
18.4.5. By Sales Channel
18.4.6. By Packaging
18.5. Market Attractiveness Analysis
18.5.1. By Product Type
18.5.2. By Flavour
18.5.3. By Price Range
18.5.4. By Sales Channel
18.5.5. By Packaging
18.6. Market Trends
18.7. Key Market Participants - Intensity Mapping
18.8. Drivers and Restraints - Impact Analysis
19. South Asia RTD Bottled Cocktails Market Analysis 2017-2021 and Forecast 2022-2032
19.1. Introduction
19.2. Pricing Analysis
19.3. Historical Market Size (USD Mn) and Volume Trend Analysis By Market Taxonomy, 2017-2021
19.4. Market Size (USD Mn) and Volume Forecast By Market Taxonomy, 2022-2032
19.4.1. By Country
19.4.1.1. India
19.4.1.2. Thailand
19.4.1.3. Indonesia
19.4.1.4. Malaysia
19.4.1.5. Singapore
19.4.1.6. Rest of South Asia
19.4.2. By Product Type
19.4.3. By Flavour
19.4.4. By Price Range
19.4.5. By Sales Channel
19.4.6. By Packaging
19.5. Market Attractiveness Analysis
19.5.1. By Product Type
19.5.2. By Flavour
19.5.3. By Price Range
19.5.4. By Sales Channel
19.5.5. By Packaging
19.6. Market Trends
19.7. Key Market Participants - Intensity Mapping
19.8. Drivers and Restraints - Impact Analysis
20. Oceania RTD Bottled Cocktails Market Analysis 2017-2021 and Forecast 2022-2032
20.1. Introduction
20.2. Pricing Analysis
20.3. Historical Market Size (USD Mn) and Volume Trend Analysis By Market Taxonomy, 2017-2021
20.4. Market Size (USD Mn) and Volume Forecast By Market Taxonomy, 2022-2032
20.4.1. By Country
20.4.1.1. Australia
20.4.1.2. New Zealand
20.4.2. By Product Type
20.4.3. By Flavour
20.4.4. By Price Range
20.4.5. By Sales Channel
20.4.6. By Packaging
20.5. Market Attractiveness Analysis
20.5.1. By Product Type
20.5.2. By Flavour
20.5.3. By Price Range
20.5.4. By Sales Channel
20.5.5. By Packaging
20.6. Market Trends
20.7. Key Market Participants - Intensity Mapping
20.8. Drivers and Restraints - Impact Analysis
21. Middle East and Africa RTD Bottled Cocktails Market Analysis 2017-2021 and Forecast 2022-2032
21.1. Introduction
21.2. Pricing Analysis
21.3. Historical Market Size (USD Mn) and Volume Trend Analysis By Market Taxonomy, 2017-2021
21.4. Market Size (USD Mn) and Volume Forecast By Market Taxonomy, 2022-2032
21.4.1. By Country
21.4.1.1. GCC Countries
21.4.1.2. Turkey
21.4.1.3. South Africa
21.4.1.4. North Africa
21.4.1.5. Central Africa
21.4.2. By Product Type
21.4.3. By Flavour
21.4.4. By Price Range
21.4.5. By Sales Channel
21.4.6. By Packaging
21.5. Market Attractiveness Analysis
21.5.1. By Product Type
21.5.2. By Flavour
21.5.3. By Price Range
21.5.4. By Sales Channel
21.5.5. By Packaging
21.6. Market Trends
21.7. Key Market Participants - Intensity Mapping
21.8. Drivers and Restraints - Impact Analysis
22. Key Countries RTD Bottled Cocktails Market Analysis 2017-2021 and Forecast 2022-2032
22.1. U.S.
22.1.1. Pricing Analysis (2017, 2022, 2032)
22.1.2. Market Value and Volume Analysis 2017-2021 and Forecast 2022-2032
22.1.2.1. By Product Type
22.1.2.2. By Flavour
22.1.2.3. By Price Range
22.1.2.4. By Sales Channel
22.1.2.5. By Packaging
22.2. Canada
22.2.1. Pricing Analysis (2017, 2022, 2032)
22.2.2. Market Value and Volume Analysis 2017-2021 and Forecast 2022-2032
22.2.2.1. By Product Type
22.2.2.2. By Flavour
22.2.2.3. By Price Range
22.2.2.4. By Sales Channel
22.2.2.5. By Packaging
22.3. Brazil
22.3.1. Pricing Analysis (2017, 2022, 2032)
22.3.2. Market Value and Volume Analysis 2017-2021 and Forecast 2022-2032
22.3.2.1. By Product Type
22.3.2.2. By Flavour
22.3.2.3. By Price Range
22.3.2.4. By Sales Channel
22.3.2.5. By Packaging
22.4. Mexico
22.4.1. Pricing Analysis (2017, 2022, 2032)
22.4.2. Market Value and Volume Analysis 2017-2021 and Forecast 2022-2032
22.4.2.1. By Product Type
22.4.2.2. By Flavour
22.4.2.3. By Price Range
22.4.2.4. By Sales Channel
22.4.2.5. By Packaging
22.5. Argentina
22.5.1. Pricing Analysis (2017, 2022, 2032)
22.5.2. Market Value and Volume Analysis 2017-2021 and Forecast 2022-2032
22.5.2.1. By Product Type
22.5.2.2. By Flavour
22.5.2.3. By Price Range
22.5.2.4. By Sales Channel
22.5.2.5. By Packaging
22.6. Peru
22.6.1. Pricing Analysis (2017, 2022, 2032)
22.6.2. Market Value and Volume Analysis 2017-2021 and Forecast 2022-2032
22.6.2.1. By Product Type
22.6.2.2. By Flavour
22.6.2.3. By Price Range
22.6.2.4. By Sales Channel
22.6.2.5. By Packaging
22.7. Chile
22.7.1. Pricing Analysis (2017, 2022, 2032)
22.7.2. Market Value and Volume Analysis 2017-2021 and Forecast 2022-2032
22.7.2.1. By Product Type
22.7.2.2. By Flavour
22.7.2.3. By Price Range
22.7.2.4. By Sales Channel
22.7.2.5. By Packaging
22.8. Germany
22.8.1. Pricing Analysis (2017, 2022, 2032)
22.8.2. Market Value and Volume Analysis 2017-2021 and Forecast 2022-2032
22.8.2.1. By Product Type
22.8.2.2. By Flavour
22.8.2.3. By Price Range
22.8.2.4. By Sales Channel
22.8.2.5. By Packaging
22.9. Italy
22.9.1. Pricing Analysis (2017, 2022, 2032)
22.9.2. Market Value and Volume Analysis 2017-2021 and Forecast 2022-2032
22.9.2.1. By Product Type
22.9.2.2. By Flavour
22.9.2.3. By Price Range
22.9.2.4. By Sales Channel
22.9.2.5. By Packaging
22.10. France
22.10.1. Pricing Analysis (2017, 2022, 2032)
22.10.2. Market Value and Volume Analysis 2017-2021 and Forecast 2022-2032
22.10.2.1. By Product Type
22.10.2.2. By Flavour
22.10.2.3. By Price Range
22.10.2.4. By Sales Channel
22.10.2.5. By Packaging
22.11. U.K.
22.11.1. Pricing Analysis (2017, 2022, 2032)
22.11.2. Market Value and Volume Analysis 2017-2021 and Forecast 2022-2032
22.11.2.1. By Product Type
22.11.2.2. By Flavour
22.11.2.3. By Price Range
22.11.2.4. By Sales Channel
22.11.2.5. By Packaging
22.12. Spain
22.12.1. Pricing Analysis (2017, 2022, 2032)
22.12.2. Market Value and Volume Analysis 2017-2021 and Forecast 2022-2032
22.12.2.1. By Product Type
22.12.2.2. By Flavour
22.12.2.3. By Price Range
22.12.2.4. By Sales Channel
22.12.2.5. By Packaging
22.13. Benelux
22.13.1. Pricing Analysis (2017, 2022, 2032)
22.13.2. Market Value and Volume Analysis 2017-2021 and Forecast 2022-2032
22.13.2.1. By Product Type
22.13.2.2. By Flavour
22.13.2.3. By Price Range
22.13.2.4. By Sales Channel
22.13.2.5. By Packaging
22.14. Russia
22.14.1. Pricing Analysis (2017, 2022, 2032)
22.14.2. Market Value and Volume Analysis 2017-2021 and Forecast 2022-2032
22.14.2.1. By Product Type
22.14.2.2. By Flavour
22.14.2.3. By Price Range
22.14.2.4. By Sales Channel
22.14.2.5. By Packaging
22.15. Nordic
22.15.1. Pricing Analysis (2017, 2022, 2032)
22.15.2. Market Value and Volume Analysis 2017-2021 and Forecast 2022-2032
22.15.2.1. By Product Type
22.15.2.2. By Flavour
22.15.2.3. By Price Range
22.15.2.4. By Sales Channel
22.15.2.5. By Packaging
22.16. Poland
22.16.1. Pricing Analysis (2017, 2022, 2032)
22.16.2. Market Value and Volume Analysis 2017-2021 and Forecast 2022-2032
22.16.2.1. By Product Type
22.16.2.2. By Flavour
22.16.2.3. By Price Range
22.16.2.4. By Sales Channel
22.16.2.5. By Packaging
22.17. China
22.17.1. Pricing Analysis (2017, 2022, 2032)
22.17.2. Market Value and Volume Analysis 2017-2021 and Forecast 2022-2032
22.17.2.1. By Product Type
22.17.2.2. By Flavour
22.17.2.3. By Price Range
22.17.2.4. By Sales Channel
22.17.2.5. By Packaging
22.18. Japan
22.18.1. Pricing Analysis (2017, 2022, 2032)
22.18.2. Market Value and Volume Analysis 2017-2021 and Forecast 2022-2032
22.18.2.1. By Product Type
22.18.2.2. By Flavour
22.18.2.3. By Price Range
22.18.2.4. By Sales Channel
22.18.2.5. By Packaging
22.19. South Korea
22.19.1. Pricing Analysis (2017, 2022, 2032)
22.19.2. Market Value and Volume Analysis 2017-2021 and Forecast 2022-2032
22.19.2.1. By Product Type
22.19.2.2. By Flavour
22.19.2.3. By Price Range
22.19.2.4. By Sales Channel
22.19.2.5. By Packaging
22.20. India
22.20.1. Pricing Analysis (2017, 2022, 2032)
22.20.2. Market Value and Volume Analysis 2017-2021 and Forecast 2022-2032
22.20.2.1. By Product Type
22.20.2.2. By Flavour
22.20.2.3. By Price Range
22.20.2.4. By Sales Channel
22.20.2.5. By Packaging
22.21. Thailand
22.21.1. Pricing Analysis (2017, 2022, 2032)
22.21.2. Market Value and Volume Analysis 2017-2021 and Forecast 2022-2032
22.21.2.1. By Product Type
22.21.2.2. By Flavour
22.21.2.3. By Price Range
22.21.2.4. By Sales Channel
22.21.2.5. By Packaging
22.22. Malaysia
22.22.1. Pricing Analysis (2017, 2022, 2032)
22.22.2. Market Value and Volume Analysis 2017-2021 and Forecast 2022-2032
22.22.2.1. By Product Type
22.22.2.2. By Flavour
22.22.2.3. By Price Range
22.22.2.4. By Sales Channel
22.22.2.5. By Packaging
22.23. Indonesia
22.23.1. Pricing Analysis (2017, 2022, 2032)
22.23.2. Market Value and Volume Analysis 2017-2021 and Forecast 2022-2032
22.23.2.1. By Product Type
22.23.2.2. By Flavour
22.23.2.3. By Price Range
22.23.2.4. By Sales Channel
22.23.2.5. By Packaging
22.24. Singapore
22.24.1. Pricing Analysis (2017, 2022, 2032)
22.24.2. Market Value and Volume Analysis 2017-2021 and Forecast 2022-2032
22.24.2.1. By Product Type
22.24.2.2. By Flavour
22.24.2.3. By Price Range
22.24.2.4. By Sales Channel
22.24.2.5. By Packaging
22.25. Australia
22.25.1. Pricing Analysis (2017, 2022, 2032)
22.25.2. Market Value and Volume Analysis 2017-2021 and Forecast 2022-2032
22.25.2.1. By Product Type
22.25.2.2. By Flavour
22.25.2.3. By Price Range
22.25.2.4. By Sales Channel
22.25.2.5. By Packaging
22.26. New Zealand
22.26.1. Pricing Analysis (2017, 2022, 2032)
22.26.2. Market Value and Volume Analysis 2017-2021 and Forecast 2022-2032
22.26.2.1. By Product Type
22.26.2.2. By Flavour
22.26.2.3. By Price Range
22.26.2.4. By Sales Channel
22.26.2.5. By Packaging
22.27. GCC Countries
22.27.1. Pricing Analysis (2017, 2022, 2032)
22.27.2. Market Value and Volume Analysis 2017-2021 and Forecast 2022-2032
22.27.2.1. By Product Type
22.27.2.2. By Flavour
22.27.2.3. By Price Range
22.27.2.4. By Sales Channel
22.27.2.5. By Packaging
22.28. Turkey
22.28.1. Pricing Analysis (2017, 2022, 2032)
22.28.2. Market Value and Volume Analysis 2017-2021 and Forecast 2022-2032
22.28.2.1. By Product Type
22.28.2.2. By Flavour
22.28.2.3. By Price Range
22.28.2.4. By Sales Channel
22.28.2.5. By Packaging
22.29. North Africa
22.29.1. Pricing Analysis (2017, 2022, 2032)
22.29.2. Market Value and Volume Analysis 2017-2021 and Forecast 2022-2032
22.29.2.1. By Product Type
22.29.2.2. By Flavour
22.29.2.3. By Price Range
22.29.2.4. By Sales Channel
22.29.2.5. By Packaging
22.30. Central Africa
22.30.1. Pricing Analysis (2017, 2022, 2032)
22.30.2. Market Value and Volume Analysis 2017-2021 and Forecast 2022-2032
22.30.2.1. By Product Type
22.30.2.2. By Flavour
22.30.2.3. By Price Range
22.30.2.4. By Sales Channel
22.30.2.5. By Packaging
22.31. South Africa
22.31.1. Pricing Analysis (2017, 2022, 2032)
22.31.2. Market Value and Volume Analysis 2017-2021 and Forecast 2022-2032
22.31.2.1. By Product Type
22.31.2.2. By Flavour
22.31.2.3. By Price Range
22.31.2.4. By Sales Channel
22.31.2.5. By Packaging
23. Market Structure Analysis
23.1. Market Analysis by Tier of Companies
23.2. Company Share Analysis of Top Players
23.2.1. Product Type
23.2.2. By Region
23.3. Market Presence Analysis
23.3.1. By Regional Footprint of Players
23.3.2. Product Footprint by Players
23.3.3. Channel Footprint by Players
24. Competition Analysis
24.1. Competition Dashboard
24.2. Competition Deep Dive (Tentative List)
24.2.1. Diageo plc
24.2.1.1. Overview
24.2.1.2. Product Portfolio
24.2.1.3. Profitability by Market Segments (Product/Channel/Region)
24.2.1.4. Sales Footprint
24.2.1.5. Strategy Overview
24.2.1.5.1. Marketing Strategy
24.2.1.5.2. Product Strategy
24.2.2. Bottoms up cocktail
24.2.2.1. Overview
24.2.2.2. Product Portfolio
24.2.2.3. Profitability by Market Segments (Product/Channel/Region)
24.2.2.4. Sales Footprint
24.2.2.5. Strategy Overview
24.2.2.5.1. Marketing Strategy
24.2.2.5.2. Product Strategy
24.2.3. Brown Farman
24.2.3.1. Overview
24.2.3.2. Product Portfolio
24.2.3.3. Profitability by Market Segments (Product/Channel/Region)
24.2.3.4. Sales Footprint
24.2.3.5. Strategy Overview
24.2.3.5.1. Marketing Strategy
24.2.3.5.2. Product Strategy
24.2.4. Bacardi Inc.
24.2.4.1. Overview
24.2.4.2. Product Portfolio
24.2.4.3. Profitability by Market Segments (Product/Channel/Region)
24.2.4.4. Sales Footprint
24.2.4.5. Strategy Overview
24.2.4.5.1. Marketing Strategy
24.2.4.5.2. Product Strategy
24.2.5. RTM Beverages Ltd.
24.2.5.1. Overview
24.2.5.2. Product Portfolio
24.2.5.3. Profitability by Market Segments (Product/Channel/Region)
24.2.5.4. Sales Footprint
24.2.5.5. Strategy Overview
24.2.5.5.1. Marketing Strategy
24.2.5.5.2. Product Strategy
24.2.6. The Kraken
24.2.6.1. Overview
24.2.6.2. Product Portfolio
24.2.6.3. Profitability by Market Segments (Product/Channel/Region)
24.2.6.4. Sales Footprint
24.2.6.5. Strategy Overview
24.2.6.5.1. Marketing Strategy
24.2.6.5.2. Product Strategy
24.2.7. Mark Anthony Group, Inc.
24.2.7.1. Overview
24.2.7.2. Product Portfolio
24.2.7.3. Profitability by Market Segments (Product/Channel/Region)
24.2.7.4. Sales Footprint
24.2.7.5. Strategy Overview
24.2.7.5.1. Marketing Strategy
24.2.7.5.2. Product Strategy
24.2.8. High West Distillery
24.2.8.1. Overview
24.2.8.2. Product Portfolio
24.2.8.3. Profitability by Market Segments (Product/Channel/Region)
24.2.8.4. Sales Footprint
24.2.8.5. Strategy Overview
24.2.8.5.1. Marketing Strategy
24.2.8.5.2. Product Strategy
24.2.9. Pernod Ricard SA
24.2.9.1. Overview
24.2.9.2. Product Portfolio
24.2.9.3. Profitability by Market Segments (Product/Channel/Region)
24.2.9.4. Sales Footprint
24.2.9.5. Strategy Overview
24.2.9.5.1. Marketing Strategy
24.2.9.5.2. Product Strategy
24.2.10. Suntory Holdings Limited
24.2.10.1. Overview
24.2.10.2. Product Portfolio
24.2.10.3. Profitability by Market Segments (Product/Channel/Region)
24.2.10.4. Sales Footprint
24.2.10.5. Strategy Overview
24.2.10.5.1. Marketing Strategy
24.2.10.5.2. Product Strategy
24.2.11. Other Players (On Additional Requests)
24.2.11.1. Overview
24.2.11.2. Product Portfolio
24.2.11.3. Profitability by Market Segments (Product/Channel/Region)
24.2.11.4. Sales Footprint
24.2.11.5. Strategy Overview
24.2.11.5.1. Marketing Strategy
24.2.11.5.2. Product Strategy
25. Value Chain Analysis
25.1. Operating Margins at Each Node of Supply Chain
25.2. List of Active Market Participants
25.2.1. Product Manufacturers
25.2.2. Key Brands
26. Assumptions and Acronyms Used
27. Research Methodology
Let us know your requirement to get
100% FREE customization
List of Tables
Table 1: Global RTD Bottled Cocktails Market Value (US$ Mn) and Forecast by Region, 2017–2021
Table 2: Global RTD Bottled Cocktails Market Value (US$ Mn) and Forecast by Region, 2022–2032
Table 3: Global RTD Bottled Cocktails Market Volume (TL) and Forecast by Region, 2017–2021
Table 4: Global RTD Bottled Cocktails Market Volume (TL) and Forecast by Region, 2022–2032
Table 5: Global RTD Bottled Cocktails Market Value (US$ Mn) and Forecast by Product Type, 2017–2021
Table 6: Global RTD Bottled Cocktails Market Value (US$ Mn) and Forecast by Product Type, 2022–2032
Table 7: Global RTD Bottled Cocktails Market Volume (TL) and Forecast by Product Type, 2017–2021
Table 8: Global RTD Bottled Cocktails Market Volume (TL) and Forecast by Product Type, 2022–2032
Table 9: Global RTD Bottled Cocktails Market Value (US$ Mn) and Forecast by Flavour, 2017–2021
Table 10: Global RTD Bottled Cocktails Market Value (US$ Mn) and Forecast by Flavour, 2022–2032
Table 11: Global RTD Bottled Cocktails Market Volume (TL) and Forecast by Flavour, 2017–2021
Table 12: Global RTD Bottled Cocktails Market Volume (TL) and Forecast by Flavour, 2022–2032
Table 13: Global RTD Bottled Cocktails Market Value (US$ Mn) and Forecast by Price Range, 2017–2021
Table 14: Global RTD Bottled Cocktails Market Value (US$ Mn) and Forecast by Price Range, 2022–2032
Table 15: Global RTD Bottled Cocktails Market Volume (TL) and Forecast by Price Range, 2017–2021
Table 16: Global RTD Bottled Cocktails Market Volume (TL) and Forecast by Price Range, 2022–2032
Table 17: Global RTD Bottled Cocktails Market Value (US$ Mn) and Forecast by Sales Channel, 2017–2021
Table 18: Global RTD Bottled Cocktails Market Value (US$ Mn) and Forecast by Sales Channel, 2022–2032
Table 19: Global RTD Bottled Cocktails Market Volume (TL) and Forecast by Sales Channel, 2017–2021
Table 20: Global RTD Bottled Cocktails Market Volume (TL) and Forecast by Sales Channel, 2022–2032
Table 21: Global RTD Bottled Cocktails Market Value (US$ Mn) and Forecast by Packaging, 2017–2021
Table 22: Global RTD Bottled Cocktails Market Value (US$ Mn) and Forecast by Packaging, 2022–2032
Table 23: Global RTD Bottled Cocktails Market Volume (TL) and Forecast by Packaging, 2017–2021
Table 24: Global RTD Bottled Cocktails Market Volume (TL) and Forecast by Packaging, 2022–2032
Table 25: North America RTD Bottled Cocktails Market Value (US$ Mn) and Forecast by Country, 2017–2021
Table 26: North America RTD Bottled Cocktails Market Value (US$ Mn) and Forecast by Country, 2022–2032
Table 27: North America RTD Bottled Cocktails Market Volume (TL) and Forecast by Country, 2017–2021
Table 28: North America RTD Bottled Cocktails Market Volume (TL) and Forecast by Country, 2022–2032
Table 29: North America RTD Bottled Cocktails Market Value (US$ Mn) and Forecast by Product Type, 2017–2021
Table 30: North America RTD Bottled Cocktails Market Value (US$ Mn) and Forecast by Product Type, 2022–2032
Table 31: North America RTD Bottled Cocktails Market Volume (TL) and Forecast by Product Type, 2017–2021
Table 32: North America RTD Bottled Cocktails Market Volume (TL) and Forecast by Product Type, 2022–2032
Table 33: North America RTD Bottled Cocktails Market Value (US$ Mn) and Forecast by Flavour, 2017–2021
Table 34: North America RTD Bottled Cocktails Market Value (US$ Mn) and Forecast by Flavour, 2022–2032
Table 35: North America RTD Bottled Cocktails Market Volume (TL) and Forecast by Flavour, 2017–2021
Table 36: North America RTD Bottled Cocktails Market Volume (TL) and Forecast by Flavour, 2022–2032
Table 37: North America RTD Bottled Cocktails Market Value (US$ Mn) and Forecast by Price Range, 2017–2021
Table 38: North America RTD Bottled Cocktails Market Value (US$ Mn) and Forecast by Price Range, 2022–2032
Table 39: North America RTD Bottled Cocktails Market Volume (TL) and Forecast by Price Range, 2017–2021
Table 40: North America RTD Bottled Cocktails Market Volume (TL) and Forecast by Price Range, 2022–2032
Table 41: North America RTD Bottled Cocktails Market Value (US$ Mn) and Forecast by Sales Channel, 2017–2021
Table 42: North America RTD Bottled Cocktails Market Value (US$ Mn) and Forecast by Sales Channel, 2022–2032
Table 43: North America RTD Bottled Cocktails Market Volume (TL) and Forecast by Sales Channel, 2017–2021
Table 44: North America RTD Bottled Cocktails Market Volume (TL) and Forecast by Sales Channel, 2022–2032
Table 45: North America RTD Bottled Cocktails Market Value (US$ Mn) and Forecast by Packaging, 2017–2021
Table 46: North America RTD Bottled Cocktails Market Value (US$ Mn) and Forecast by Packaging, 2022–2032
Table 47: North America RTD Bottled Cocktails Market Volume (TL) and Forecast by Packaging, 2017–2021
Table 48: North America RTD Bottled Cocktails Market Volume (TL) and Forecast by Packaging, 2022–2032
Table 49: Latin America RTD Bottled Cocktails Market Value (US$ Mn) and Forecast by Country, 2017–2021
Table 50: Latin America RTD Bottled Cocktails Market Value (US$ Mn) and Forecast by Country, 2022–2032
Table 51: Latin America RTD Bottled Cocktails Market Volume (TL) and Forecast by Country, 2017–2021
Table 52: Latin America RTD Bottled Cocktails Market Volume (TL) and Forecast by Country, 2022–2032
Table 53: Latin America RTD Bottled Cocktails Market Value (US$ Mn) and Forecast by Product Type, 2017–2021
Table 54: Latin America RTD Bottled Cocktails Market Value (US$ Mn) and Forecast by Product Type, 2022–2032
Table 55: Latin America RTD Bottled Cocktails Market Volume (TL) and Forecast by Product Type, 2017–2021
Table 56: Latin America RTD Bottled Cocktails Market Volume (TL) and Forecast by Product Type, 2022–2032
Table 57: Latin America RTD Bottled Cocktails Market Value (US$ Mn) and Forecast by Flavour, 2017–2021
Table 58: Latin America RTD Bottled Cocktails Market Value (US$ Mn) and Forecast by Flavour, 2022–2032
Table 59: Latin America RTD Bottled Cocktails Market Volume (TL) and Forecast by Flavour, 2017–2021
Table 60: Latin America RTD Bottled Cocktails Market Volume (TL) and Forecast by Flavour, 2022–2032
Table 61: Latin America RTD Bottled Cocktails Market Value (US$ Mn) and Forecast by Price Range, 2017–2021
Table 62: Latin America RTD Bottled Cocktails Market Value (US$ Mn) and Forecast by Price Range, 2022–2032
Table 63: Latin America RTD Bottled Cocktails Market Volume (TL) and Forecast by Price Range, 2017–2021
Table 64: Latin America RTD Bottled Cocktails Market Volume (TL) and Forecast by Price Range, 2022–2032
Table 65: Latin America RTD Bottled Cocktails Market Value (US$ Mn) and Forecast by Sales Channel, 2017–2021
Table 66: Latin America RTD Bottled Cocktails Market Value (US$ Mn) and Forecast by Sales Channel, 2022–2032
Table 67: Latin America RTD Bottled Cocktails Market Volume (TL) and Forecast by Sales Channel, 2017–2021
Table 68: Latin America RTD Bottled Cocktails Market Volume (TL) and Forecast by Sales Channel, 2022–2032
Table 69: Latin America RTD Bottled Cocktails Market Value (US$ Mn) and Forecast by Packaging, 2017–2021
Table 70: Latin America RTD Bottled Cocktails Market Value (US$ Mn) and Forecast by Packaging, 2022–2032
Table 71: Latin America RTD Bottled Cocktails Market Volume (TL) and Forecast by Packaging, 2017–2021
Table 72: Latin America RTD Bottled Cocktails Market Volume (TL) and Forecast by Packaging, 2022–2032
Table 73: Europe RTD Bottled Cocktails Market Value (US$ Mn) and Forecast by Country, 2017–2021
Table 74: Europe RTD Bottled Cocktails Market Value (US$ Mn) and Forecast by Country, 2022–2032
Table 75: Europe RTD Bottled Cocktails Market Volume (TL) and Forecast by Country, 2017–2021
Table 76: Europe RTD Bottled Cocktails Market Volume (TL) and Forecast by Country, 2022–2032
Table 77: Europe RTD Bottled Cocktails Market Value (US$ Mn) and Forecast by Product Type, 2017–2021
Table 78: Europe RTD Bottled Cocktails Market Value (US$ Mn) and Forecast by Product Type, 2022–2032
Table 79: Europe RTD Bottled Cocktails Market Volume (TL) and Forecast by Product Type, 2017–2021
Table 80: Europe RTD Bottled Cocktails Market Volume (TL) and Forecast by Product Type, 2022–2032
Table 81: Europe RTD Bottled Cocktails Market Value (US$ Mn) and Forecast by Flavour, 2017–2021
Table 82: Europe RTD Bottled Cocktails Market Value (US$ Mn) and Forecast by Flavour, 2022–2032
Table 83: Europe RTD Bottled Cocktails Market Volume (TL) and Forecast by Flavour, 2017–2021
Table 84: Europe RTD Bottled Cocktails Market Volume (TL) and Forecast by Flavour, 2022–2032
Table 85: Europe RTD Bottled Cocktails Market Value (US$ Mn) and Forecast by Price Range, 2017–2021
Table 86: Europe RTD Bottled Cocktails Market Value (US$ Mn) and Forecast by Price Range, 2022–2032
Table 87: Europe RTD Bottled Cocktails Market Volume (TL) and Forecast by Price Range, 2017–2021
Table 88: Europe RTD Bottled Cocktails Market Volume (TL) and Forecast by Price Range, 2022–2032
Table 89: Europe RTD Bottled Cocktails Market Value (US$ Mn) and Forecast by Sales Channel, 2017–2021
Table 90: Europe RTD Bottled Cocktails Market Value (US$ Mn) and Forecast by Sales Channel, 2022–2032
Table 91: Europe RTD Bottled Cocktails Market Volume (TL) and Forecast by Sales Channel, 2017–2021
Table 92: Europe RTD Bottled Cocktails Market Volume (TL) and Forecast by Sales Channel, 2022–2032
Table 93: Europe RTD Bottled Cocktails Market Value (US$ Mn) and Forecast by Packaging, 2017–2021
Table 94: Europe RTD Bottled Cocktails Market Value (US$ Mn) and Forecast by Packaging, 2022–2032
Table 95: Europe RTD Bottled Cocktails Market Volume (TL) and Forecast by Packaging, 2017–2021
Table 96: Europe RTD Bottled Cocktails Market Volume (TL) and Forecast by Packaging, 2022–2032
Table 97: East Asia RTD Bottled Cocktails Market Value (US$ Mn) and Forecast by Country, 2017–2021
Table 98: East Asia RTD Bottled Cocktails Market Value (US$ Mn) and Forecast by Country, 2022–2032
Table 99: East Asia RTD Bottled Cocktails Market Volume (TL) and Forecast by Country, 2017–2021
Table 100: East Asia RTD Bottled Cocktails Market Volume (TL) and Forecast by Country, 2022–2032
Table 101: East Asia RTD Bottled Cocktails Market Value (US$ Mn) and Forecast by Product Type, 2017–2021
Table 102: East Asia RTD Bottled Cocktails Market Value (US$ Mn) and Forecast by Product Type, 2022–2032
Table 103: East Asia RTD Bottled Cocktails Market Volume (TL) and Forecast by Product Type, 2017–2021
Table 104: East Asia RTD Bottled Cocktails Market Volume (TL) and Forecast by Product Type, 2022–2032
Table 105: East Asia RTD Bottled Cocktails Market Value (US$ Mn) and Forecast by Flavour, 2017–2021
Table 106: East Asia RTD Bottled Cocktails Market Value (US$ Mn) and Forecast by Flavour, 2022–2032
Table 107: East Asia RTD Bottled Cocktails Market Volume (TL) and Forecast by Flavour, 2017–2021
Table 108: East Asia RTD Bottled Cocktails Market Volume (TL) and Forecast by Flavour, 2022–2032
Table 109: East Asia RTD Bottled Cocktails Market Value (US$ Mn) and Forecast by Price Range, 2017–2021
Table 110: East Asia RTD Bottled Cocktails Market Value (US$ Mn) and Forecast by Price Range, 2022–2032
Table 111: East Asia RTD Bottled Cocktails Market Volume (TL) and Forecast by Price Range, 2017–2021
Table 112: East Asia RTD Bottled Cocktails Market Volume (TL) and Forecast by Price Range, 2022–2032
Table 113: East Asia RTD Bottled Cocktails Market Value (US$ Mn) and Forecast by Sales Channel, 2017–2021
Table 114: East Asia RTD Bottled Cocktails Market Value (US$ Mn) and Forecast by Sales Channel, 2022–2032
Table 115: East Asia RTD Bottled Cocktails Market Volume (TL) and Forecast by Sales Channel, 2017–2021
Table 116: East Asia RTD Bottled Cocktails Market Volume (TL) and Forecast by Sales Channel, 2022–2032
Table 117: East Asia RTD Bottled Cocktails Market Value (US$ Mn) and Forecast by Packaging, 2017–2021
Table 118: East Asia RTD Bottled Cocktails Market Value (US$ Mn) and Forecast by Packaging, 2022–2032
Table 119: East Asia RTD Bottled Cocktails Market Volume (TL) and Forecast by Packaging, 2017–2021
Table 120: East Asia RTD Bottled Cocktails Market Volume (TL) and Forecast by Packaging, 2022–2032
Table 121: South Asia RTD Bottled Cocktails Market Value (US$ Mn) and Forecast by Country, 2017–2021
Table 122: South Asia RTD Bottled Cocktails Market Value (US$ Mn) and Forecast by Country, 2022–2032
Table 123: South Asia RTD Bottled Cocktails Market Volume (TL) and Forecast by Country, 2017–2021
Table 124: South Asia RTD Bottled Cocktails Market Volume (TL) and Forecast by Country, 2022–2032
Table 125: South Asia RTD Bottled Cocktails Market Value (US$ Mn) and Forecast by Product Type, 2017–2021
Table 126: South Asia RTD Bottled Cocktails Market Value (US$ Mn) and Forecast by Product Type, 2022–2032
Table 127: South Asia RTD Bottled Cocktails Market Volume (TL) and Forecast by Product Type, 2017–2021
Table 128: South Asia RTD Bottled Cocktails Market Volume (TL) and Forecast by Product Type, 2022–2032
Table 129: South Asia RTD Bottled Cocktails Market Value (US$ Mn) and Forecast by Flavour, 2017–2021
Table 130: South Asia RTD Bottled Cocktails Market Value (US$ Mn) and Forecast by Flavour, 2022–2032
Table 131: South Asia RTD Bottled Cocktails Market Volume (TL) and Forecast by Flavour, 2017–2021
Table 132: South Asia RTD Bottled Cocktails Market Volume (TL) and Forecast by Flavour, 2022–2032
Table 133: South Asia RTD Bottled Cocktails Market Value (US$ Mn) and Forecast by Price Range, 2017–2021
Table 134: South Asia RTD Bottled Cocktails Market Value (US$ Mn) and Forecast by Price Range, 2022–2032
Table 135: South Asia RTD Bottled Cocktails Market Volume (TL) and Forecast by Price Range, 2017–2021
Table 136: South Asia RTD Bottled Cocktails Market Volume (TL) and Forecast by Price Range, 2022–2032
Table 137: South Asia RTD Bottled Cocktails Market Value (US$ Mn) and Forecast by Sales Channel, 2017–2021
Table 138: South Asia RTD Bottled Cocktails Market Value (US$ Mn) and Forecast by Sales Channel, 2022–2032
Table 139: South Asia RTD Bottled Cocktails Market Volume (TL) and Forecast by Sales Channel, 2017–2021
Table 140: South Asia RTD Bottled Cocktails Market Volume (TL) and Forecast by Sales Channel, 2022–2032
Table 141: South Asia RTD Bottled Cocktails Market Value (US$ Mn) and Forecast by Packaging, 2017–2021
Table 142: South Asia RTD Bottled Cocktails Market Value (US$ Mn) and Forecast by Packaging, 2022–2032
Table 143: South Asia RTD Bottled Cocktails Market Volume (TL) and Forecast by Packaging, 2017–2021
Table 144: South Asia RTD Bottled Cocktails Market Volume (TL) and Forecast by Packaging, 2022–2032
Table 145: Oceania RTD Bottled Cocktails Market Value (US$ Mn) and Forecast by Country, 2017–2021
Table 146: Oceania RTD Bottled Cocktails Market Value (US$ Mn) and Forecast by Country, 2022–2032
Table 147: Oceania RTD Bottled Cocktails Market Volume (TL) and Forecast by Country, 2017–2021
Table 148: Oceania RTD Bottled Cocktails Market Volume (TL) and Forecast by Country, 2022–2032
Table 149: Oceania RTD Bottled Cocktails Market Value (US$ Mn) and Forecast by Product Type, 2017–2021
Table 150: Oceania RTD Bottled Cocktails Market Value (US$ Mn) and Forecast by Product Type, 2022–2032
Table 151: Oceania RTD Bottled Cocktails Market Volume (TL) and Forecast by Product Type, 2017–2021
Table 152: Oceania RTD Bottled Cocktails Market Volume (TL) and Forecast by Product Type, 2022–2032
Table 153: Oceania RTD Bottled Cocktails Market Value (US$ Mn) and Forecast by Flavour, 2017–2021
Table 154: Oceania RTD Bottled Cocktails Market Value (US$ Mn) and Forecast by Flavour, 2022–2032
Table 155: Oceania RTD Bottled Cocktails Market Volume (TL) and Forecast by Flavour, 2017–2021
Table 156: Oceania RTD Bottled Cocktails Market Volume (TL) and Forecast by Flavour, 2022–2032
Table 157: Oceania RTD Bottled Cocktails Market Value (US$ Mn) and Forecast by Price Range, 2017–2021
Table 158: Oceania RTD Bottled Cocktails Market Value (US$ Mn) and Forecast by Price Range, 2022–2032
Table 159: Oceania RTD Bottled Cocktails Market Volume (TL) and Forecast by Price Range, 2017–2021
Table 160: Oceania RTD Bottled Cocktails Market Volume (TL) and Forecast by Price Range, 2022–2032
Table 161: Oceania RTD Bottled Cocktails Market Value (US$ Mn) and Forecast by Sales Channel, 2017–2021
Table 162: Oceania RTD Bottled Cocktails Market Value (US$ Mn) and Forecast by Sales Channel, 2022–2032
Table 163: Oceania RTD Bottled Cocktails Market Volume (TL) and Forecast by Sales Channel, 2017–2021
Table 164: Oceania RTD Bottled Cocktails Market Volume (TL) and Forecast by Sales Channel, 2022–2032
Table 165: Oceania RTD Bottled Cocktails Market Value (US$ Mn) and Forecast by Packaging, 2017–2021
Table 166: Oceania RTD Bottled Cocktails Market Value (US$ Mn) and Forecast by Packaging, 2022–2032
Table 167: Oceania RTD Bottled Cocktails Market Volume (TL) and Forecast by Packaging, 2017–2021
Table 168: Oceania RTD Bottled Cocktails Market Volume (TL) and Forecast by Packaging, 2022–2032
Table 169: MEA RTD Bottled Cocktails Market Value (US$ Mn) and Forecast by Country, 2017–2021
Table 170: MEA RTD Bottled Cocktails Market Value (US$ Mn) and Forecast by Country, 2022–2032
Table 171: MEA RTD Bottled Cocktails Market Volume (TL) and Forecast by Country, 2017–2021
Table 172: MEA RTD Bottled Cocktails Market Volume (TL) and Forecast by Country, 2022–2032
Table 173: MEA RTD Bottled Cocktails Market Value (US$ Mn) and Forecast by Product Type, 2017–2021
Table 174: MEA RTD Bottled Cocktails Market Value (US$ Mn) and Forecast by Product Type, 2022–2032
Table 175: MEA RTD Bottled Cocktails Market Volume (TL) and Forecast by Product Type, 2017–2021
Table 176: MEA RTD Bottled Cocktails Market Volume (TL) and Forecast by Product Type, 2022–2032
Table 177: MEA RTD Bottled Cocktails Market Value (US$ Mn) and Forecast by Flavour, 2017–2021
Table 178: MEA RTD Bottled Cocktails Market Value (US$ Mn) and Forecast by Flavour, 2022–2032
Table 179: MEA RTD Bottled Cocktails Market Volume (TL) and Forecast by Flavour, 2017–2021
Table 180: MEA RTD Bottled Cocktails Market Volume (TL) and Forecast by Flavour, 2022–2032
Table 181: MEA RTD Bottled Cocktails Market Value (US$ Mn) and Forecast by Price Range, 2017–2021
Table 182: MEA RTD Bottled Cocktails Market Value (US$ Mn) and Forecast by Price Range, 2022–2032
Table 183: MEA RTD Bottled Cocktails Market Volume (TL) and Forecast by Price Range, 2017–2021
Table 184: MEA RTD Bottled Cocktails Market Volume (TL) and Forecast by Price Range, 2022–2032
Table 185: MEA RTD Bottled Cocktails Market Value (US$ Mn) and Forecast by Sales Channel, 2017–2021
Table 186: MEA RTD Bottled Cocktails Market Value (US$ Mn) and Forecast by Sales Channel, 2022–2032
Table 187: MEA RTD Bottled Cocktails Market Volume (TL) and Forecast by Sales Channel, 2017–2021
Table 188: MEA RTD Bottled Cocktails Market Volume (TL) and Forecast by Sales Channel, 2022–2032
Table 189: MEA RTD Bottled Cocktails Market Value (US$ Mn) and Forecast by Packaging, 2017–2021
Table 190: MEA RTD Bottled Cocktails Market Value (US$ Mn) and Forecast by Packaging, 2022–2032
Table 191: MEA RTD Bottled Cocktails Market Volume (TL) and Forecast by Packaging, 2017–2021
Table 192: MEA RTD Bottled Cocktails Market Volume (TL) and Forecast by Packaging, 2022–2032
Find your sweet spots for generating winning opportunities in this market.
Talk to AnalystList of Charts
Figure 1: Global RTD Bottled Cocktails Market Value (US$ Mn) and Volume (TL) Forecast, 2022-2032
Figure 2: Global RTD Bottled Cocktails Market Absolute $ Opportunity (US$ Mn), 2022-2032
Figure 3: Global RTD Bottled Cocktails Market Value (US$ Mn) and % Growth by Region, 2022 & 2032
Figure 4: Global RTD Bottled Cocktails Market Y-o-Y Growth Rate by Region, 2022-2032
Figure 5: Global RTD Bottled Cocktails Market Value (US$ Mn) and % Growth by Product Type, 2022 & 2032
Figure 6: Global RTD Bottled Cocktails Market Y-o-Y Growth Rate by Product Type, 2022-2032
Figure 7: Global RTD Bottled Cocktails Market Value (US$ Mn) and % Growth by Flavour, 2022 & 2032
Figure 8: Global RTD Bottled Cocktails Market Y-o-Y Growth Rate by Flavour, 2022-2032
Figure 9: Global RTD Bottled Cocktails Market Value (US$ Mn) and % Growth by Price Range, 2022 & 2032
Figure 10: Global RTD Bottled Cocktails Market Y-o-Y Growth Rate by Price Range, 2022-2032
Figure 11: Global RTD Bottled Cocktails Market Value (US$ Mn) and % Growth by Sales Channel, 2022 & 2032
Figure 12: Global RTD Bottled Cocktails Market Y-o-Y Growth Rate by Sales Channel, 2022-2032
Figure 13: Global RTD Bottled Cocktails Market Value (US$ Mn) and % Growth by Packaging, 2022 & 2032
Figure 14: Global RTD Bottled Cocktails Market Y-o-Y Growth Rate by Packaging, 2022-2032
Figure 15: Global RTD Bottled Cocktails Market Attractiveness Analysis by Region, 2022-2032
Figure 16: Global RTD Bottled Cocktails Market Attractiveness Analysis by Product Type, 2022-2032
Figure 17: Global RTD Bottled Cocktails Market Attractiveness Analysis by Flavour, 2022-2032
Figure 18: Global RTD Bottled Cocktails Market Attractiveness Analysis by Price Range, 2022-2032
Figure 19: Global RTD Bottled Cocktails Market Attractiveness Analysis by Sales Channel, 2022-2032
Figure 20: Global RTD Bottled Cocktails Market Attractiveness Analysis by Packaging, 2022-2032
Figure 21: North America RTD Bottled Cocktails Market Value (US$ Mn) and Volume (TL) Forecast, 2022-2032
Figure 22: North America RTD Bottled Cocktails Market Absolute $ Opportunity (US$ Mn), 2022-2032
Figure 23: North America RTD Bottled Cocktails Market Value (US$ Mn) and % Growth by Country, 2022 & 2032
Figure 24: North America RTD Bottled Cocktails Market Y-o-Y Growth Rate by Country, 2022-2032
Figure 25: North America RTD Bottled Cocktails Market Value (US$ Mn) and % Growth by Product Type, 2022 & 2032
Figure 26: North America RTD Bottled Cocktails Market Y-o-Y Growth Rate by Product Type, 2022-2032
Figure 27: North America RTD Bottled Cocktails Market Value (US$ Mn) and % Growth by Flavour, 2022 & 2032
Figure 28: North America RTD Bottled Cocktails Market Y-o-Y Growth Rate by Flavour, 2022-2032
Figure 29: North America RTD Bottled Cocktails Market Value (US$ Mn) and % Growth by Price Range, 2022 & 2032
Figure 30: North America RTD Bottled Cocktails Market Y-o-Y Growth Rate by Price Range, 2022-2032
Figure 31: North America RTD Bottled Cocktails Market Value (US$ Mn) and % Growth by Sales Channel, 2022 & 2032
Figure 32: North America RTD Bottled Cocktails Market Y-o-Y Growth Rate by Sales Channel, 2022-2032
Figure 33: North America RTD Bottled Cocktails Market Value (US$ Mn) and % Growth by Packaging, 2022 & 2032
Figure 34: North America RTD Bottled Cocktails Market Y-o-Y Growth Rate by Packaging, 2022-2032
Figure 35: North America RTD Bottled Cocktails Market Attractiveness Analysis by Country, 2022-2032
Figure 36: North America RTD Bottled Cocktails Market Attractiveness Analysis by Product Type, 2022-2032
Figure 37: North America RTD Bottled Cocktails Market Attractiveness Analysis by Flavour, 2022-2032
Figure 38: North America RTD Bottled Cocktails Market Attractiveness Analysis by Price Range, 2022-2032
Figure 39: North America RTD Bottled Cocktails Market Attractiveness Analysis by Sales Channel, 2022-2032
Figure 40: North America RTD Bottled Cocktails Market Attractiveness Analysis by Packaging, 2022-2032
Figure 41: Latin America RTD Bottled Cocktails Market Value (US$ Mn) and Volume (TL) Forecast, 2022-2032
Figure 42: Latin America RTD Bottled Cocktails Market Absolute $ Opportunity (US$ Mn), 2022-2032
Figure 43: Latin America RTD Bottled Cocktails Market Value (US$ Mn) and % Growth by Country, 2022 & 2032
Figure 44: Latin America RTD Bottled Cocktails Market Y-o-Y Growth Rate by Country, 2022-2032
Figure 45: Latin America RTD Bottled Cocktails Market Value (US$ Mn) and % Growth by Product Type, 2022 & 2032
Figure 46: Latin America RTD Bottled Cocktails Market Y-o-Y Growth Rate by Product Type, 2022-2032
Figure 47: Latin America RTD Bottled Cocktails Market Value (US$ Mn) and % Growth by Flavour, 2022 & 2032
Figure 48: Latin America RTD Bottled Cocktails Market Y-o-Y Growth Rate by Flavour, 2022-2032
Figure 49: Latin America RTD Bottled Cocktails Market Value (US$ Mn) and % Growth by Price Range, 2022 & 2032
Figure 50: Latin America RTD Bottled Cocktails Market Y-o-Y Growth Rate by Price Range, 2022-2032
Figure 51: Latin America RTD Bottled Cocktails Market Value (US$ Mn) and % Growth by Sales Channel, 2022 & 2032
Figure 52: Latin America RTD Bottled Cocktails Market Y-o-Y Growth Rate by Sales Channel, 2022-2032
Figure 53: Latin America RTD Bottled Cocktails Market Value (US$ Mn) and % Growth by Packaging, 2022 & 2032
Figure 54: Latin America RTD Bottled Cocktails Market Y-o-Y Growth Rate by Packaging, 2022-2032
Figure 55: Latin America RTD Bottled Cocktails Market Attractiveness Analysis by Country, 2022-2032
Figure 56: Latin America RTD Bottled Cocktails Market Attractiveness Analysis by Product Type, 2022-2032
Figure 57: Latin America RTD Bottled Cocktails Market Attractiveness Analysis by Flavour, 2022-2032
Figure 58: Latin America RTD Bottled Cocktails Market Attractiveness Analysis by Price Range, 2022-2032
Figure 59: Latin America RTD Bottled Cocktails Market Attractiveness Analysis by Sales Channel, 2022-2032
Figure 60: Latin America RTD Bottled Cocktails Market Attractiveness Analysis by Packaging, 2022-2032
Figure 61: Europe RTD Bottled Cocktails Market Value (US$ Mn) and Volume (TL) Forecast, 2022-2032
Figure 62: Europe RTD Bottled Cocktails Market Absolute $ Opportunity (US$ Mn), 2022-2032
Figure 63: Europe RTD Bottled Cocktails Market Value (US$ Mn) and % Growth by Country, 2022 & 2032
Figure 64: Europe RTD Bottled Cocktails Market Y-o-Y Growth Rate by Country, 2022-2032
Figure 65: Europe RTD Bottled Cocktails Market Value (US$ Mn) and % Growth by Product Type, 2022 & 2032
Figure 66: Europe RTD Bottled Cocktails Market Y-o-Y Growth Rate by Product Type, 2022-2032
Figure 67: Europe RTD Bottled Cocktails Market Value (US$ Mn) and % Growth by Flavour, 2022 & 2032
Figure 68: Europe RTD Bottled Cocktails Market Y-o-Y Growth Rate by Flavour, 2022-2032
Figure 69: Europe RTD Bottled Cocktails Market Value (US$ Mn) and % Growth by Price Range, 2022 & 2032
Figure 70: Europe RTD Bottled Cocktails Market Y-o-Y Growth Rate by Price Range, 2022-2032
Figure 71: Europe RTD Bottled Cocktails Market Value (US$ Mn) and % Growth by Sales Channel, 2022 & 2032
Figure 72: Europe RTD Bottled Cocktails Market Y-o-Y Growth Rate by Sales Channel, 2022-2032
Figure 73: Europe RTD Bottled Cocktails Market Value (US$ Mn) and % Growth by Packaging, 2022 & 2032
Figure 74: Europe RTD Bottled Cocktails Market Y-o-Y Growth Rate by Packaging, 2022-2032
Figure 75: Europe RTD Bottled Cocktails Market Attractiveness Analysis by Country, 2022-2032
Figure 76: Europe RTD Bottled Cocktails Market Attractiveness Analysis by Product Type, 2022-2032
Figure 77: Europe RTD Bottled Cocktails Market Attractiveness Analysis by Flavour, 2022-2032
Figure 78: Europe RTD Bottled Cocktails Market Attractiveness Analysis by Price Range, 2022-2032
Figure 79: Europe RTD Bottled Cocktails Market Attractiveness Analysis by Sales Channel, 2022-2032
Figure 80: Europe RTD Bottled Cocktails Market Attractiveness Analysis by Packaging, 2022-2032
Figure 81: East Asia RTD Bottled Cocktails Market Value (US$ Mn) and Volume (TL) Forecast, 2022-2032
Figure 82: East Asia RTD Bottled Cocktails Market Absolute $ Opportunity (US$ Mn), 2022-2032
Figure 83: East Asia RTD Bottled Cocktails Market Value (US$ Mn) and % Growth by Country, 2022 & 2032
Figure 84: East Asia RTD Bottled Cocktails Market Y-o-Y Growth Rate by Country, 2022-2032
Figure 85: East Asia RTD Bottled Cocktails Market Value (US$ Mn) and % Growth by Product Type, 2022 & 2032
Figure 86: East Asia RTD Bottled Cocktails Market Y-o-Y Growth Rate by Product Type, 2022-2032
Figure 87: East Asia RTD Bottled Cocktails Market Value (US$ Mn) and % Growth by Flavour, 2022 & 2032
Figure 88: East Asia RTD Bottled Cocktails Market Y-o-Y Growth Rate by Flavour, 2022-2032
Figure 89: East Asia RTD Bottled Cocktails Market Value (US$ Mn) and % Growth by Price Range, 2022 & 2032
Figure 90: East Asia RTD Bottled Cocktails Market Y-o-Y Growth Rate by Price Range, 2022-2032
Figure 91: East Asia RTD Bottled Cocktails Market Value (US$ Mn) and % Growth by Sales Channel, 2022 & 2032
Figure 92: East Asia RTD Bottled Cocktails Market Y-o-Y Growth Rate by Sales Channel, 2022-2032
Figure 93: East Asia RTD Bottled Cocktails Market Value (US$ Mn) and % Growth by Packaging, 2022 & 2032
Figure 94: East Asia RTD Bottled Cocktails Market Y-o-Y Growth Rate by Packaging, 2022-2032
Figure 95: East Asia RTD Bottled Cocktails Market Attractiveness Analysis by Country, 2022-2032
Figure 96: East Asia RTD Bottled Cocktails Market Attractiveness Analysis by Product Type, 2022-2032
Figure 97: East Asia RTD Bottled Cocktails Market Attractiveness Analysis by Flavour, 2022-2032
Figure 98: East Asia RTD Bottled Cocktails Market Attractiveness Analysis by Price Range, 2022-2032
Figure 99: East Asia RTD Bottled Cocktails Market Attractiveness Analysis by Sales Channel, 2022-2032
Figure 100: East Asia RTD Bottled Cocktails Market Attractiveness Analysis by Packaging, 2022-2032
Figure 101: South Asia RTD Bottled Cocktails Market Value (US$ Mn) and Volume (TL) Forecast, 2022-2032
Figure 102: South Asia RTD Bottled Cocktails Market Absolute $ Opportunity (US$ Mn), 2022-2032
Figure 103: South Asia RTD Bottled Cocktails Market Value (US$ Mn) and % Growth by Country, 2022 & 2032
Figure 104: South Asia RTD Bottled Cocktails Market Y-o-Y Growth Rate by Country, 2022-2032
Figure 105: South Asia RTD Bottled Cocktails Market Value (US$ Mn) and % Growth by Product Type, 2022 & 2032
Figure 106: South Asia RTD Bottled Cocktails Market Y-o-Y Growth Rate by Product Type, 2022-2032
Figure 107: South Asia RTD Bottled Cocktails Market Value (US$ Mn) and % Growth by Flavour, 2022 & 2032
Figure 108: South Asia RTD Bottled Cocktails Market Y-o-Y Growth Rate by Flavour, 2022-2032
Figure 109: South Asia RTD Bottled Cocktails Market Value (US$ Mn) and % Growth by Price Range, 2022 & 2032
Figure 110: South Asia RTD Bottled Cocktails Market Y-o-Y Growth Rate by Price Range, 2022-2032
Figure 111: South Asia RTD Bottled Cocktails Market Value (US$ Mn) and % Growth by Sales Channel, 2022 & 2032
Figure 112: South Asia RTD Bottled Cocktails Market Y-o-Y Growth Rate by Sales Channel, 2022-2032
Figure 113: South Asia RTD Bottled Cocktails Market Value (US$ Mn) and % Growth by Packaging, 2022 & 2032
Figure 114: South Asia RTD Bottled Cocktails Market Y-o-Y Growth Rate by Packaging, 2022-2032
Figure 115: South Asia RTD Bottled Cocktails Market Attractiveness Analysis by Country, 2022-2032
Figure 116: South Asia RTD Bottled Cocktails Market Attractiveness Analysis by Product Type, 2022-2032
Figure 117: South Asia RTD Bottled Cocktails Market Attractiveness Analysis by Flavour, 2022-2032
Figure 118: South Asia RTD Bottled Cocktails Market Attractiveness Analysis by Price Range, 2022-2032
Figure 119: South Asia RTD Bottled Cocktails Market Attractiveness Analysis by Sales Channel, 2022-2032
Figure 120: South Asia RTD Bottled Cocktails Market Attractiveness Analysis by Packaging, 2022-2032
Figure 121: Oceania RTD Bottled Cocktails Market Value (US$ Mn) and Volume (TL) Forecast, 2022-2032
Figure 122: Oceania RTD Bottled Cocktails Market Absolute $ Opportunity (US$ Mn), 2022-2032
Figure 123: Oceania RTD Bottled Cocktails Market Value (US$ Mn) and % Growth by Country, 2022 & 2032
Figure 124: Oceania RTD Bottled Cocktails Market Y-o-Y Growth Rate by Country, 2022-2032
Figure 125: Oceania RTD Bottled Cocktails Market Value (US$ Mn) and % Growth by Product Type, 2022 & 2032
Figure 126: Oceania RTD Bottled Cocktails Market Y-o-Y Growth Rate by Product Type, 2022-2032
Figure 127: Oceania RTD Bottled Cocktails Market Value (US$ Mn) and % Growth by Flavour, 2022 & 2032
Figure 128: Oceania RTD Bottled Cocktails Market Y-o-Y Growth Rate by Flavour, 2022-2032
Figure 129: Oceania RTD Bottled Cocktails Market Value (US$ Mn) and % Growth by Price Range, 2022 & 2032
Figure 130: Oceania RTD Bottled Cocktails Market Y-o-Y Growth Rate by Price Range, 2022-2032
Figure 131: Oceania RTD Bottled Cocktails Market Value (US$ Mn) and % Growth by Sales Channel, 2022 & 2032
Figure 132: Oceania RTD Bottled Cocktails Market Y-o-Y Growth Rate by Sales Channel, 2022-2032
Figure 133: Oceania RTD Bottled Cocktails Market Value (US$ Mn) and % Growth by Packaging, 2022 & 2032
Figure 134: Oceania RTD Bottled Cocktails Market Y-o-Y Growth Rate by Packaging, 2022-2032
Figure 135: Oceania RTD Bottled Cocktails Market Attractiveness Analysis by Country, 2022-2032
Figure 136: Oceania RTD Bottled Cocktails Market Attractiveness Analysis by Product Type, 2022-2032
Figure 137: Oceania RTD Bottled Cocktails Market Attractiveness Analysis by Flavour, 2022-2032
Figure 138: Oceania RTD Bottled Cocktails Market Attractiveness Analysis by Price Range, 2022-2032
Figure 139: Oceania RTD Bottled Cocktails Market Attractiveness Analysis by Sales Channel, 2022-2032
Figure 140: Oceania RTD Bottled Cocktails Market Attractiveness Analysis by Packaging, 2022-2032
Figure 141: MEA RTD Bottled Cocktails Market Value (US$ Mn) and Volume (TL) Forecast, 2022-2032
Figure 142: MEA RTD Bottled Cocktails Market Absolute $ Opportunity (US$ Mn), 2022-2032
Figure 143: MEA RTD Bottled Cocktails Market Value (US$ Mn) and % Growth by Country, 2022 & 2032
Figure 144: MEA RTD Bottled Cocktails Market Y-o-Y Growth Rate by Country, 2022-2032
Figure 145: MEA RTD Bottled Cocktails Market Value (US$ Mn) and % Growth by Product Type, 2022 & 2032
Figure 146: MEA RTD Bottled Cocktails Market Y-o-Y Growth Rate by Product Type, 2022-2032
Figure 147: MEA RTD Bottled Cocktails Market Value (US$ Mn) and % Growth by Flavour, 2022 & 2032
Figure 148: MEA RTD Bottled Cocktails Market Y-o-Y Growth Rate by Flavour, 2022-2032
Figure 149: MEA RTD Bottled Cocktails Market Value (US$ Mn) and % Growth by Price Range, 2022 & 2032
Figure 150: MEA RTD Bottled Cocktails Market Y-o-Y Growth Rate by Price Range, 2022-2032
Figure 151: MEA RTD Bottled Cocktails Market Value (US$ Mn) and % Growth by Sales Channel, 2022 & 2032
Figure 152: MEA RTD Bottled Cocktails Market Y-o-Y Growth Rate by Sales Channel, 2022-2032
Figure 153: MEA RTD Bottled Cocktails Market Value (US$ Mn) and % Growth by Packaging, 2022 & 2032
Figure 154: MEA RTD Bottled Cocktails Market Y-o-Y Growth Rate by Packaging, 2022-2032
Figure 155: MEA RTD Bottled Cocktails Market Attractiveness Analysis by Country, 2022-2032
Figure 156: MEA RTD Bottled Cocktails Market Attractiveness Analysis by Product Type, 2022-2032
Figure 157: MEA RTD Bottled Cocktails Market Attractiveness Analysis by Flavour, 2022-2032
Figure 158: MEA RTD Bottled Cocktails Market Attractiveness Analysis by Price Range, 2022-2032
Figure 159: MEA RTD Bottled Cocktails Market Attractiveness Analysis by Sales Channel, 2022-2032
Figure 160: MEA RTD Bottled Cocktails Market Attractiveness Analysis by Packaging, 2022-2032
Need specific information?
Request CustomizationExplore Food and Beverage Insights
View Reports