Non Alcoholic RTD Beverages Market Size and Share Forecast Outlook 2025 to 2035

The Non Alcoholic RTD Beverages Market is estimated to be valued at USD 865.4 billion in 2025 and is projected to reach USD 1594.3 billion by 2035, registering a compound annual growth rate (CAGR) of 6.3% over the forecast period.
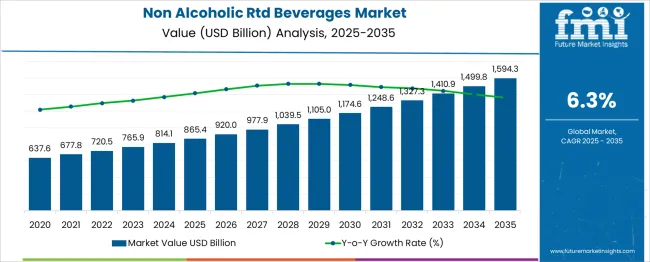
Quick Stats for Non Alcoholic RTD Beverages Market

  • Non Alcoholic RTD Beverages Market Value (2025): USD 865.4 billion
  • Non Alcoholic RTD Beverages Market Forecast Value (2035): USD 1594.3 billion
  • Non Alcoholic RTD Beverages Market Forecast CAGR: 6.3%
  • Leading Segment in Non Alcoholic RTD Beverages Market in 2025: Carbonated (38.2%)
  • Key Growth Regions in Non Alcoholic RTD Beverages Market: North America, Asia-Pacific, Europe
  • Top Key Players in Non Alcoholic RTD Beverages Market: The Coca-Cola Company, PepsiCo, Inc., Keurig Dr Pepper Inc., Nestlé S.A., Danone S.A., Monster Beverage Corporation, Red Bull GmbH, Starbucks Corporation, The Kraft Heinz Company, Unilever N.V, Campbell Soup Company, The Hershey Company, Ocean Spray Cranberries, Inc., Suntory Beverage & Food Ltd, JAB Holding Company

Non Alcoholic Rtd Beverages Market Market Value Analysis

Non Alcoholic RTD Beverages Market Key Takeaways

Metric Value
Non Alcoholic RTD Beverages Market Estimated Value in (2025 E) USD 865.4 billion
Non Alcoholic RTD Beverages Market Forecast Value in (2035 F) USD 1594.3 billion
Forecast CAGR (2025 to 2035) 6.3%

Why is the Non Alcoholic RTD Beverages Market Growing?

The non-alcoholic ready-to-drink (RTD) beverages market is experiencing strong and sustained growth, driven by increasing consumer demand for convenience, variety, and health-conscious alternatives to traditional sugary drinks. Rising urbanization, on-the-go lifestyles, and preference for instant refreshment options have elevated the appeal of RTD beverages across all age groups.

The market has evolved beyond traditional soda products, now encompassing a broad array of functional drinks, sparkling waters, and flavored infusions. Brands are actively innovating with natural ingredients, low-calorie formulations, and enhanced flavors to align with wellness trends.

Packaging also plays a critical role in driving sales, with sustainable and portable formats gaining preference. Looking ahead, the market is expected to grow steadily, supported by strategic product diversification, premiumization, and the expansion of retail and digital distribution networks catering to impulse purchases and routine consumption alike.

Segmental Analysis

The non-alcoholic RTD beverages market is segmented by type, category, packaging, distribution channel, and geographic regions. The non alcoholic RTD beverages market is divided by type into Carbonated and Non-Carbonated. In terms of categories, the non alcoholic RTD beverages market is classified into Soft Drinks, Juices, Energy Drinks, Ready-to-Drink Tea & Coffee, Functional Beverages, and Dairy-Based Beverages. Based on packaging, the non alcoholic RTD beverages market is segmented into Bottles, Cans, Tetra Packs, Pouches, and Others. The distribution channel of the non alcoholic RTD beverages market is segmented into Supermarkets & Hypermarkets, Convenience Stores, Online Retailing, Specialty Stores, and Others. Regionally, the non alcoholic RTD beverages industry is classified into North America, Latin America, Western Europe, Eastern Europe, Balkan & Baltic Countries, Russia & Belarus, Central Asia, East Asia, South Asia & Pacific, and the Middle East & Africa.
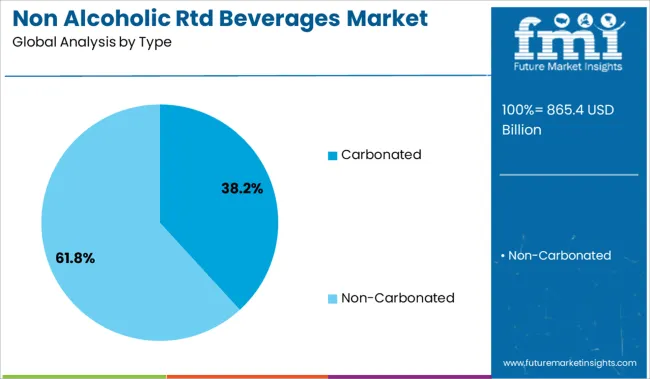
Insights into the Carbonated Type Segment

Non Alcoholic Rtd Beverages Market Analysis By Type

The carbonated segment leads the type category with a 38.2% share, driven by its enduring popularity and the sensory appeal of effervescence that enhances flavor perception. Carbonated beverages continue to attract loyal consumers due to their wide availability, refreshing taste, and strong brand equity in global markets. While traditional sodas have faced scrutiny over sugar content, innovation in low-calorie and naturally sweetened carbonated drinks has revitalized the segment.

Major brands are leveraging this trend by introducing functional carbonation, such as energy-boosting and probiotic-enriched variants. Convenience and impulse buying behavior further support carbonated RTD consumption in urban settings.

The segment remains highly competitive yet resilient, with market leaders continuously investing in new flavors, regional preferences, and limited-edition offerings. Continued adaptation to health and sustainability trends is expected to sustain the segment’s leadership position in the evolving RTD landscape.
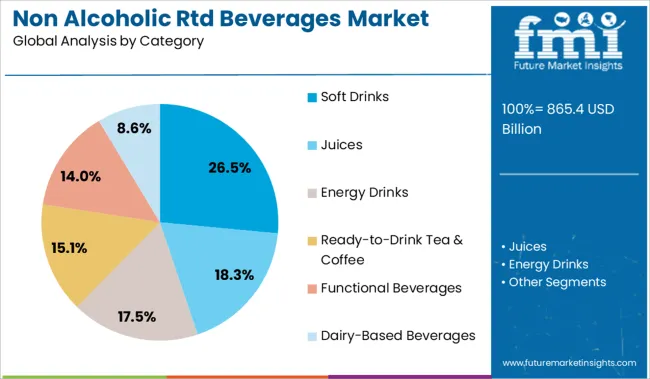
Insights into the Soft Drinks Category Segment

Non Alcoholic Rtd Beverages Market Analysis By Category

The soft drinks category accounts for 26.5% of the non-alcoholic RTD beverages market, highlighting its foundational role in shaping consumer expectations and retail offerings. Despite rising competition from functional beverages and infused waters, soft drinks remain a widely consumed category due to their affordability, brand familiarity, and diverse flavor profiles.

This segment benefits from strong promotional strategies, wide retail penetration, and continuous product reformulation efforts aimed at sugar reduction and cleaner labeling. Consumer preference for both regular and diet variants sustains demand across age demographics.

The category’s relevance is further supported by its integration into foodservice outlets, quick-service restaurants, and convenience stores. While growth rates may moderate compared to emerging sub-categories, the soft drinks segment is expected to maintain steady performance as brands focus on health-conscious innovation and personalized marketing to align with shifting consumer values.
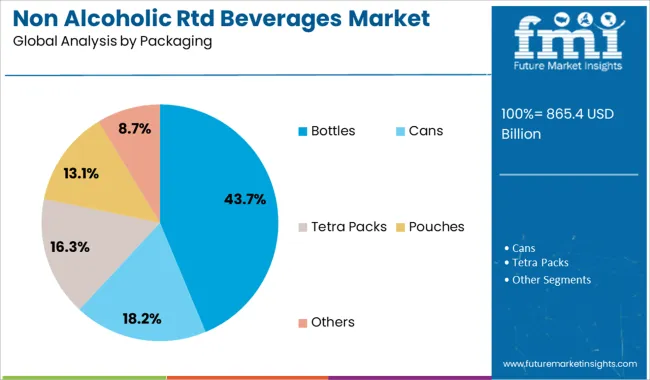
Insights into the Bottles Packaging Segment

Non Alcoholic Rtd Beverages Market Analysis By Packaging

The bottles segment dominates the packaging category with a 43.7% share, reflecting its widespread use across all RTD beverage types for its portability, resealability, and brand visibility. Bottled formats are preferred by both manufacturers and consumers due to their practicality, durability during transport, and compatibility with automated vending and retail display systems.

Advances in lightweight plastic technologies and increasing use of recycled materials have enhanced the sustainability profile of bottles, addressing growing environmental concerns. The format supports premium branding through label customization and is well-suited for a variety of volumes catering to different consumption occasions.

Bottled RTD beverages are also favored in both on-the-go and at-home scenarios, reinforcing their market strength. As eco-consciousness continues to influence packaging choices, the segment is expected to evolve with greater adoption of biodegradable and refillable bottle designs, further reinforcing its leadership position.

What are the Drivers, Restraints, and Key Trends of the Non Alcoholic RTD Beverages Market?

The non-alcoholic RTD beverages segment demands convenience, health-focused formulations, and functional ingredients, supported by strong retail and e-commerce growth. Future opportunities lie in category diversification, emerging market penetration, and digitally-driven brand engagement strategies.

Market Drivers Shaping the Non-Alcoholic RTD Beverages Industry

Demand for convenient beverage formats has been observed as a significant influence on this sector. Consumers have preferred ready-to-drink options for on-the-go lifestyles and easy accessibility. Health-driven formulations, including low-calorie and fortified options, have strengthened product acceptance across multiple demographics. Functional beverages incorporating plant-based ingredients and natural flavors have gained traction due to perceived health benefits. Brands have focused on premium packaging and diverse flavor innovation to capture evolving taste preferences. Expansion in retail penetration and e-commerce has supported widespread product reach. It is believed that strategic partnerships with foodservice channels have improved visibility for several brands, boosting overall market value.

Opportunities Driving Future Growth for Non-Alcoholic RTD Beverages

Growth opportunities have been observed through diversification in beverage categories such as herbal teas, fruit-based infusions, and dairy alternatives. Global players are expected to leverage advanced processing methods for retaining freshness and flavor while extending shelf life. Expanding distribution networks into emerging regions is anticipated to create substantial revenue streams. Consumers are increasingly drawn toward products offering functional attributes like hydration, immunity support, and energy boost, which encourages investments in ingredient innovation. Private label growth has intensified competition, pushing brands toward stronger brand-building activities. The role of digital marketing and targeted promotional campaigns is likely to remain critical in influencing purchasing decisions within this category.
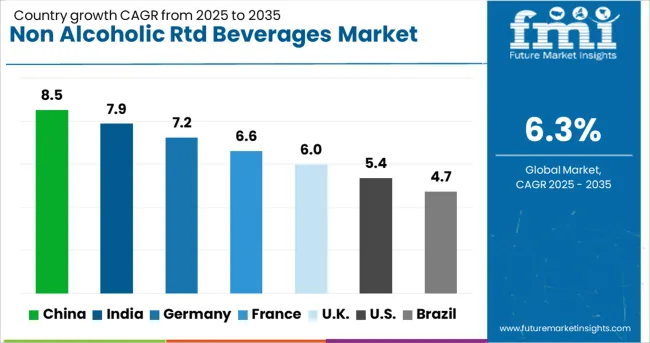
Analysis of Non Alcoholic RTD Beverages Market By Key Countries

Non Alcoholic Rtd Beverages Market Cagr Analysis By Country

Country CAGR
China 8.5%
India 7.9%
Germany 7.2%
France 6.6%
UK 6.0%
USA 5.4%
Brazil 4.7%

The non-alcoholic RTD beverages sector, projected to grow at a global CAGR of 6.3% from 2025 to 2035, shows significant variation across leading markets. A robust 8.5% CAGR is being recorded in China, a BRICS nation, driven by a rising preference for functional drinks and diverse flavor options. India, another BRICS member, is witnessing a 7.9% CAGR supported by strong demand for fortified beverages and convenience-driven consumption patterns. Germany, part of the OECD group, is showing a 7.2% CAGR due to growing interest in natural formulations and plant-based drink alternatives. Moderate expansion is being experienced in the United Kingdom with a 6.0% CAGR, while the United States, also an OECD member, follows with 5.4% CAGR as mature beverage portfolios face competition from private labels. The analysis includes insights from over 40 countries, and these five have been highlighted as primary growth contributors.
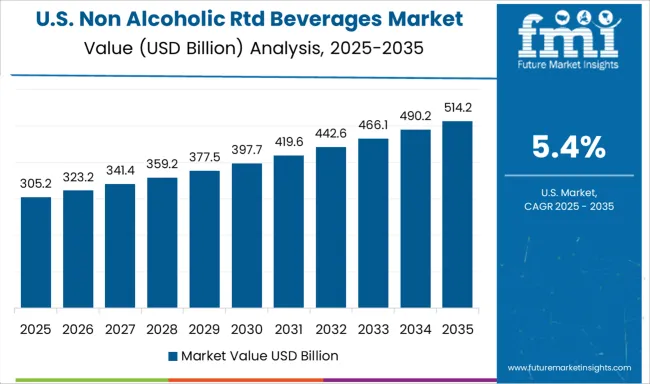
Demand Outlook for Non-Alcoholic RTD Beverages Market in the United States

Non Alcoholic Rtd Beverages Market Country Value Analysis

The United States shifted from nearly 4.7% during 2020-2024 to 5.4% CAGR for the period 2025-2035, supported by diversification in beverage offerings and the adoption of natural ingredients in formulations. Growth in functional categories such as energy-infused teas and vitamin-based drinks accelerated adoption among younger consumers. Increased penetration of private-label brands contributed to price competition, influencing consumer purchasing choices across supermarkets and convenience channels. Online retail platforms expanded assortment options, supported by subscription models and targeted discounts. Companies invested heavily in strategic partnerships with foodservice networks to boost product presence in on-the-go consumption points.

  • E-commerce accounted for over 29% of incremental sales growth by 2027.
  • Functional tea-based RTD beverages grew at a double-digit pace after 2026.
  • Private-label penetration surpassed 18% share within the USA category by 2030.

Opportunity Analysis of Non-Alcoholic RTD Beverages Market in the United Kingdom

The CAGR for the non-alcoholic RTD beverages market in the United Kingdom advanced from about 5.1% in 2020-2024 to 6.0% during 2025-2035, driven by demand for low-sugar and plant-based drink formats. RTD coffee and herbal infusions gained momentum among health-focused consumers, resulting in expanded availability through mainstream retail chains. Increased investment in branding by domestic players was observed as necessary to counter imported premium beverages. Promotional campaigns emphasizing functionality and convenience encouraged adoption across younger demographics. The emergence of canned tea-based options improved product visibility in retail coolers, enhancing impulse purchase behavior. Subscription-driven models for RTD wellness beverages gained popularity among online buyers, sustaining repeat purchases.
  • Plant-based drinks represented 24% of new launches by 2028.
  • E-commerce-driven sales doubled within five years post-2025.
  • Herbal and botanical RTD beverages experienced 2.4× growth after 2026.

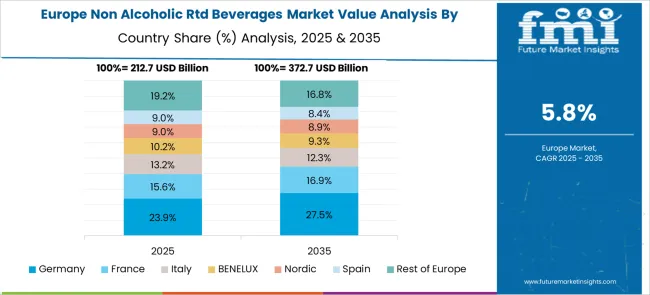
Sales Analysis of Non-Alcoholic RTD Beverages Market in Germany

Non Alcoholic Rtd Beverages Market Europe Country Market Share Analysis, 2025 & 2035

Germany improved from around 6.4% CAGR during 2020-2024 to 7.2% for the period 2025-2035, supported by growth in low-calorie and functional beverage categories. Expansion of supermarket chains carrying RTD teas, juices, and plant-based milk drinks strengthened availability across urban and semi-urban locations. Domestic manufacturers responded to competitive pressures by introducing flavor extensions targeting niche preferences such as ginger-based drinks and fruit-herbal blends. Packaging innovations such as resealable aluminum bottles contributed to repeat purchases within convenience segments. Institutional procurement in schools and workplaces for sugar-free beverages further expanded category consumption volumes. Partnerships between beverage brands and regional distributors improved rural access points for RTD products.

  • Health-oriented RTD tea variants registered over 30% share by 2030.
  • Aluminum bottle packaging grew at 8.1% CAGR between 2026 and 2031.
  • Institutional procurement of RTD juices increased across 12 German states post-2027.

Demand Analysis for Non-Alcoholic RTD Beverages Market in China

The CAGR for the non-alcoholic RTD beverages sector in China rose from approximately 7.1% in 2020-2024 to 8.5% for 2025-2035, driven by a surge in functional drinks and fortified formulations. Increased awareness of hydration benefits in dietary patterns supported the adoption of electrolyte-infused RTD beverages. Convenience store penetration and the expansion of self-service vending machines amplified product visibility. Partnerships with fitness centers for on-premise beverage placement enhanced consumption among active consumers. Domestic production hubs in provinces like Zhejiang and Guangdong invested in automated processing systems to meet rising demand. Flavor innovation focused on green tea, lychee, and low-sugar fruit blends further expanded the consumer base.

  • Vending machine-driven RTD beverage sales grew 3× from 2025 to 2029.
  • Electrolyte-infused drinks accounted for 19% market share by 2030.
  • Domestic production hubs handled 68% of national RTD output by 2028.

In-Depth Analysis of Non-Alcoholic RTD Beverages Market in India

The CAGR value increased from nearly 6.8% during 2020-2024 to 7.9% for 2025-2035, backed by higher demand for fortified and naturally flavored drinks. Expansion in tier-two cities and rural markets provided growth opportunities for low-cost RTD juice packs. Adoption of cold-chain logistics by beverage manufacturers improved shelf stability for dairy-based and probiotic drinks. Online grocery platforms enhanced visibility of niche products such as green tea-based RTD beverages, driving sales among health-conscious consumers. Regional players introduced localized flavors like mango-based drinks to cater to traditional taste preferences, strengthening brand acceptance across diverse demographics. Investments in co-packing facilities accelerated production scalability for small and mid-sized brands.
  • RTD dairy beverages represented 27% of category sales by 2030.
  • Localized fruit flavors accounted for 33% of new product launches in 2028.
  • E-commerce-driven beverage purchases rose by 4.5× between 2025 and 2029.

Competitive Landscape of Non Alcoholic RTD Beverages Market

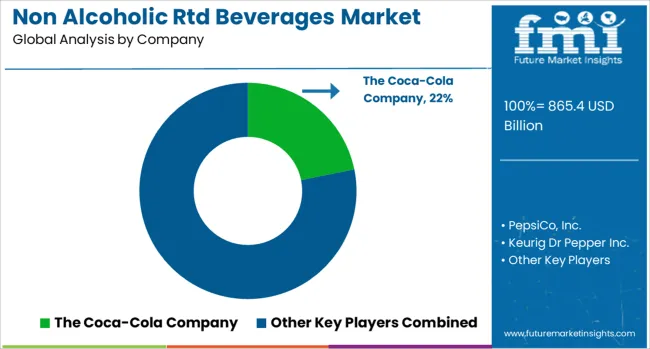
Non Alcoholic Rtd Beverages Market Analysis By Company

In the non-alcoholic RTD beverages sector, major players are capitalizing on consumer preferences for convenience, health-oriented choices, and flavor diversity. Companies such as The Coca-Cola Company, PepsiCo, Inc., and Keurig Dr Pepper Inc. dominate global distribution with extensive product portfolios that include functional beverages, flavored waters, and RTD teas. Nestlé S.A. and Danone S.A. have strengthened their positions by introducing plant-based and dairy alternatives, targeting health-conscious demographics seeking natural formulations.

Specialized brands like Monster Beverage Corporation and Red Bull GmbH lead the energy drinks category, offering fortified blends for performance-driven consumers. Starbucks Corporation has focused on premium RTD coffee formats through collaborations with established beverage bottlers. The Kraft Heinz Company, Unilever N.V., and Campbell Soup Company have extended into wellness beverages through diversification strategies. Fruit and juice-based innovations are being pursued by Ocean Spray Cranberries, Inc., while Suntory Beverage & Food Ltd and JAB Holding Company continue expanding premium tea and coffee-based RTD offerings across Asia and Europe.

Key Developments in Non Alcoholic Rtd Beverages Market

In April 2025, Red Bull GmbH launched the Summer Edition White Peach flavor.

Scope of the Report

Item Value
Quantitative Units USD 865.4 Billion
Type Carbonated and Non-Carbonated
Category Soft Drinks, Juices, Energy Drinks, Ready-to-Drink Tea & Coffee, Functional Beverages, and Dairy-Based Beverages
Packaging Bottles, Cans, Tetra Packs, Pouches, and Others
Distribution Channel Supermarkets & Hypermarkets, Convenience Stores, Online Retailing, Specialty Stores, and Others
Regions Covered North America, Europe, Asia-Pacific, Latin America, Middle East & Africa
Country Covered United States, Canada, Germany, France, United Kingdom, China, Japan, India, Brazil, South Africa
Key Companies Profiled The Coca-Cola Company, PepsiCo, Inc., Keurig Dr Pepper Inc., Nestlé S.A., Danone S.A., Monster Beverage Corporation, Red Bull GmbH, Starbucks Corporation, The Kraft Heinz Company, Unilever N.V, Campbell Soup Company, The Hershey Company, Ocean Spray Cranberries, Inc., Suntory Beverage & Food Ltd, and JAB Holding Company
Additional Attributes Dollar sales by product type (carbonated sodas, juices, bottled teas, ready-to-drink coffees) and packaging format (PET bottles, aluminum cans, cartons); demand dynamics across flavored water, functional beverages, and low‑sugar variants; regional trends led by North America with Asia‑Pacific driving product diversification; innovation in single‑serve recyclable packaging, plant‑based formulations, and vitamin‑infused beverages; and environmental impact of recycling regulations, PET bottle deposit schemes, and consumer preference for biodegradable packaging.

Non Alcoholic RTD Beverages Market by Segments

Type:

  • Carbonated
  • Non-Carbonated

Category:

  • Soft Drinks
  • Juices
  • Energy Drinks
  • Ready-to-Drink Tea & Coffee
  • Functional Beverages
  • Dairy-Based Beverages

Packaging:

  • Bottles
  • Cans
  • Tetra Packs
  • Pouches
  • Others

Distribution Channel:

  • Supermarkets & Hypermarkets
  • Convenience Stores
  • Online Retailing
  • Specialty Stores
  • Others

Region:

  • North America
    • USA
    • Canada
    • Mexico
  • Latin America
    • Brazil
    • Chile
    • Rest of Latin America
  • Western Europe
    • Germany
    • UK
    • Italy
    • Spain
    • France
    • Nordic
    • BENELUX
    • Rest of Western Europe
  • Eastern Europe
    • Russia
    • Poland
    • Hungary
    • Balkan & Baltic
    • Rest of Eastern Europe
  • East Asia
    • China
    • Japan
    • South Korea
  • South Asia and Pacific
    • India
    • ASEAN
    • Australia & New Zealand
    • Rest of South Asia and Pacific
  • Middle East & Africa
    • Kingdom of Saudi Arabia
    • Other GCC Countries
    • Turkiye
    • South Africa
    • Other African Union
    • Rest of Middle East & Africa

Table of Content

  1. Executive Summary
    • Global Market Outlook
    • Demand-side Trends
    • Supply-side Trends
    • Technology Roadmap Analysis
    • Analysis and Recommendations
  2. Market Overview
    • Market Coverage / Taxonomy
    • Market Definition / Scope / Limitations
  3. Market Background
    • Market Dynamics
      • Drivers
      • Restraints
      • Opportunity
      • Trends
    • Scenario Forecast
      • Demand in Optimistic Scenario
      • Demand in Likely Scenario
      • Demand in Conservative Scenario
    • Opportunity Map Analysis
    • Product Life Cycle Analysis
    • Supply Chain Analysis
    • Investment Feasibility Matrix
    • Value Chain Analysis
    • PESTLE and Porter’s Analysis
    • Regulatory Landscape
    • Regional Parent Market Outlook
    • Production and Consumption Statistics
    • Import and Export Statistics
  4. Global Non Alcoholic Rtd Beverages Market Analysis 2020-2024 and Forecast, 2025-2035
    • Historical Market Size Value (USD Mn) Analysis, 2020-2024
    • Current and Future Market Size Value (USD Mn) Projections, 2025-2035
      • Y-o-Y Growth Trend Analysis
      • Absolute $ Opportunity Analysis
  5. Global Non Alcoholic Rtd Beverages Market Pricing Analysis 2020-2024 and Forecast 2025-2035
  6. Global Non Alcoholic Rtd Beverages Market Analysis 2020-2024 and Forecast 2025-2035, By Type
    • Introduction / Key Findings
    • Historical Market Size Value (USD Mn) Analysis By Type , 2020-2024
    • Current and Future Market Size Value (USD Mn) Analysis and Forecast By Type , 2025-2035
      • Carbonated
      • Non-Carbonated
    • Y-o-Y Growth Trend Analysis By Type , 2020-2024
    • Absolute $ Opportunity Analysis By Type , 2025-2035
  7. Global Non Alcoholic Rtd Beverages Market Analysis 2020-2024 and Forecast 2025-2035, By Category
    • Introduction / Key Findings
    • Historical Market Size Value (USD Mn) Analysis By Category, 2020-2024
    • Current and Future Market Size Value (USD Mn) Analysis and Forecast By Category, 2025-2035
      • Soft Drinks
      • Juices
      • Energy Drinks
      • Ready-to-Drink Tea & Coffee
      • Functional Beverages
      • Dairy-Based Beverages
    • Y-o-Y Growth Trend Analysis By Category, 2020-2024
    • Absolute $ Opportunity Analysis By Category, 2025-2035
  8. Global Non Alcoholic Rtd Beverages Market Analysis 2020-2024 and Forecast 2025-2035, By Packaging
    • Introduction / Key Findings
    • Historical Market Size Value (USD Mn) Analysis By Packaging, 2020-2024
    • Current and Future Market Size Value (USD Mn) Analysis and Forecast By Packaging, 2025-2035
      • Bottles
      • Cans
      • Tetra Packs
      • Pouches
      • Others
    • Y-o-Y Growth Trend Analysis By Packaging, 2020-2024
    • Absolute $ Opportunity Analysis By Packaging, 2025-2035
  9. Global Non Alcoholic Rtd Beverages Market Analysis 2020-2024 and Forecast 2025-2035, By Distribution Channel
    • Introduction / Key Findings
    • Historical Market Size Value (USD Mn) Analysis By Distribution Channel, 2020-2024
    • Current and Future Market Size Value (USD Mn) Analysis and Forecast By Distribution Channel, 2025-2035
      • Supermarkets & Hypermarkets
      • Convenience Stores
      • Online Retailing
      • Specialty Stores
      • Others
    • Y-o-Y Growth Trend Analysis By Distribution Channel, 2020-2024
    • Absolute $ Opportunity Analysis By Distribution Channel, 2025-2035
  10. Global Non Alcoholic Rtd Beverages Market Analysis 2020-2024 and Forecast 2025-2035, By Region
    • Introduction
    • Historical Market Size Value (USD Mn) Analysis By Region, 2020-2024
    • Current Market Size Value (USD Mn) Analysis and Forecast By Region, 2025-2035
      • North America
      • Latin America
      • Western Europe
      • Eastern Europe
      • East Asia
      • South Asia and Pacific
      • Middle East & Africa
    • Market Attractiveness Analysis By Region
  11. North America Non Alcoholic Rtd Beverages Market Analysis 2020-2024 and Forecast 2025-2035, By Country
    • Historical Market Size Value (USD Mn) Trend Analysis By Market Taxonomy, 2020-2024
    • Market Size Value (USD Mn) Forecast By Market Taxonomy, 2025-2035
      • By Country
        • USA
        • Canada
        • Mexico
      • By Type
      • By Category
      • By Packaging
      • By Distribution Channel
    • Market Attractiveness Analysis
      • By Country
      • By Type
      • By Category
      • By Packaging
      • By Distribution Channel
    • Key Takeaways
  12. Latin America Non Alcoholic Rtd Beverages Market Analysis 2020-2024 and Forecast 2025-2035, By Country
    • Historical Market Size Value (USD Mn) Trend Analysis By Market Taxonomy, 2020-2024
    • Market Size Value (USD Mn) Forecast By Market Taxonomy, 2025-2035
      • By Country
        • Brazil
        • Chile
        • Rest of Latin America
      • By Type
      • By Category
      • By Packaging
      • By Distribution Channel
    • Market Attractiveness Analysis
      • By Country
      • By Type
      • By Category
      • By Packaging
      • By Distribution Channel
    • Key Takeaways
  13. Western Europe Non Alcoholic Rtd Beverages Market Analysis 2020-2024 and Forecast 2025-2035, By Country
    • Historical Market Size Value (USD Mn) Trend Analysis By Market Taxonomy, 2020-2024
    • Market Size Value (USD Mn) Forecast By Market Taxonomy, 2025-2035
      • By Country
        • Germany
        • UK
        • Italy
        • Spain
        • France
        • Nordic
        • BENELUX
        • Rest of Western Europe
      • By Type
      • By Category
      • By Packaging
      • By Distribution Channel
    • Market Attractiveness Analysis
      • By Country
      • By Type
      • By Category
      • By Packaging
      • By Distribution Channel
    • Key Takeaways
  14. Eastern Europe Non Alcoholic Rtd Beverages Market Analysis 2020-2024 and Forecast 2025-2035, By Country
    • Historical Market Size Value (USD Mn) Trend Analysis By Market Taxonomy, 2020-2024
    • Market Size Value (USD Mn) Forecast By Market Taxonomy, 2025-2035
      • By Country
        • Russia
        • Poland
        • Hungary
        • Balkan & Baltic
        • Rest of Eastern Europe
      • By Type
      • By Category
      • By Packaging
      • By Distribution Channel
    • Market Attractiveness Analysis
      • By Country
      • By Type
      • By Category
      • By Packaging
      • By Distribution Channel
    • Key Takeaways
  15. East Asia Non Alcoholic Rtd Beverages Market Analysis 2020-2024 and Forecast 2025-2035, By Country
    • Historical Market Size Value (USD Mn) Trend Analysis By Market Taxonomy, 2020-2024
    • Market Size Value (USD Mn) Forecast By Market Taxonomy, 2025-2035
      • By Country
        • China
        • Japan
        • South Korea
      • By Type
      • By Category
      • By Packaging
      • By Distribution Channel
    • Market Attractiveness Analysis
      • By Country
      • By Type
      • By Category
      • By Packaging
      • By Distribution Channel
    • Key Takeaways
  16. South Asia and Pacific Non Alcoholic Rtd Beverages Market Analysis 2020-2024 and Forecast 2025-2035, By Country
    • Historical Market Size Value (USD Mn) Trend Analysis By Market Taxonomy, 2020-2024
    • Market Size Value (USD Mn) Forecast By Market Taxonomy, 2025-2035
      • By Country
        • India
        • ASEAN
        • Australia & New Zealand
        • Rest of South Asia and Pacific
      • By Type
      • By Category
      • By Packaging
      • By Distribution Channel
    • Market Attractiveness Analysis
      • By Country
      • By Type
      • By Category
      • By Packaging
      • By Distribution Channel
    • Key Takeaways
  17. Middle East & Africa Non Alcoholic Rtd Beverages Market Analysis 2020-2024 and Forecast 2025-2035, By Country
    • Historical Market Size Value (USD Mn) Trend Analysis By Market Taxonomy, 2020-2024
    • Market Size Value (USD Mn) Forecast By Market Taxonomy, 2025-2035
      • By Country
        • Kingdom of Saudi Arabia
        • Other GCC Countries
        • Turkiye
        • South Africa
        • Other African Union
        • Rest of Middle East & Africa
      • By Type
      • By Category
      • By Packaging
      • By Distribution Channel
    • Market Attractiveness Analysis
      • By Country
      • By Type
      • By Category
      • By Packaging
      • By Distribution Channel
    • Key Takeaways
  18. Key Countries Non Alcoholic Rtd Beverages Market Analysis
    • USA
      • Pricing Analysis
      • Market Share Analysis, 2024
        • By Type
        • By Category
        • By Packaging
        • By Distribution Channel
    • Canada
      • Pricing Analysis
      • Market Share Analysis, 2024
        • By Type
        • By Category
        • By Packaging
        • By Distribution Channel
    • Mexico
      • Pricing Analysis
      • Market Share Analysis, 2024
        • By Type
        • By Category
        • By Packaging
        • By Distribution Channel
    • Brazil
      • Pricing Analysis
      • Market Share Analysis, 2024
        • By Type
        • By Category
        • By Packaging
        • By Distribution Channel
    • Chile
      • Pricing Analysis
      • Market Share Analysis, 2024
        • By Type
        • By Category
        • By Packaging
        • By Distribution Channel
    • Germany
      • Pricing Analysis
      • Market Share Analysis, 2024
        • By Type
        • By Category
        • By Packaging
        • By Distribution Channel
    • UK
      • Pricing Analysis
      • Market Share Analysis, 2024
        • By Type
        • By Category
        • By Packaging
        • By Distribution Channel
    • Italy
      • Pricing Analysis
      • Market Share Analysis, 2024
        • By Type
        • By Category
        • By Packaging
        • By Distribution Channel
    • Spain
      • Pricing Analysis
      • Market Share Analysis, 2024
        • By Type
        • By Category
        • By Packaging
        • By Distribution Channel
    • France
      • Pricing Analysis
      • Market Share Analysis, 2024
        • By Type
        • By Category
        • By Packaging
        • By Distribution Channel
    • India
      • Pricing Analysis
      • Market Share Analysis, 2024
        • By Type
        • By Category
        • By Packaging
        • By Distribution Channel
    • ASEAN
      • Pricing Analysis
      • Market Share Analysis, 2024
        • By Type
        • By Category
        • By Packaging
        • By Distribution Channel
    • Australia & New Zealand
      • Pricing Analysis
      • Market Share Analysis, 2024
        • By Type
        • By Category
        • By Packaging
        • By Distribution Channel
    • China
      • Pricing Analysis
      • Market Share Analysis, 2024
        • By Type
        • By Category
        • By Packaging
        • By Distribution Channel
    • Japan
      • Pricing Analysis
      • Market Share Analysis, 2024
        • By Type
        • By Category
        • By Packaging
        • By Distribution Channel
    • South Korea
      • Pricing Analysis
      • Market Share Analysis, 2024
        • By Type
        • By Category
        • By Packaging
        • By Distribution Channel
    • Russia
      • Pricing Analysis
      • Market Share Analysis, 2024
        • By Type
        • By Category
        • By Packaging
        • By Distribution Channel
    • Poland
      • Pricing Analysis
      • Market Share Analysis, 2024
        • By Type
        • By Category
        • By Packaging
        • By Distribution Channel
    • Hungary
      • Pricing Analysis
      • Market Share Analysis, 2024
        • By Type
        • By Category
        • By Packaging
        • By Distribution Channel
    • Kingdom of Saudi Arabia
      • Pricing Analysis
      • Market Share Analysis, 2024
        • By Type
        • By Category
        • By Packaging
        • By Distribution Channel
    • Turkiye
      • Pricing Analysis
      • Market Share Analysis, 2024
        • By Type
        • By Category
        • By Packaging
        • By Distribution Channel
    • South Africa
      • Pricing Analysis
      • Market Share Analysis, 2024
        • By Type
        • By Category
        • By Packaging
        • By Distribution Channel
  19. Market Structure Analysis
    • Competition Dashboard
    • Competition Benchmarking
    • Market Share Analysis of Top Players
      • By Regional
      • By Type
      • By Category
      • By Packaging
      • By Distribution Channel
  20. Competition Analysis
    • Competition Deep Dive
      • Company1
        • Overview
        • Product Portfolio
        • Profitability by Market Segments (Product/Age /Sales Channel/Region)
        • Sales Footprint
        • Strategy Overview
          • Marketing Strategy
          • Product Strategy
          • Channel Strategy
      • Company2
      • Company3
      • Company4
      • Company5
      • Company6
      • Company7
      • Company8
      • Company9
      • Company10
      • Company11
      • Company12
      • Company13
      • Company14
      • Company15
      • Company16
      • Company17
      • Company18
      • Company19
      • Company20
  21. Assumptions & Acronyms Used
  22. Research Methodology

List of Tables

  • Table 1: Global Non Alcoholic Rtd Beverages Market Value (USD Mn) Forecast by Region, 2020-2035
  • Table 2: Global Non Alcoholic Rtd Beverages Market Value (USD Mn) Forecast by Type , 2020-2035
  • Table 3: Global Non Alcoholic Rtd Beverages Market Value (USD Mn) Forecast by Category, 2020-2035
  • Table 4: Global Non Alcoholic Rtd Beverages Market Value (USD Mn) Forecast by Packaging, 2020-2035
  • Table 5: Global Non Alcoholic Rtd Beverages Market Value (USD Mn) Forecast by Distribution Channel, 2020-2035
  • Table 6: North America Non Alcoholic Rtd Beverages Market Value (USD Mn) Forecast by Country, 2020-2035
  • Table 7: North America Non Alcoholic Rtd Beverages Market Value (USD Mn) Forecast by Type , 2020-2035
  • Table 8: North America Non Alcoholic Rtd Beverages Market Value (USD Mn) Forecast by Category, 2020-2035
  • Table 9: North America Non Alcoholic Rtd Beverages Market Value (USD Mn) Forecast by Packaging, 2020-2035
  • Table 10: North America Non Alcoholic Rtd Beverages Market Value (USD Mn) Forecast by Distribution Channel, 2020-2035
  • Table 11: Latin America Non Alcoholic Rtd Beverages Market Value (USD Mn) Forecast by Country, 2020-2035
  • Table 12: Latin America Non Alcoholic Rtd Beverages Market Value (USD Mn) Forecast by Type , 2020-2035
  • Table 13: Latin America Non Alcoholic Rtd Beverages Market Value (USD Mn) Forecast by Category, 2020-2035
  • Table 14: Latin America Non Alcoholic Rtd Beverages Market Value (USD Mn) Forecast by Packaging, 2020-2035
  • Table 15: Latin America Non Alcoholic Rtd Beverages Market Value (USD Mn) Forecast by Distribution Channel, 2020-2035
  • Table 16: Western Europe Non Alcoholic Rtd Beverages Market Value (USD Mn) Forecast by Country, 2020-2035
  • Table 17: Western Europe Non Alcoholic Rtd Beverages Market Value (USD Mn) Forecast by Type , 2020-2035
  • Table 18: Western Europe Non Alcoholic Rtd Beverages Market Value (USD Mn) Forecast by Category, 2020-2035
  • Table 19: Western Europe Non Alcoholic Rtd Beverages Market Value (USD Mn) Forecast by Packaging, 2020-2035
  • Table 20: Western Europe Non Alcoholic Rtd Beverages Market Value (USD Mn) Forecast by Distribution Channel, 2020-2035
  • Table 21: Eastern Europe Non Alcoholic Rtd Beverages Market Value (USD Mn) Forecast by Country, 2020-2035
  • Table 22: Eastern Europe Non Alcoholic Rtd Beverages Market Value (USD Mn) Forecast by Type , 2020-2035
  • Table 23: Eastern Europe Non Alcoholic Rtd Beverages Market Value (USD Mn) Forecast by Category, 2020-2035
  • Table 24: Eastern Europe Non Alcoholic Rtd Beverages Market Value (USD Mn) Forecast by Packaging, 2020-2035
  • Table 25: Eastern Europe Non Alcoholic Rtd Beverages Market Value (USD Mn) Forecast by Distribution Channel, 2020-2035
  • Table 26: East Asia Non Alcoholic Rtd Beverages Market Value (USD Mn) Forecast by Country, 2020-2035
  • Table 27: East Asia Non Alcoholic Rtd Beverages Market Value (USD Mn) Forecast by Type , 2020-2035
  • Table 28: East Asia Non Alcoholic Rtd Beverages Market Value (USD Mn) Forecast by Category, 2020-2035
  • Table 29: East Asia Non Alcoholic Rtd Beverages Market Value (USD Mn) Forecast by Packaging, 2020-2035
  • Table 30: East Asia Non Alcoholic Rtd Beverages Market Value (USD Mn) Forecast by Distribution Channel, 2020-2035
  • Table 31: South Asia and Pacific Non Alcoholic Rtd Beverages Market Value (USD Mn) Forecast by Country, 2020-2035
  • Table 32: South Asia and Pacific Non Alcoholic Rtd Beverages Market Value (USD Mn) Forecast by Type , 2020-2035
  • Table 33: South Asia and Pacific Non Alcoholic Rtd Beverages Market Value (USD Mn) Forecast by Category, 2020-2035
  • Table 34: South Asia and Pacific Non Alcoholic Rtd Beverages Market Value (USD Mn) Forecast by Packaging, 2020-2035
  • Table 35: South Asia and Pacific Non Alcoholic Rtd Beverages Market Value (USD Mn) Forecast by Distribution Channel, 2020-2035
  • Table 36: Middle East & Africa Non Alcoholic Rtd Beverages Market Value (USD Mn) Forecast by Country, 2020-2035
  • Table 37: Middle East & Africa Non Alcoholic Rtd Beverages Market Value (USD Mn) Forecast by Type , 2020-2035
  • Table 38: Middle East & Africa Non Alcoholic Rtd Beverages Market Value (USD Mn) Forecast by Category, 2020-2035
  • Table 39: Middle East & Africa Non Alcoholic Rtd Beverages Market Value (USD Mn) Forecast by Packaging, 2020-2035
  • Table 40: Middle East & Africa Non Alcoholic Rtd Beverages Market Value (USD Mn) Forecast by Distribution Channel, 2020-2035

List of Figures

  • Figure 1: Global Non Alcoholic Rtd Beverages Market Pricing Analysis
  • Figure 2: Global Non Alcoholic Rtd Beverages Market Value (USD Mn) Forecast 2020-2035
  • Figure 3: Global Non Alcoholic Rtd Beverages Market Value (USD Mn) Share and BPS Analysis by Region, 2025 and 2035
  • Figure 4: Global Non Alcoholic Rtd Beverages Market Y-o-Y Growth Comparison by Region, 2025-2035
  • Figure 5: Global Non Alcoholic Rtd Beverages Market Attractiveness Analysis by Region
  • Figure 6: North America Non Alcoholic Rtd Beverages Market Incremental Dollar Opportunity, 2025-2035
  • Figure 7: Latin America Non Alcoholic Rtd Beverages Market Incremental Dollar Opportunity, 2025-2035
  • Figure 8: Western Europe Non Alcoholic Rtd Beverages Market Incremental Dollar Opportunity, 2025-2035
  • Figure 9: Eastern Europe Non Alcoholic Rtd Beverages Market Incremental Dollar Opportunity, 2025-2035
  • Figure 10: East Asia Non Alcoholic Rtd Beverages Market Incremental Dollar Opportunity, 2025-2035
  • Figure 11: South Asia and Pacific Non Alcoholic Rtd Beverages Market Incremental Dollar Opportunity, 2025-2035
  • Figure 12: Middle East & Africa Non Alcoholic Rtd Beverages Market Incremental Dollar Opportunity, 2025-2035
  • Figure 13: North America Non Alcoholic Rtd Beverages Market Value Share and BPS Analysis by Country, 2025 and 2035
  • Figure 14: Latin America Non Alcoholic Rtd Beverages Market Value Share and BPS Analysis by Country, 2025 and 2035
  • Figure 15: Western Europe Non Alcoholic Rtd Beverages Market Value Share and BPS Analysis by Country, 2025 and 2035
  • Figure 16: Eastern Europe Non Alcoholic Rtd Beverages Market Value Share and BPS Analysis by Country, 2025 and 2035
  • Figure 17: East Asia Non Alcoholic Rtd Beverages Market Value Share and BPS Analysis by Country, 2025 and 2035
  • Figure 18: South Asia and Pacific Non Alcoholic Rtd Beverages Market Value Share and BPS Analysis by Country, 2025 and 2035
  • Figure 19: Middle East & Africa Non Alcoholic Rtd Beverages Market Value Share and BPS Analysis by Country, 2025 and 2035
  • Figure 20: Global Non Alcoholic Rtd Beverages Market - Tier Structure Analysis
  • Figure 21: Global Non Alcoholic Rtd Beverages Market - Company Share Analysis

Frequently Asked Questions

How big is the non alcoholic rtd beverages market in 2025?

The global non alcoholic rtd beverages market is estimated to be valued at USD 865.4 billion in 2025.

What will be the size of non alcoholic rtd beverages market in 2035?

The market size for the non alcoholic rtd beverages market is projected to reach USD 1,594.3 billion by 2035.

How much will be the non alcoholic rtd beverages market growth between 2025 and 2035?

The non alcoholic rtd beverages market is expected to grow at a 6.3% CAGR between 2025 and 2035.

What are the key product types in the non alcoholic rtd beverages market?

The key product types in non alcoholic rtd beverages market are carbonated and non-carbonated.

Which category segment to contribute significant share in the non alcoholic rtd beverages market in 2025?

In terms of category, soft drinks segment to command 26.5% share in the non alcoholic rtd beverages market in 2025.

Explore Similar Insights

Future Market Insights

Non Alcoholic RTD Beverages Market