Non-Fat Dry Milk Market Forecast and Outlook 2025 to 2035

The global non-fat dry milk market is estimated to be valued at USD 8.9 billion in 2025 and is projected to reach USD 12.1 billion by 2035, registering a compound annual growth rate (CAGR) of 3.1% over the forecast period.
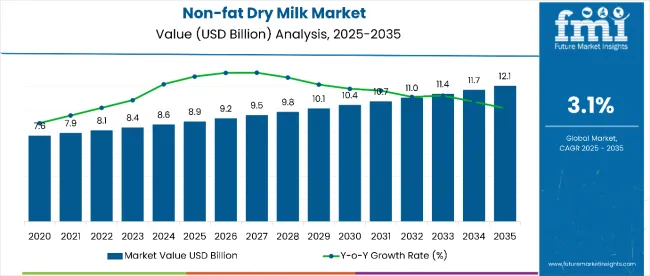
Quick Stats for Non-Fat Dry Milk Market

  • Non-Fat Dry Milk Market Value (2025): USD 8.9 billion
  • Non-Fat Dry Milk Market Forecast Value (2035): USD 12.1 billion
  • Non-Fat Dry Milk Market Forecast CAGR: 3.1%
  • LeadingSegment in Non-Fat Dry Milk Market in 2025: High-heat (50.0%)
  • Key Growth Regions in Non-Fat Dry Milk Market: Asia-Pacific, North America, Europe
  • Top Key Players in Non-Fat Dry Milk Market: Nestlé S.A., Arla Foods, Amul, HOCHDORF Holding Ltd., DairyAmerica Inc., Bob’s Red Mill Natural Foods.

Non Fat Dry Milk Market

Metric Value
Market Estimated Value in (2025E) USD 8.9 billion
Market Forecast Value in (2035F) USD 12.1 billion
Forecast CAGR (2025 to 2035) 3.1%

The market is expected to add an absolute dollar opportunity of USD 3.2 billion during this time, reflecting steady growth driven by rising demand for fortified dairy ingredients, extended shelf-life convenience, and expanding applications in bakery, confectionery, and nutritional supplements. The high-heat segment is anticipated to lead with a 50% share, supported by strong demand in baked goods and processed food production.

By 2030, the market is likely to reach approximately USD 10.4 billion, representing USD 1.5 billion in incremental value over the first half of the decade and USD 1.7 billion in the latter half, indicating a moderately balanced growth trajectory. Non-fat dry milk’s appeal is underpinned by its long shelf life, nutrient density, and ease of transportation, offering a cost-effective source of protein, calcium, potassium, and vitamins. Growing health awareness and popularity of nutritional supplements are boosting adoption, while expansion of e-commerce and modern trade channels enhances accessibility. The high-heat segment, favored for industrial food processing, will maintain demand momentum throughout the forecast period due to its versatility.

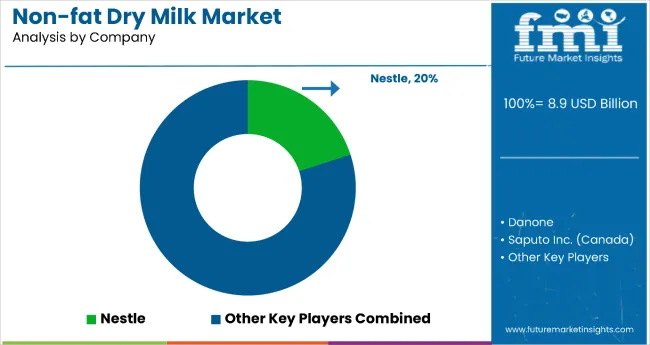
Key players such as Nestlé S.A., holding the largest market share at 20%, are strengthening their positions through innovation in fortified products and research into animal-free dairy proteins. Arla Foods leverages its farmer-owned model to emphasize value and sustainability, while Amul dominates the Indian market via its extensive cooperative network. HOCHDORF Holding and Dairy America reinforce their presence with specialized dairy ingredients and strong export capabilities. Competitive strategies across the market include capacity expansions, e-commerce channel development, and strategic partnerships with functional food manufacturers, ensuring continued market evolution driven by innovation and consumer demand.

The market holds approximately 46% of the global powdered milk market, driven by its extended shelf life, cost efficiency, and wide application across bakery, confectionery, and nutritional supplements. It accounts for around 40% of the fortified dairy ingredients segment, supported by its role in protein-rich formulations and calcium-enriched products. The market contributes nearly 35% to the high-heat dairy ingredient category, particularly for baked goods, processed foods, and high-mix formulations. It holds close to 32% of the global dairy nutritional supplement market, where non-fat dry milk is valued for its protein, potassium, and vitamin content. Its share in the e-commerce dairy products segment reaches about 28%, reflecting growing demand through online channels for shelf-stable, nutrient-rich options.

The market is undergoing structural change driven by rising demand for fortified, functional dairy products and increased adoption in emerging economies. Advancements in spray-drying and heat-treatment technologies have improved product solubility, nutritional retention, and shelf stability. Manufacturers are introducing organic-certified, high-heat, and value-added formulations tailored for sports nutrition, infant formula, and functional food applications, expanding non-fat dry milk’s role beyond traditional home reconstitution and institutional catering.

Why is the Non-Fat Dry Milk Market Growing?

Non-fat dry milk’s long shelf life, cost-effectiveness, and rich nutrient profile high in protein, calcium, potassium, and vitamins make it highly attractive to health-conscious consumers and food manufacturers seeking versatile dairy ingredients. Its ability to be fortified with additional nutrients and flavors supports demand in bakery, confectionery, nutritional supplements, and functional beverages.

Rising health awareness, growing urbanization, and increasing preference for shelf-stable, easy-to-transport dairy products are further propelling adoption. With expanding applications in sports nutrition, infant formula, and fortified food products, and with advances in spray-drying technology improving quality and solubility, non-fat dry milk is well-positioned to capture sustained global demand.

Non-Fat Dry Milk Market Analysis by Top Investment Segments

The market is segmented by product type, sales channel, application, and region. By product type, the market is classified into high-heat, medium-heat, and low-heat. Based on sales channel, the market is divided into modern trade, traditional grocery store, convenience stores, online channels, direct sales. In terms of application, the market is segmented into home reconstitutions, dairy whiteners, bakery and confectionery, desserts, ice-cream, dairy blends, snacks, nutritional supplements. Regionally, the market is categorized into North America, Latin America, Western Europe, Eastern Europe, South Asia and Pacific, East Asia, and the Middle East & Africa.
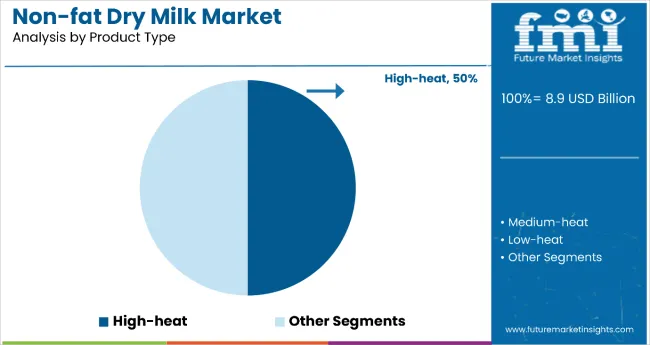
By Product Type, High-Heat Accounts for 50.0% of the Market Share

Non Fat Dry Milk Market By Product

High-heat non-fat dry milk is the most lucrative segment, commanding 50% market share in 2025 due to its tailored functionality for industrial baking and processed foods. High-heat powders deliver improved heat stability, promote browning and loaf volume in breads, and contribute desirable structure and mouthfeel in doughs and dry mixes attributes that make them the ingredient of choice for large-scale bakers, pancake/waffle mixes, and savory formulations.

From a depth perspective, high-heat’s lower solubility is actually a benefit in cooked systems (it resists rehydration during processing), enabling formulators to replace liquid milk without compromising texture. This drives steady institutional and industrial demand, bulk purchase patterns, and long-term supply contracts that support higher margins and stable volume growth versus medium/low-heat types.
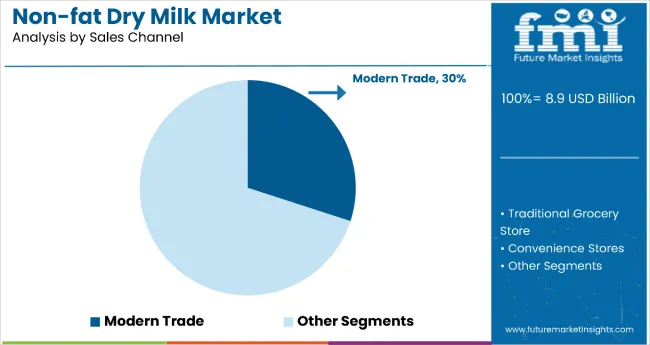
By Sales Channel, Modern Trade Accounts for 30.0% of the Market Share

Non Fat Dry Milk Market By Sales

Modern trade is the leading sales channel for non-fat dry milk, holding 30% market share in 2025, supported by the rapid expansion of supermarkets, hypermarkets, and organized dairy retail chains. These outlets offer consistent product availability, a wide range of SKUs, and competitive pricing through bulk purchasing and promotional campaigns. They also provide an ideal platform for high-heat and fortified variants, enabling manufacturers to educate consumers through in-store displays and sampling programs.

Modern trade’s structured supply chain ensures better inventory management, minimized wastage, and fresher stock rotation, which is critical for maintaining the quality of dry dairy powders. The segment benefits from rising urbanization and changing consumer habits, with more shoppers preferring one-stop retail solutions. Strategic collaborations between dairy producers and large retail groups are facilitating bundled offers with complementary products like bakery mixes and nutritional beverages.

What are the Drivers, Restraints, and Key Trends of the Non-fat Dry Milk Market?

From 2025 to 2035, growing demand for shelf-stable, protein-rich dairy ingredients is driving non-fat dry milk (NFDM) adoption across bakery, confectionery, nutritional supplements, and dairy blend applications. Health-conscious consumers seeking high-protein, low-fat dairy options, coupled with rising demand in emerging economies, are reinforcing the market’s steady expansion. Manufacturers offering high-heat variants for industrial applications and fortified formulations for nutritional use are expected to benefit most.

Nutritional Versatility and Shelf-life Stability Drive Non-fat Dry Milk Market Growth

The high protein content, low fat levels, and extended shelf life of NFDM have made it an essential ingredient for both foodservice and industrial processing. In 2024, demand surged in bakery, confectionery, and sports nutrition segments, where NFDM’s functional properties such as improved texture, browning, and stability add value to formulations. By 2025, nutritional supplement manufacturers were increasingly incorporating NFDM into powders and bars to meet the clean-label, high-protein trend.

Value-added Formulations and Processing Innovation Create Opportunities

Advancements in spray-drying technology, heat-treatment precision, and fortification processes are enabling producers to develop high-heat and nutrient-enriched NFDM variants tailored for specific applications. In 2024, innovations included blending with whey proteins for sports nutrition and creating instantized powders for home reconstitution. By 2025, expanded applications in ready-to-drink beverages, bakery mixes, and fortified snack products were opening new revenue streams.
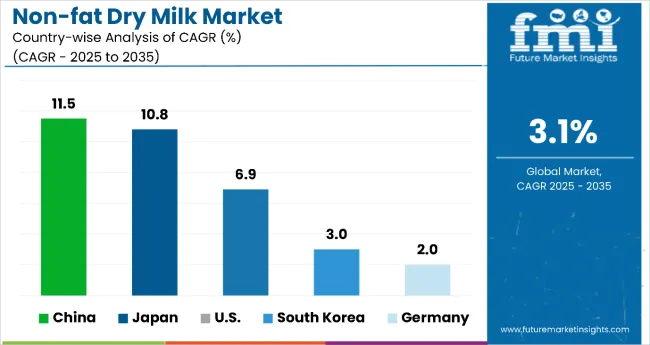
Analysis of Non-Fat Dry Milk Market by Key Countries

Non Fat Dry Milk Market By Country

Countries CAGR
China 11.5%
Japan 10.8%
USA 6.9%
South Korea 3.0%
Germany 2.0%

China leads growth with a projected CAGR of 11.5% from 2025 to 2035, fueled by rapid food processing industrialization, expanding bakery and snack sectors, and strong government support for dairy self-sufficiency. Japan follows with 10.8% CAGR, driven by premiumization, functional fortification for an aging population, and export-oriented specialty production. The USA maintains steady momentum at 6.9% CAGR, leveraging advanced processing technology, diversified applications, and strong cooperative-led manufacturing. South Korea, with a modest 3.0% CAGR, benefits from e-commerce penetration, convenience foods, and growing wellness demand. Germany posts the slowest growth at 2.0% CAGR, reflecting a mature, value-driven market focused on organic and certified products.

The report covers an in-depth analysis of 40+ countries; five top-performing OECD countries are highlighted below.

Accelerated Industrial Integration in Non-Fat Dry Milk Market in China

The non-fat dry milk market in China is witnessing robust expansion at a CAGR of 11.5% from 2025, underpinned by rapid industrialization of food processing, growing bakery and snack production, and increasing consumer preference for fortified dairy-based products. Modern trade and e-commerce are boosting penetration into urban and semi-urban areas, while government-backed investments in processing facilities strengthen domestic supply.

Imports remain vital for specialty high-heat powders demanded by industrial bakers. Strategic partnerships between global dairy giants and local processors are enhancing technical know-how, quality consistency, and brand recognition. Additionally, China’s shift toward self-sufficiency in dairy ingredients aligns with broader food security goals, further accelerating NFDM adoption across applications from bakery to ready-to-drink beverages. The increasing use of NFDM in fortified beverages and sports nutrition blends adds a new revenue layer for manufacturers.
  • Rapid growth in organized retail and online platforms.
  • Expanding bakery and confectionery industries driving demand.
  • Strong government support for processing infrastructure.

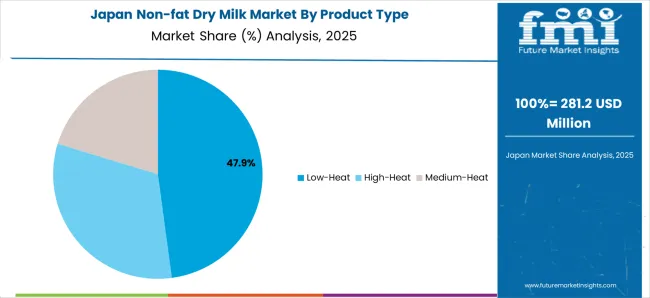
Premiumization and Functional Innovation in Non-Fat Dry Milk Market in Japan

Revenue from non-fat dry milk in Japan is driven by a CAGR of 10.8%, preference for premium, high-quality dairy ingredients and the integration of fortified powders into functional foods targeting its aging population. The country’s strong processed food culture sustains high-heat NFDM demand, especially in institutional baking and confectionery.

Stringent regulatory frameworks ensure only certified suppliers thrive, favoring established brands with traceable supply chains. Innovative instantized NFDM products enriched with calcium, vitamins, and protein blends are increasingly tailored for elderly nutrition and convenience-based applications. Export-oriented production of specialty Japanese formulations further enhances the country’s reputation for quality, opening opportunities in regional premium markets. With rising health consciousness, Japanese consumers are also driving growth in lactose-free and low-fat fortified NFDM variants.
  • High value placed on certified, traceable products.
  • Aging population driving fortified nutrition demand.
  • Institutional bakery sector ensures stable volume needs.

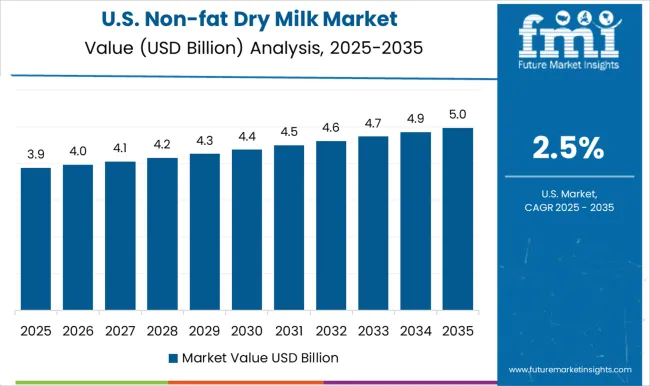
Technological Diversification in Non-Fat Dry Milk Market in the USA

Sales of non-fat dry milk in the USA are expected to grow at a CAGR of 6.9%, maintaining steady growth through a combination of industrial demand, strong dairy infrastructure, and innovation in product formulations. Major cooperatives and private labels dominate production, supplying to both domestic and export markets. NFDM is integral to bakery, confectionery, sports nutrition, and ready-to-mix beverages, benefiting from a well-developed distribution network across modern trade and online channels.

Technological advancements in instantization, protein enrichment, and blending with plant-based ingredients have expanded product versatility. Exports help balance production surpluses, while niche opportunities emerge in high-protein, low-fat dairy blends for the wellness market. Rising demand for clean-label NFDM and fortified blends continues to shape manufacturing strategies.
  • Mature, well-integrated supply chains.
  • Strong sports nutrition and fortified product adoption.
  • Large cooperative-led manufacturing capacity.

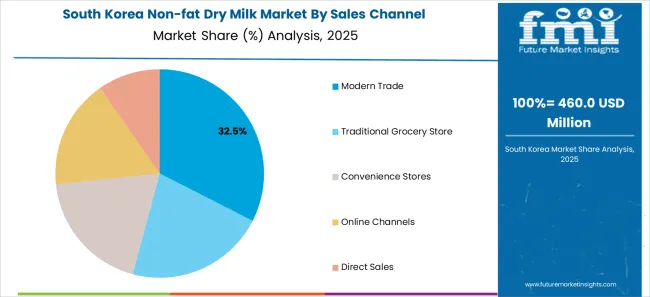
Digital Channel Penetration in Non-Fat Dry Milk Market in South Korea

Demand for non-fat dry milk in South Korea is growing at a CAGR of 3.0% modest but consistent, with demand driven by urban lifestyles, convenience foods, and rising interest in functional nutrition. Modern retail and advanced e-commerce platforms are the primary sales channels, often catering to consumers seeking premium instantized and fortified variants.

Foodservice and snack manufacturers prefer NFDM for its versatility and shelf stability, particularly in ready-to-drink and bakery applications. Imports are crucial to meeting specialized industrial-grade requirements, while domestic producers focus on flavor innovation and packaging formats suited for smaller households. Increasing emphasis on high-protein, low-sugar dairy blends is creating opportunities in the fitness and wellness segments.
  • Strong e-commerce adoption for dairy ingredients.
  • Popularity of fortified and flavored NFDM.
  • Incremental growth from foodservice industry.

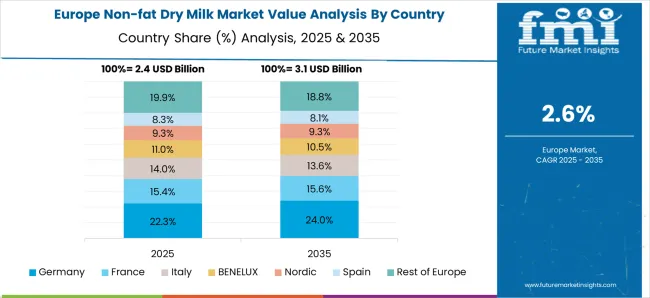
Regulatory and Organic-Driven Growth in Non-Fat Dry Milk Market in Germany

Non-fat dry milk revenue in Germany is forecasted at a CAGR of 2.0%, demonstrates steady growth, shaped by strict regulatory standards, high consumer awareness, and a strong inclination toward organic and sustainably sourced dairy products. Industrial demand remains concentrated in the bakery, confectionery, and dairy blend sectors, where quality certifications are critical for supplier selection. Growth is largely value-driven, with consumers paying premiums for traceable, pesticide-free, and animal welfare-compliant products.

Domestic production emphasizes quality consistency and environmental responsibility, aligning with Germany’s broader environmental objectives. While volume expansion is limited, opportunities lie in premium fortified blends and niche exports to other European countries demanding certified products. Rising consumer demand for organic, high-protein NFDM blends is boosting supplier differentiation in this mature market.
  • High preference for organic and certified NFDM.
  • Strong industrial base in bakery and confectionery.
  • Stringent quality and labeling compliance requirements.

Competitive Landscape of Non-Fat Dry Milk Market

Non Fat Dry Milk Market By Company

The market is moderately fragmented, with Nestlé S.A. leading at 20% market share, followed by Dairy Farmers of America (DFA) with 11.2%. The cooperative’s dominance stems from its vast production capacity, vertically integrated supply chain, and strong global export presence, supplying both industrial and consumer-grade NFDM.

Leading player status is held by Dairy Farmers of America. Other key players include Fonterra Co-operative Group, Nestlé S.A., Arla Foods amba, Saputo Inc., Lactalis Ingredients, Glanbia plc, FrieslandCampina, California Dairies Inc., Murray Goulburn Co-operative, and Hoogwegt Group, each offering diverse NFDM variants such as high-heat, medium-heat, and low-heat powders, tailored for applications in bakery, confectionery, beverages, and nutritional products. Many of these players emphasize functional enrichment, instantization technology, and clean-label certifications to meet evolving consumer preferences.

Emerging players are entering through specialized fortified formulations, lactose-free variants, and regional supply agreements, yet established manufacturers hold competitive advantages through economies of scale, advanced processing facilities, and long-standing relationships with multinational food and beverage companies. Market growth is further fueled by rising protein supplementation trends, increasing demand from developing markets, and innovation in packaging formats for both industrial and retail buyers.

Scope of the Report - Non-Fat Dry Milk Market

Item Value
Quantitative Units USD 8.9 Billion
Product Type High-heat, Medium-heat, Low-heat
Sales Channel Modern Trade, Traditional Grocery Store, Convenience Stores, Online Channels, Direct Sales
Application Home Reconstitutions, Dairy Whiteners, Bakery and Confectionery, Desserts, Ice-cream, Dairy Blends, Snacks, Nutritional Supplements
Regions Covered North America, Europe, Asia-Pacific, Latin America, Middle East & Africa
Countries Covered United States, Canada, United Kingdom, Germany, France, China, Japan, South Korea, Brazil, Australia and 40+ countries
Key Companies Profiled HOCHDORF Holding Ltd., The St. Albans Cooperative Creamery, American Dairy Products Institute, Bob’s Red Mill Natural Foods, Nestle S.A., All American Foods, Inc., Arla Foods, DairyAmerica, Inc., Amul NOW Foods, Earth’s Own Food Company Inc., The Hain Celestial Group
Additional Attributes Dollar sales by product type and sales channel, growing usage in bakery, confectionery, beverages, and sports nutrition applications, stable demand in institutional and industrial processing, innovations in spray-drying, instantization, and blending technology improve solubility, shelf life, and functionality.

Key Segments

By Product Type:

  • High-heat
  • Medium-heat
  • Low-heat

By Sales Channel:

  • Modern Trade
  • Traditional Grocery Store
  • Convenience Stores
  • Online Channels
  • Direct Sales

By Application:

  • Home Reconstitutions
  • Dairy Whiteners
  • Bakery and Confectionery
  • Desserts
  • Ice-cream
  • Dairy Blends
  • Snacks
  • Nutritional Supplements

By Region:

  • North America
  • Latin America
  • Europe
  • Asia Pacific
  • Middle East & Africa (MEA)

Table of Content

  1. Executive Summary
    • Global Market Outlook
    • Demand-side Trends
    • Supply-side Trends
    • Technology Roadmap Analysis
    • Analysis and Recommendations
  2. Market Overview
    • Market Coverage / Taxonomy
    • Market Definition / Scope / Limitations
  3. Market Background
    • Market Dynamics
      • Drivers
      • Restraints
      • Opportunity
      • Trends
    • Scenario Forecast
      • Demand in Optimistic Scenario
      • Demand in Likely Scenario
      • Demand in Conservative Scenario
    • Opportunity Map Analysis
    • Product Life Cycle Analysis
    • Supply Chain Analysis
      • Supply Side Participants and their Roles
        • Producers
        • Mid-Level Participants (Traders/ Agents/ Brokers)
        • Wholesalers and Distributors
      • Value Added and Value Created at Node in the Supply Chain
      • List of Raw Material Suppliers
      • List of Existing and Potential Buyer’s
    • Investment Feasibility Matrix
    • Value Chain Analysis
      • Profit Margin Analysis
      • Wholesalers and Distributors
      • Retailers
    • PESTLE and Porter’s Analysis
    • Regulatory Landscape
      • By Key Regions
      • By Key Countries
    • Regional Parent Market Outlook
    • Production and Consumption Statistics
    • Import and Export Statistics
  4. Global Market Analysis 2020 to 2024 and Forecast, 2025 to 2035
    • Historical Market Size Value (USD Billion) & Volume (Kilotons) Analysis, 2020 to 2024
    • Current and Future Market Size Value (USD Billion) & Volume (Kilotons) Projections, 2025 to 2035
      • Y-o-Y Growth Trend Analysis
      • Absolute $ Opportunity Analysis
  5. Global Market Pricing Analysis 2020 to 2024 and Forecast 2025 to 2035
  6. Global Market Analysis 2020 to 2024 and Forecast 2025 to 2035, By Product Type
    • Introduction / Key Findings
    • Historical Market Size Value (USD Billion) & Volume (Kilotons) Analysis By Product Type, 2020 to 2024
    • Current and Future Market Size Value (USD Billion) & Volume (Kilotons) Analysis and Forecast By Product Type, 2025 to 2035
      • High-heat
      • Medium-heat
      • Low-heat
    • Y-o-Y Growth Trend Analysis By Product Type, 2020 to 2024
    • Absolute $ Opportunity Analysis By Product Type, 2025 to 2035
  7. Global Market Analysis 2020 to 2024 and Forecast 2025 to 2035, By Sales Channel
    • Introduction / Key Findings
    • Historical Market Size Value (USD Billion) & Volume (Kilotons) Analysis By Sales Channel, 2020 to 2024
    • Current and Future Market Size Value (USD Billion) & Volume (Kilotons) Analysis and Forecast By Sales Channel, 2025 to 2035
      • Modern Trade
      • Traditional Grocery Store
      • Convenience Stores
      • Online Channels
      • Direct Sales
    • Y-o-Y Growth Trend Analysis By Sales Channel, 2020 to 2024
    • Absolute $ Opportunity Analysis By Sales Channel, 2025 to 2035
  8. Global Market Analysis 2020 to 2024 and Forecast 2025 to 2035, By Application
    • Introduction / Key Findings
    • Historical Market Size Value (USD Billion) & Volume (Kilotons) Analysis By Application, 2020 to 2024
    • Current and Future Market Size Value (USD Billion) & Volume (Kilotons) Analysis and Forecast By Application, 2025 to 2035
      • Home Reconstitutions
      • Dairy Whiteners
      • Bakery and Confectionery
      • Desserts
      • Ice-cream
      • Dairy Blends
      • Snacks
      • Nutritional Supplements
    • Y-o-Y Growth Trend Analysis By Application, 2020 to 2024
    • Absolute $ Opportunity Analysis By Application, 2025 to 2035
  9. Global Market Analysis 2020 to 2024 and Forecast 2025 to 2035, By Region
    • Introduction
    • Historical Market Size Value (USD Billion) & Volume (Kilotons) Analysis By Region, 2020 to 2024
    • Current Market Size Value (USD Billion) & Volume (Kilotons) Analysis and Forecast By Region, 2025 to 2035
      • North America
      • Latin America
      • Western Europe
      • Eastern Europe
      • East Asia
      • South Asia & Pacific
      • Middle East and Africa
    • Market Attractiveness Analysis By Region
  10. North America Market Analysis 2020 to 2024 and Forecast 2025 to 2035, By Country
    • Historical Market Size Value (USD Billion) & Volume (Kilotons) Trend Analysis By Market Taxonomy, 2020 to 2024
    • Market Size Value (USD Billion) & Volume (Kilotons) Forecast By Market Taxonomy, 2025 to 2035
      • By Country
        • USA
        • Canada
        • Mexico
      • By Product Type
      • By Sales Channel
      • By Application
    • Market Attractiveness Analysis
      • By Country
      • By Product Type
      • By Sales Channel
      • By Application
    • Key Takeaways
  11. Latin America Market Analysis 2020 to 2024 and Forecast 2025 to 2035, By Country
    • Historical Market Size Value (USD Billion) & Volume (Kilotons) Trend Analysis By Market Taxonomy, 2020 to 2024
    • Market Size Value (USD Billion) & Volume (Kilotons) Forecast By Market Taxonomy, 2025 to 2035
      • By Country
        • Brazil
        • Argentina
        • Rest of LATAM
      • By Product Type
      • By Sales Channel
      • By Application
    • Market Attractiveness Analysis
      • By Country
      • By Product Type
      • By Sales Channel
      • By Application
    • Key Takeaways
  12. Western Europe Market Analysis 2020 to 2024 and Forecast 2025 to 2035, By Country
    • Historical Market Size Value (USD Billion) & Volume (Kilotons) Trend Analysis By Market Taxonomy, 2020 to 2024
    • Market Size Value (USD Billion) & Volume (Kilotons) Forecast By Market Taxonomy, 2025 to 2035
      • By Country
        • Germany
        • Italy
        • France
        • UK
        • Spain
        • BENELUX
        • Nordic
        • Rest of W.Europe
      • By Product Type
      • By Sales Channel
      • By Application
    • Market Attractiveness Analysis
      • By Country
      • By Product Type
      • By Sales Channel
      • By Application
    • Key Takeaways
  13. Eastern Europe Market Analysis 2020 to 2024 and Forecast 2025 to 2035, By Country
    • Historical Market Size Value (USD Billion) & Volume (Kilotons) Trend Analysis By Market Taxonomy, 2020 to 2024
    • Market Size Value (USD Billion) & Volume (Kilotons) Forecast By Market Taxonomy, 2025 to 2035
      • By Country
        • Russia
        • Hungary
        • Poland
        • Balkan & Baltics
        • Rest of E. Europe
      • By Product Type
      • By Sales Channel
      • By Application
    • Market Attractiveness Analysis
      • By Country
      • By Product Type
      • By Sales Channel
      • By Application
    • Key Takeaways
  14. East Asia Market Analysis 2020 to 2024 and Forecast 2025 to 2035, By Country
    • Historical Market Size Value (USD Billion) & Volume (Kilotons) Trend Analysis By Market Taxonomy, 2020 to 2024
    • Market Size Value (USD Billion) & Volume (Kilotons) Forecast By Market Taxonomy, 2025 to 2035
      • By Country
        • China
        • Japan
        • South Korea
      • By Product Type
      • By Sales Channel
      • By Application
    • Market Attractiveness Analysis
      • By Country
      • By Product Type
      • By Sales Channel
      • By Application
    • Key Takeaways
  15. South Asia & Pacific Market Analysis 2020 to 2024 and Forecast 2025 to 2035, By Country
    • Historical Market Size Value (USD Billion) & Volume (Kilotons) Trend Analysis By Market Taxonomy, 2020 to 2024
    • Market Size Value (USD Billion) & Volume (Kilotons) Forecast By Market Taxonomy, 2025 to 2035
      • By Country
        • India
        • Australia & New Zealand
        • ASEAN
        • Rest of SAP
      • By Product Type
      • By Sales Channel
      • By Application
    • Market Attractiveness Analysis
      • By Country
      • By Product Type
      • By Sales Channel
      • By Application
    • Key Takeaways
  16. Middle East and Africa Market Analysis 2020 to 2024 and Forecast 2025 to 2035, By Country
    • Historical Market Size Value (USD Billion) & Volume (Kilotons) Trend Analysis By Market Taxonomy, 2020 to 2024
    • Market Size Value (USD Billion) & Volume (Kilotons) Forecast By Market Taxonomy, 2025 to 2035
      • By Country
        • GCC Countries
        • Northern Africa
        • South Africa
        • Turkiye
        • Rest of MEA
      • By Product Type
      • By Sales Channel
      • By Application
    • Market Attractiveness Analysis
      • By Country
      • By Product Type
      • By Sales Channel
      • By Application
    • Key Takeaways
  17. Key Countries Market Analysis
    • USA
      • Pricing Analysis
      • Market Share Analysis, 2024
        • By Product Type
        • By Sales Channel
        • By Application
    • Canada
      • Pricing Analysis
      • Market Share Analysis, 2024
        • By Product Type
        • By Sales Channel
        • By Application
    • Brazil
      • Pricing Analysis
      • Market Share Analysis, 2024
        • By Product Type
        • By Sales Channel
        • By Application
    • Mexico
      • Pricing Analysis
      • Market Share Analysis, 2024
        • By Product Type
        • By Sales Channel
        • By Application
    • Argentina
      • Pricing Analysis
      • Market Share Analysis, 2024
        • By Product Type
        • By Sales Channel
        • By Application
  18. Market Structure Analysis
    • Competition Dashboard
    • Competition Benchmarking
    • Market Share Analysis of Top Players
      • By Regional
      • By Product Type
      • By Sales Channel
      • By Application
  19. Competition Analysis
    • Competition Deep Dive
      • HOCHDORF Holding Ltd.
        • Overview
        • Product Portfolio
        • Profitability by Market Segments (Product/Age /Sales Channel/Region)
        • Sales Footprint
        • Strategy Overview
          • Marketing Strategy
          • Product Strategy
          • Channel Strategy
      • The St. Albans Cooperative Creamery
        • Overview
        • Product Portfolio
        • Profitability by Market Segments (Product/Age /Sales Channel/Region)
        • Sales Footprint
        • Strategy Overview
          • Marketing Strategy
          • Product Strategy
          • Channel Strategy
      • American Dairy Products Institute
        • Overview
        • Product Portfolio
        • Profitability by Market Segments (Product/Age /Sales Channel/Region)
        • Sales Footprint
        • Strategy Overview
          • Marketing Strategy
          • Product Strategy
          • Channel Strategy
      • Bob’s Red Mill Natural Foods
        • Overview
        • Product Portfolio
        • Profitability by Market Segments (Product/Age /Sales Channel/Region)
        • Sales Footprint
        • Strategy Overview
          • Marketing Strategy
          • Product Strategy
          • Channel Strategy
      • Nestle S.A.
        • Overview
        • Product Portfolio
        • Profitability by Market Segments (Product/Age /Sales Channel/Region)
        • Sales Footprint
        • Strategy Overview
          • Marketing Strategy
          • Product Strategy
          • Channel Strategy
      • All American Foods, Inc.
        • Overview
        • Product Portfolio
        • Profitability by Market Segments (Product/Age /Sales Channel/Region)
        • Sales Footprint
        • Strategy Overview
          • Marketing Strategy
          • Product Strategy
          • Channel Strategy
      • Arla Foods
        • Overview
        • Product Portfolio
        • Profitability by Market Segments (Product/Age /Sales Channel/Region)
        • Sales Footprint
        • Strategy Overview
          • Marketing Strategy
          • Product Strategy
          • Channel Strategy
      • DairyAmerica, Inc.
        • Overview
        • Product Portfolio
        • Profitability by Market Segments (Product/Age /Sales Channel/Region)
        • Sales Footprint
        • Strategy Overview
          • Marketing Strategy
          • Product Strategy
          • Channel Strategy
      • Amul NOW Foods
        • Overview
        • Product Portfolio
        • Profitability by Market Segments (Product/Age /Sales Channel/Region)
        • Sales Footprint
        • Strategy Overview
          • Marketing Strategy
          • Product Strategy
          • Channel Strategy
      • Earth’s Own Food Company Inc.
        • Overview
        • Product Portfolio
        • Profitability by Market Segments (Product/Age /Sales Channel/Region)
        • Sales Footprint
        • Strategy Overview
          • Marketing Strategy
          • Product Strategy
          • Channel Strategy
      • The Hain Celestial Group
        • Overview
        • Product Portfolio
        • Profitability by Market Segments (Product/Age /Sales Channel/Region)
        • Sales Footprint
        • Strategy Overview
          • Marketing Strategy
          • Product Strategy
          • Channel Strategy
  20. Assumptions & Acronyms Used
  21. Research Methodology

List of Tables

  • Table 1: Global Market Value (USD Billion) Forecast by Region, 2020-2035
  • Table 2: Global Market Volume (Kilotons) Forecast by Region, 2020-2035
  • Table 3: Global Market Value (USD Billion) Forecast by Product Type, 2020-2035
  • Table 4: Global Market Volume (Kilotons) Forecast by Product Type, 2020-2035
  • Table 5: Global Market Value (USD Billion) Forecast by Sales Channel, 2020-2035
  • Table 6: Global Market Volume (Kilotons) Forecast by Sales Channel, 2020-2035
  • Table 7: Global Market Value (USD Billion) Forecast by Application, 2020-2035
  • Table 8: Global Market Volume (Kilotons) Forecast by Application, 2020-2035
  • Table 9: North America Market Value (USD Billion) Forecast by Country, 2020-2035
  • Table 10: North America Market Volume (Kilotons) Forecast by Country, 2020-2035
  • Table 11: North America Market Value (USD Billion) Forecast by Product Type, 2020-2035
  • Table 12: North America Market Volume (Kilotons) Forecast by Product Type, 2020-2035
  • Table 13: North America Market Value (USD Billion) Forecast by Sales Channel, 2020-2035
  • Table 14: North America Market Volume (Kilotons) Forecast by Sales Channel, 2020-2035
  • Table 15: North America Market Value (USD Billion) Forecast by Application, 2020-2035
  • Table 16: North America Market Volume (Kilotons) Forecast by Application, 2020-2035
  • Table 17: Latin America Market Value (USD Billion) Forecast by Country, 2020-2035
  • Table 18: Latin America Market Volume (Kilotons) Forecast by Country, 2020-2035
  • Table 19: Latin America Market Value (USD Billion) Forecast by Product Type, 2020-2035
  • Table 20: Latin America Market Volume (Kilotons) Forecast by Product Type, 2020-2035
  • Table 21: Latin America Market Value (USD Billion) Forecast by Sales Channel, 2020-2035
  • Table 22: Latin America Market Volume (Kilotons) Forecast by Sales Channel, 2020-2035
  • Table 23: Latin America Market Value (USD Billion) Forecast by Application, 2020-2035
  • Table 24: Latin America Market Volume (Kilotons) Forecast by Application, 2020-2035
  • Table 25: Western Europe Market Value (USD Billion) Forecast by Country, 2020-2035
  • Table 26: Western Europe Market Volume (Kilotons) Forecast by Country, 2020-2035
  • Table 27: Western Europe Market Value (USD Billion) Forecast by Product Type, 2020-2035
  • Table 28: Western Europe Market Volume (Kilotons) Forecast by Product Type, 2020-2035
  • Table 29: Western Europe Market Value (USD Billion) Forecast by Sales Channel, 2020-2035
  • Table 30: Western Europe Market Volume (Kilotons) Forecast by Sales Channel, 2020-2035
  • Table 31: Western Europe Market Value (USD Billion) Forecast by Application, 2020-2035
  • Table 32: Western Europe Market Volume (Kilotons) Forecast by Application, 2020-2035
  • Table 33: Eastern Europe Market Value (USD Billion) Forecast by Country, 2020-2035
  • Table 34: Eastern Europe Market Volume (Kilotons) Forecast by Country, 2020-2035
  • Table 35: Eastern Europe Market Value (USD Billion) Forecast by Product Type, 2020-2035
  • Table 36: Eastern Europe Market Volume (Kilotons) Forecast by Product Type, 2020-2035
  • Table 37: Eastern Europe Market Value (USD Billion) Forecast by Sales Channel, 2020-2035
  • Table 38: Eastern Europe Market Volume (Kilotons) Forecast by Sales Channel, 2020-2035
  • Table 39: Eastern Europe Market Value (USD Billion) Forecast by Application, 2020-2035
  • Table 40: Eastern Europe Market Volume (Kilotons) Forecast by Application, 2020-2035
  • Table 41: East Asia Market Value (USD Billion) Forecast by Country, 2020-2035
  • Table 42: East Asia Market Volume (Kilotons) Forecast by Country, 2020-2035
  • Table 43: East Asia Market Value (USD Billion) Forecast by Product Type, 2020-2035
  • Table 44: East Asia Market Volume (Kilotons) Forecast by Product Type, 2020-2035
  • Table 45: East Asia Market Value (USD Billion) Forecast by Sales Channel, 2020-2035
  • Table 46: East Asia Market Volume (Kilotons) Forecast by Sales Channel, 2020-2035
  • Table 47: East Asia Market Value (USD Billion) Forecast by Application, 2020-2035
  • Table 48: East Asia Market Volume (Kilotons) Forecast by Application, 2020-2035
  • Table 49: South Asia & Pacific Market Value (USD Billion) Forecast by Country, 2020-2035
  • Table 50: South Asia & Pacific Market Volume (Kilotons) Forecast by Country, 2020-2035
  • Table 51: South Asia & Pacific Market Value (USD Billion) Forecast by Product Type, 2020-2035
  • Table 52: South Asia & Pacific Market Volume (Kilotons) Forecast by Product Type, 2020-2035
  • Table 53: South Asia & Pacific Market Value (USD Billion) Forecast by Sales Channel, 2020-2035
  • Table 54: South Asia & Pacific Market Volume (Kilotons) Forecast by Sales Channel, 2020-2035
  • Table 55: South Asia & Pacific Market Value (USD Billion) Forecast by Application, 2020-2035
  • Table 56: South Asia & Pacific Market Volume (Kilotons) Forecast by Application, 2020-2035
  • Table 57: Middle East and Africa Market Value (USD Billion) Forecast by Country, 2020-2035
  • Table 58: Middle East and Africa Market Volume (Kilotons) Forecast by Country, 2020-2035
  • Table 59: Middle East and Africa Market Value (USD Billion) Forecast by Product Type, 2020-2035
  • Table 60: Middle East and Africa Market Volume (Kilotons) Forecast by Product Type, 2020-2035
  • Table 61: Middle East and Africa Market Value (USD Billion) Forecast by Sales Channel, 2020-2035
  • Table 62: Middle East and Africa Market Volume (Kilotons) Forecast by Sales Channel, 2020-2035
  • Table 63: Middle East and Africa Market Value (USD Billion) Forecast by Application, 2020-2035
  • Table 64: Middle East and Africa Market Volume (Kilotons) Forecast by Application, 2020-2035

List of Figures

  • Figure 1: Global Market Volume (Kilotons) Forecast 2020-2035
  • Figure 2: Global Market Pricing Analysis
  • Figure 3: Global Market Value (USD Billion) Forecast 2020-2035
  • Figure 4: Global Market Value Share and BPS Analysis by Product Type, 2025 and 2035
  • Figure 5: Global Market Y-o-Y Growth Comparison by Product Type, 2025-2035
  • Figure 6: Global Market Attractiveness Analysis by Product Type
  • Figure 7: Global Market Value Share and BPS Analysis by Sales Channel, 2025 and 2035
  • Figure 8: Global Market Y-o-Y Growth Comparison by Sales Channel, 2025-2035
  • Figure 9: Global Market Attractiveness Analysis by Sales Channel
  • Figure 10: Global Market Value Share and BPS Analysis by Application, 2025 and 2035
  • Figure 11: Global Market Y-o-Y Growth Comparison by Application, 2025-2035
  • Figure 12: Global Market Attractiveness Analysis by Application
  • Figure 13: Global Market Value (USD Billion) Share and BPS Analysis by Region, 2025 and 2035
  • Figure 14: Global Market Y-o-Y Growth Comparison by Region, 2025-2035
  • Figure 15: Global Market Attractiveness Analysis by Region
  • Figure 16: North America Market Incremental $ Opportunity, 2025-2035
  • Figure 17: Latin America Market Incremental $ Opportunity, 2025-2035
  • Figure 18: Western Europe Market Incremental $ Opportunity, 2025-2035
  • Figure 19: Eastern Europe Market Incremental $ Opportunity, 2025-2035
  • Figure 20: East Asia Market Incremental $ Opportunity, 2025-2035
  • Figure 21: South Asia & Pacific Market Incremental $ Opportunity, 2025-2035
  • Figure 22: Middle East and Africa Market Incremental $ Opportunity, 2025-2035
  • Figure 23: North America Market Value Share and BPS Analysis by Country, 2025 and 2035
  • Figure 24: North America Market Value Share and BPS Analysis by Product Type, 2025 and 2035
  • Figure 25: North America Market Y-o-Y Growth Comparison by Product Type, 2025-2035
  • Figure 26: North America Market Attractiveness Analysis by Product Type
  • Figure 27: North America Market Value Share and BPS Analysis by Sales Channel, 2025 and 2035
  • Figure 28: North America Market Y-o-Y Growth Comparison by Sales Channel, 2025-2035
  • Figure 29: North America Market Attractiveness Analysis by Sales Channel
  • Figure 30: North America Market Value Share and BPS Analysis by Application, 2025 and 2035
  • Figure 31: North America Market Y-o-Y Growth Comparison by Application, 2025-2035
  • Figure 32: North America Market Attractiveness Analysis by Application
  • Figure 33: Latin America Market Value Share and BPS Analysis by Country, 2025 and 2035
  • Figure 34: Latin America Market Value Share and BPS Analysis by Product Type, 2025 and 2035
  • Figure 35: Latin America Market Y-o-Y Growth Comparison by Product Type, 2025-2035
  • Figure 36: Latin America Market Attractiveness Analysis by Product Type
  • Figure 37: Latin America Market Value Share and BPS Analysis by Sales Channel, 2025 and 2035
  • Figure 38: Latin America Market Y-o-Y Growth Comparison by Sales Channel, 2025-2035
  • Figure 39: Latin America Market Attractiveness Analysis by Sales Channel
  • Figure 40: Latin America Market Value Share and BPS Analysis by Application, 2025 and 2035
  • Figure 41: Latin America Market Y-o-Y Growth Comparison by Application, 2025-2035
  • Figure 42: Latin America Market Attractiveness Analysis by Application
  • Figure 43: Western Europe Market Value Share and BPS Analysis by Country, 2025 and 2035
  • Figure 44: Western Europe Market Value Share and BPS Analysis by Product Type, 2025 and 2035
  • Figure 45: Western Europe Market Y-o-Y Growth Comparison by Product Type, 2025-2035
  • Figure 46: Western Europe Market Attractiveness Analysis by Product Type
  • Figure 47: Western Europe Market Value Share and BPS Analysis by Sales Channel, 2025 and 2035
  • Figure 48: Western Europe Market Y-o-Y Growth Comparison by Sales Channel, 2025-2035
  • Figure 49: Western Europe Market Attractiveness Analysis by Sales Channel
  • Figure 50: Western Europe Market Value Share and BPS Analysis by Application, 2025 and 2035
  • Figure 51: Western Europe Market Y-o-Y Growth Comparison by Application, 2025-2035
  • Figure 52: Western Europe Market Attractiveness Analysis by Application
  • Figure 53: Eastern Europe Market Value Share and BPS Analysis by Country, 2025 and 2035
  • Figure 54: Eastern Europe Market Value Share and BPS Analysis by Product Type, 2025 and 2035
  • Figure 55: Eastern Europe Market Y-o-Y Growth Comparison by Product Type, 2025-2035
  • Figure 56: Eastern Europe Market Attractiveness Analysis by Product Type
  • Figure 57: Eastern Europe Market Value Share and BPS Analysis by Sales Channel, 2025 and 2035
  • Figure 58: Eastern Europe Market Y-o-Y Growth Comparison by Sales Channel, 2025-2035
  • Figure 59: Eastern Europe Market Attractiveness Analysis by Sales Channel
  • Figure 60: Eastern Europe Market Value Share and BPS Analysis by Application, 2025 and 2035
  • Figure 61: Eastern Europe Market Y-o-Y Growth Comparison by Application, 2025-2035
  • Figure 62: Eastern Europe Market Attractiveness Analysis by Application
  • Figure 63: East Asia Market Value Share and BPS Analysis by Country, 2025 and 2035
  • Figure 64: East Asia Market Value Share and BPS Analysis by Product Type, 2025 and 2035
  • Figure 65: East Asia Market Y-o-Y Growth Comparison by Product Type, 2025-2035
  • Figure 66: East Asia Market Attractiveness Analysis by Product Type
  • Figure 67: East Asia Market Value Share and BPS Analysis by Sales Channel, 2025 and 2035
  • Figure 68: East Asia Market Y-o-Y Growth Comparison by Sales Channel, 2025-2035
  • Figure 69: East Asia Market Attractiveness Analysis by Sales Channel
  • Figure 70: East Asia Market Value Share and BPS Analysis by Application, 2025 and 2035
  • Figure 71: East Asia Market Y-o-Y Growth Comparison by Application, 2025-2035
  • Figure 72: East Asia Market Attractiveness Analysis by Application
  • Figure 73: South Asia & Pacific Market Value Share and BPS Analysis by Country, 2025 and 2035
  • Figure 74: South Asia & Pacific Market Value Share and BPS Analysis by Product Type, 2025 and 2035
  • Figure 75: South Asia & Pacific Market Y-o-Y Growth Comparison by Product Type, 2025-2035
  • Figure 76: South Asia & Pacific Market Attractiveness Analysis by Product Type
  • Figure 77: South Asia & Pacific Market Value Share and BPS Analysis by Sales Channel, 2025 and 2035
  • Figure 78: South Asia & Pacific Market Y-o-Y Growth Comparison by Sales Channel, 2025-2035
  • Figure 79: South Asia & Pacific Market Attractiveness Analysis by Sales Channel
  • Figure 80: South Asia & Pacific Market Value Share and BPS Analysis by Application, 2025 and 2035
  • Figure 81: South Asia & Pacific Market Y-o-Y Growth Comparison by Application, 2025-2035
  • Figure 82: South Asia & Pacific Market Attractiveness Analysis by Application
  • Figure 83: Middle East and Africa Market Value Share and BPS Analysis by Country, 2025 and 2035
  • Figure 84: Middle East and Africa Market Value Share and BPS Analysis by Product Type, 2025 and 2035
  • Figure 85: Middle East and Africa Market Y-o-Y Growth Comparison by Product Type, 2025-2035
  • Figure 86: Middle East and Africa Market Attractiveness Analysis by Product Type
  • Figure 87: Middle East and Africa Market Value Share and BPS Analysis by Sales Channel, 2025 and 2035
  • Figure 88: Middle East and Africa Market Y-o-Y Growth Comparison by Sales Channel, 2025-2035
  • Figure 89: Middle East and Africa Market Attractiveness Analysis by Sales Channel
  • Figure 90: Middle East and Africa Market Value Share and BPS Analysis by Application, 2025 and 2035
  • Figure 91: Middle East and Africa Market Y-o-Y Growth Comparison by Application, 2025-2035
  • Figure 92: Middle East and Africa Market Attractiveness Analysis by Application
  • Figure 93: Global Market - Tier Structure Analysis
  • Figure 94: Global Market - Company Share Analysis

Frequently Asked Questions

How big is the non-fat dry milk market in 2025?

The global non-fat dry milk market is estimated to be valued at USD 8.9 billion in 2025.

What will be the size of the non-fat dry milk market in 2035?

The market size for the non-fat dry milk market is projected to reach USD 12.1 billion by 2035.

How much will be the non-fat dry milk market growth between 2025 and 2035?

The non-fat dry milk market is expected to grow at a 3.1% CAGR between 2025 and 2035.

Which product type segment is projected to lead in the non-fat dry milk market in 2025?

The high-heat segment is projected to lead in the non-fat dry milk market with 50% market share in 2025.

Which sales channel is set to contribute significant share in the non-fat dry milk market in 2025?

In terms of sales channel, the modern trade segment is expected to command 30% share in the non-fat dry milk market in 2025.

Explore Similar Insights

Future Market Insights

Non-fat Dry Milk Market

Chat With

MaRIA

Hi There, I am MaRIA, Your Market Research Intelligence Assistant. How may I help you?