
- Market Size (2026)
- USD 6.5 Bn
- Forecast (2036)
- USD 19.3 Bn
- CAGR (2026 to 2036)
- 11.5%
How big is Ready-to-Serve Cocktails Market in 2026?
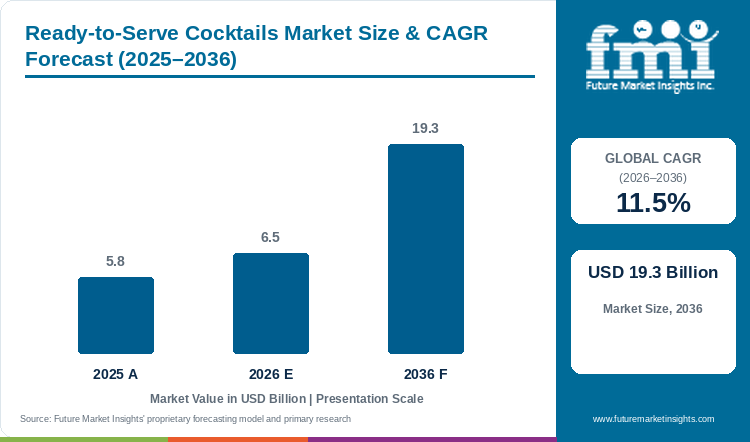
Demand for ready-to-serve cocktails is projected to expand at 11.5% CAGR between 2026 and 2036. Industry value grows from USD 5.8 billion in 2025 to USD 6.5 billion in 2026 and is projected to reach USD 19.3 billion by 2036.
The market enters 2026 with beverage brand owners packaging established cocktail recipes into shelf-stable formats that eliminate the need for specialized bar equipment or manual measuring. As per FMI, valuation rises from USD 5.8 billion in 2025 to an estimated USD 6.5 billion in 2026 before reaching USD 19.3 billion by 2036, advancing at an 11.5% CAGR over the assessment period. Standard classic formulation captures the leading position with 35.1% share in 2026 as recognizable flavor architectures lower adoption friction for mainstream consumers.
Commercial momentum accelerates as suppliers expand from single-serve premixed cocktails into multi-serve bottled options designed for home entertaining. In April 2026, Suntory Global Spirits launched two On The Rocks margarita expressions, introducing a bottled passion fruit margarita for home pouring alongside a canned sparkling watermelon margarita for portable occasions. This multi-format launch illustrates how distillers are extending core spirit formulas into distinct consumer occasions without compromising brand equity.
Key Market Trends & Insights
- Demand driver: Pour-ready service reduces preparation time while preserving recognizable cocktail recipes across varied occasions.
- By product type / variety: standard classic formulation is projected at 35.1% of 2026 revenue, as familiar flavor profiles lower adoption barriers.
- By packaging format: glass bottles (750 ml) are forecast to represent 39.0% in 2026, supported by multi-serve hosting utility.
- By distribution channel: off-trade retail is expected to hold 49.6% of 2026 sales, enabled by broad shelf discovery and multipack pricing.
- By price tier: mass market accounts for 46.9% of 2026 sales, underpinned by accessible pricing and frequent casual occasions.
Regional Highlights
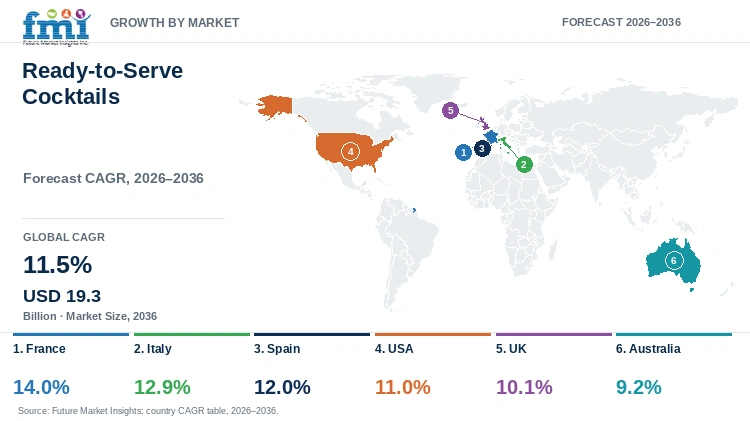
- Fastest-growing evaluated country: France, at 14.0% CAGR from 2026 to 2036.
- By country: Italy at 12.9%, Spain at 12.0%, the USA at 11.0%, the UK at 10.1%, and Australia at 9.2% follow through 2036.
Market Size & Forecast
Table 1: Market Size and Forecast for the Ready-to-Serve Cocktails Market (USD billion and CAGR percentage), 2025 to 2036
| Metric | Value |
|---|---|
| 2025 Market Size | USD 5.8 billion |
| Estimated Market Size in 2026 | USD 6.5 billion |
| Projected Market Size by 2036 | USD 19.3 billion |
| CAGR, 2026 to 2036 | 11.5% |
| Added Revenue, 2026 to 2036 | USD 12.8 billion |
In the FMI report, commercial conditions differ across the profiled countries owing to uneven alcohol excise structures, route-to-market distributor tiers, and retail shelf access. In February 2025, the Distilled Spirits Council of the United States documented that spirits-based ready-to-drink and premixed cocktails reached USD 2.8 billion in supplier revenue during 2024, expanding 26.7% year-over-year. Consequently, major retail chains are reallocating cooler space from traditional beer and malt-based hard seltzers toward authentic spirits-based cocktails that deliver superior gross margins per linear foot.
Occasion and Pour-Volume Sizing
Table 2: Occasion and Pour-Volume Sizing for the Ready-to-Serve Cocktails Market (USD billion and index values), mixed historical and forecast years from 2025 to 2036
| Metric | 2025 | 2026 | 2036 |
|---|---|---|---|
| Market size (USD billion) | 5.8 | 6.5 | 19.3 |
| Illustrative retail volume index | 100.0 | 108.5 | 242.0 |
| Value per indexed unit (USD) | 0.580 | 0.599 | 0.798 |
| Multi-serve purchase index | 100.0 | 109.0 | 255.0 |
Per Capita & Off-Trade Retail Sizing
Ready-to-serve cocktails translate bar craft into immediate off-trade retail convenience. Supermarkets and package liquor stores provide essential multi-tier shelf presence, allowing consumers to compare spirit bases and price points. The format benefits from planned home entertainment and casual hosting occasions where consumers seek bartender-quality serves without maintaining multiple inventory bottles.
Table 3: Per Capita and Off-Trade Indicators for the Ready-to-Serve Cocktails Market (USD), mixed historical and forecast years from 2025 to 2036
| Metric | 2025 | 2026 | 2036 |
|---|---|---|---|
| World population (billion) | 8.23 | 8.30 | 8.95 |
| Spend per capita (USD) | 0.70 | 0.78 | 2.16 |
| Spend per 1,000 people (USD) | 704.74 | 783.13 | 2,156.42 |
| Off-trade retail revenue (USD billion) | 2.88 | 3.22 | 9.57 |
Table 4: Packaging and Channel Spending Indicators for the Ready-to-Serve Cocktails Market (USD billion and percentages), 2026
| Metric | Value | Basis |
|---|---|---|
| Market size, 2026 | USD 6.5 billion | Report value |
| Glass bottles (750 ml) revenue | USD 2.5 billion | 39.0% share |
| Off-trade distribution revenue | USD 3.2 billion | 49.6% share |
| Mass-market tier revenue | USD 3.0 billion | 46.9% share |
Analyst Perspective
“Ready-to-serve cocktails are moving from occasional novelty toward planned retail portfolios. Over the years of analysis, brands that protect recipe consistency across bottle and can formats can widen occasions without weakening the core proposition.”
- Nandini Roy Choudhury, Principal Consultant, Future Market Insights.
How is the Ready-to-Serve Cocktails Market segmented?
Ready-to-serve cocktails are segmented by four primary commercial axes and region: product type / variety, packaging format, distribution channel, price tier, and region.
- By product type / variety: standard classic formulation; premium craft and artisanal; flavored or infused variant; low-alcohol or zero-ABV line.
- By packaging format: glass bottles (750 ml); aluminum cans and single-serve; bag-in-box and draught kegs; other formats.
- By distribution channel: off-trade retail supermarkets and liquor stores; on-trade bars, pubs and restaurants; direct-to-consumer e-commerce; other channels.
- By price tier: mass market or mainstream; premium tier; super-premium and luxury; other tiers.
- By region: North America; Latin America; Western Europe; Eastern Europe; East Asia; South Asia and Pacific; Middle East and Africa.
Why do classic recipes retain a notable product-type share?
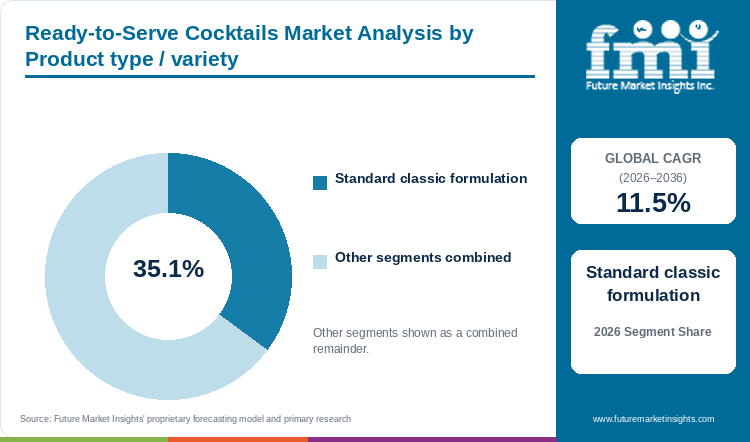
Standard classic formulation is projected to account for 35.1% of product type revenue in 2026, supported by consumer recipe familiarity and low trial risk.
Table 5: Product Type Share for the Ready-to-Serve Cocktails Market (percentage share), 2026
| Product Type / Variety | Share (2026) |
|---|---|
| Standard classic formulation | 35.1% |
| Other Segments Combined | 64.9%* |
| Total | 100.0% |
Table 6: Product Type Leadership and Market Growth for the Ready-to-Serve Cocktails Market (segment and CAGR percentage), 2026 to 2036
| Metric | Value |
|---|---|
| Global CAGR (2026 to 2036) | 11.5% |
| Leading Segment | Standard classic formulation |
FMI research indicates that standard classic formulations give retail buyers an intuitive shelf navigation system. Recipes such as margaritas, old fashioneds, cosmopolitans, and martinis carry decades of consumer recognition, minimizing the educational hurdle required at the initial point of purchase. Commercial producers focus on authentic spirit bases to ensure that packaged cocktails replicate on-premise sensory benchmarks across canned alcoholic beverages as well as bottled presentations.
- Standard classic formulation is projected at 35.1% as familiar recipes reduce trial risk in off-trade retail environments.
- In April 2026, Suntory Global Spirits expanded its On The Rocks brand with specialized passion fruit and sparkling watermelon margarita formulations.
What supports glass bottles as the preferred packaging format?
Glass bottles are estimated to hold 39.0% of packaging format revenue in 2026, driven by multi-serve pouring utility and premium shelf presentation.
A 750 ml glass bottle caters naturally to planned domestic entertaining and dinner hosting, allowing hosts to pour measured servings over ice without opening multiple individual cans. Glass maintains established visual cues associated with premium spirits while providing an impermeable barrier against oxygen ingress during extended retail holding. Developments in spirits packaging allow distillers to introduce embossed custom bottle designs that command premium retail shelf positioning.
- Glass bottles are estimated at 39.0% as multi-serve use supports gatherings and planned at-home hosting occasions.
- In May 2025, the European Container Glass Federation confirmed that premium glass container production for alcoholic beverages increased 3.2%, driven by demand for sustainable multi-serve formats.
How does off-trade retail remain central to cocktail distribution?
Off-trade is expected to lead distribution channel sales with 49.6% share in 2026, reflecting broad grocery discovery and planned home consumption.
Supermarkets, club stores, and licensed liquor retailers offer extensive shelf space where consumers can compare recipe variants, spirit origins, alcohol strengths, and pack formats side by side. Off-trade merchandising places ready-to-serve bottles adjacent to traditional spirits and chilled RTDs, capturing both planned entertaining purchases and spontaneous trial. Growth in craft spirits encourages grocery retailers to feature independent cocktail producers on regional endcaps.
- Off-trade is expected to hold 49.6% as grocery shelves support cross-category comparison and multipack purchasing.
- In April 2025, UK retail scanner data documented that off-trade ready-to-drink cocktail sales generated USD 0.76 billion, reflecting a 7.4% annual value expansion across major supermarket chains.
Which buying conditions keep mass-market products commercially relevant?
Mass market is forecast to represent 46.9% of price tier demand in 2026, owing to accessible price points and casual consumption occasions.
Mainstream price tiers democratize access to ready-to-serve cocktails, drawing casual drinkers who hesitate to spend on super-premium offerings. Competitive pricing enables promotional multipacks, high inventory turnover, and broad distribution across convenience retail. Mainstream brands frequently formulate low alcohol beverages to achieve attractive consumer price parity against premium beer lines.
- Mass market is forecast at 46.9% as accessible pricing supports recurring purchasing for casual home gatherings.
- In August 2025, Sazerac Company widened its value footprint as BuzzBallz Biggies expanded commercial shipments of 1.75-liter sharing formats across convenience store chains.
What are the drivers, restraints, and opportunities in the Ready-to-Serve Cocktails Market?
In the ready-to-serve cocktails market, the key driver is convenience, the key restraint is regulatory fragmentation, and the key opportunity is occasion-specific portfolio design.
- Driver: Pre-mixed recipes reduce preparation work and give consumers a repeatable serve at home or outdoors.
- Restraint: Alcohol duties, route-to-market rules, and packaging requirements differ by country and beverage base.
- Opportunity: Bottled multi-serve and canned single-serve lines let one brand address separate purchasing occasions.
Convenience Moves Beyond First Trial
Ready-to-serve cocktails eliminate complex recipe measurement, ingredient wastage, and bar tool cleanup from home entertaining. Consumer repeat purchasing relies heavily on whether the liquid delivers sensory fidelity comparable to a freshly shaken drink once chilled or poured over ice. In June 2025, DISCUS consumer tracking revealed that 55% of regular cocktail consumers purchased premixed cocktails to streamline at-home entertaining. Expanding lines of flavored alcoholic beverages provide formulators with established blending protocols that maintain stable botanical profiles over extended distribution cycles.
Duty and Distribution Limit Scale
According to FMI, ready-to-serve cocktails encounter significant fiscal friction because tax authorities categorize products differently based on whether they contain distilled spirits, malt, or wine. In October 2025, the European Commission published excise duty benchmarks demonstrating that spirits-based premixes face up to three times the excise tax burden of malt-based alternatives. These tariff discrepancies distort retail shelf pricing and restrict channel availability, particularly for craft producers navigating three-tier distribution structures.
Portfolio Architecture Opens New Occasions
Category expansion accelerates when distillers deploy packaging architecture tailored to distinct social settings. A 750 ml glass bottle anchors indoor holiday dinners, whereas single-serve aluminum cans penetrate outdoor festivals, picnics, and beach outings. In August 2026, Shanken News Daily reported that On The Rocks achieved 963,000 cases following a 22% annual volume surge, while large-format BuzzBallz Biggies rose 50% to 1.25 million cases. Integrating alcohol e commerce allows brand owners to offer curated discovery sample packs directly to registered adult consumers.
Ready-to-Serve Cocktails Market by Country (2026 to 2036)
As per the analysis from FMI, country demand develops unevenly across profiled nations. France and Italy combine historic aperitif traditions with expanding retail premix formats, while the USA anchors global volume through established spirit distribution pipelines. Spain, the UK, and Australia provide expanding retail environments for lower-alcohol lines and portable outdoor formats.
Table 7: Country CAGR and Primary Growth Levers for the Ready-to-Serve Cocktails Market (CAGR percentage and operational drivers), 2026 to 2036
| Country | CAGR (2026 to 2036) | Primary Growth Lever |
|---|---|---|
| France | 14.0% | Premium aperitif use and lower-alcohol product expansion |
| Italy | 12.9% | Spritz familiarity and established vermouth portfolios |
| Spain | 12.0% | Hospitality-led cocktail discovery and tourism demand |
| USA | 11.0% | Large spirits distribution base and multi-format launches |
| UK | 10.1% | Off-trade RTD growth and moderation-led selection |
| Australia | 9.2% | Outdoor occasions and chilled single-serve formats |
How do country outlooks differ through the forecast period?
Growth trajectories vary between the profiled countries as established drinking rituals and retail licensing rules shape consumer discovery:
- French consumers integrate bottled aperitifs into pre-dinner entertaining, supporting premium specialty retail placement.
- Italian producers translate vermouth and bitter spritz familiarity into pre-packaged dining options.
- Spanish venues utilize warm-weather tourism and lively outdoor hospitality to encourage trial of bottled mixes.
- United States retailers leverage national spirits distribution networks to support multi-pack retail displays.
- United Kingdom grocers dedicate expanding cooler bay footage to canned cocktails within lunchtime meal deals.
- Australian consumers favor portable cans for outdoor coastal recreation, balancing high federal excise duties.
Full report country CAGRs cover: North America; Latin America; Western Europe; Eastern Europe; East Asia; South Asia and Pacific; Middle East and Africa.
France Ready-to-Serve Cocktails Market Outlook (2026 to 2036)
France is projected to grow at 14.0% CAGR through 2036, supported by aperitif-led consumption and premium grocery merchandising. In May 2025, the Fédération Française des Spiritueux reported a 4.1% rise in domestic aperitif spirit shipments, driven by consumer interest in pre-dinner cocktails. Packaged spritzes and negronis align naturally with traditional pre-meal gatherings. However, producers must clearly differentiate spirit cocktails from traditional fortified aperitif wines that dominate local shelves. Suppliers are prioritizing specialty wine merchants before expanding into national hypermarket banners.
- Key takeaway: In France, deep-rooted aperitif culture and expanding low-alcohol options create strong retail momentum for premium bottled cocktails.
Italy Ready-to-Serve Cocktails Market Outlook (2026 to 2036)
Italy’s ready-to-serve cocktails outlook is anticipated to advance at 12.9% CAGR over the assessment period, underpinned by widespread familiarity with vermouth and spritz recipes. In July 2025, Federvini documented that Italian premixed and aromatized wine beverage sales expanded 5.8% across domestic retail channels. Established domestic distillers of aperitif and vermouth can readily convert recognized recipes into pour-ready glass bottles. Stiff competition from freshly mixed bar aperitivos remains a commercial hurdle, compelling manufacturers to safeguard effervescence and botanical aromas in sealed containers.
- Key takeaway: In Italy, widespread spritz and vermouth familiarity provides a seamless bridge from on-premise recipes to bottled ready-to-serve formats.
Spain Ready-to-Serve Cocktails Market Outlook (2026 to 2036)
Ready-to-serve cocktail demand in Spain is forecast to rise at 12.0% CAGR over the forecast period, influenced by vibrant hospitality dining and seasonal tourism. In June 2025, Espirituosos España reported that spirits consumption in hospitality establishments increased 3.4%, supported by record international tourist arrivals. High vacation foot traffic encourages quick-serve coastal venues and holiday rentals to stock chilled single-serve cans. Marked seasonal sales drops during winter months present an operational challenge, prompting suppliers to market classic year-round whiskey and gin formulas.
- Key takeaway: In Spain, tourism exposure and outdoor dining habits drive summer trial while year-round classic recipes stabilize retail turnover.
USA Ready-to-Serve Cocktails Market Outlook (2026 to 2036)
Adoption of ready-to-serve cocktails in the USA is estimated to expand at 11.0% CAGR through 2036, enabled by national distributor footprints and prominent off-trade positioning. In January 2026, the U.S. Alcohol and Tobacco Tax and Trade Bureau recorded that domestic premixed cocktail production reached 48.2 million proof gallons during 2025. The presence of large liquor chains allows suppliers to merchandise 750 ml bottles alongside portable slim cans. Complex state-by-state franchise laws and divergent excise rates create distribution bottlenecks that favor scaled multi-brand conglomerates.
- Key takeaway: In the USA, extensive distributor networks and large-format retail channels accelerate multi-serve bottle and portable can adoption.
UK Ready-to-Serve Cocktails Market Outlook (2026 to 2036)
The UK ready-to-serve cocktails sector is projected to record 10.1% CAGR during the assessment period, supported by off-trade expansion and moderation-oriented buying habits. In September 2025, the Wine and Spirit Trade Association reported that retail sales of premixed spirit drinks grew 6.8% in volume across British grocery retailers. Supermarket meal deals allocate significant shelf space to chilled cans for immediate consumption. However, aggressive shelf competition and statutory alcohol duty escalators squeeze margins, forcing brand owners to optimize recipe formulations around lower tax bands.
- Key takeaway: In the UK, structured supermarket distribution and moderation trends favor convenient single-serve and reduced-alcohol cocktail expressions.
Australia Ready-to-Serve Cocktails Market Outlook (2026 to 2036)
In Australia, ready-to-serve cocktail demand is predicted to advance at 9.2% CAGR through 2036, supported by an outdoor social lifestyle and demand for portable formats. In August 2025, Spirits & Cocktails Australia noted that premixed spirits account for over 20% of domestic alcohol retail volumes, benefiting from beverage cans packaging in social settings. Severe federal alcohol excise duties indexed biannually elevate retail prices, driving consumers toward value-oriented multipacks and sessionable lower-strength serves.
- Key takeaway: In Australia, outdoor social occasions favor chilled single-serve cans while high alcohol excise rates encourage lower-ABV formulation strategies.
Who are the notable companies in the Ready-to-Serve Cocktails Market?
Diageo plc, Pernod Ricard SA, Suntory Global Spirits, Bacardi Limited, Brown-Forman Corporation, Campari Group, Sazerac Company, and Proximo Spirits are notable companies operating in this market.
FMI data suggests that competition divides between global spirits conglomerates and agile ready-to-serve specialists. Conglomerates leverage global parent brands to launch premixed cocktails with instant shelf recognition. In contrast, specialist producers differentiate through novel recipe blending, sleek can aesthetics, and direct social media engagement. Success requires robust distributor relationships and consistent liquid stability after extended transit.
- Global spirits portfolios: Diageo, Pernod Ricard, Bacardi, Brown-Forman, and Campari Group extend established liquor trademarks into convenient formats.
- Ready-to-serve specialists: Suntory Global Spirits develops On The Rocks across premium bottled and canned single-serve lines.
- Scaled value and convenience: Sazerac and Proximo Spirits capture large-format sharing bottles and accessible party packs.
Competitive Benchmarking: Ready-to-Serve Cocktails Market
Table 8: Competitive Benchmarking for the Ready-to-Serve Cocktails Market (qualitative capability ratings), 2026
| Company | Portfolio breadth | Packaging formats | Retail access | Geographic reach |
|---|---|---|---|---|
| Diageo plc | High | High | High | High |
| Pernod Ricard SA | High | Medium | High | High |
| Suntory Global Spirits | High | High | High | High |
| Bacardi Limited | High | High | High | High |
| Brown-Forman Corporation | Medium | Medium | High | High |
| Campari Group | Medium | Medium | High | High |
| Sazerac Company | High | High | High | Medium |
| Proximo Spirits | Medium | High | High | Medium |
Key Developments in the Ready-to-Serve Cocktails Market
- In April 2026, Suntory Global Spirits launched On The Rocks Passion Fruit Margarita and Sparkling Watermelon Margarita across bottle and can formats.
- In February 2026, On The Rocks introduced Jim Beam Whiskey Sour in 375 ml and 750 ml bottles across national retail channels.
- In January 2025, On The Rocks Premium Cocktails launched the Lemon Drop Martini, crafted with EFFEN Vodka, as a permanent nationwide addition available in 375 ml and 750 ml ready-to-serve bottles.
- In August 2025, BuzzBallz Biggies solidified Sazerac's presence in high-volume off-trade aisles through 1.75-liter sharing containers.
Key Players in the Ready-to-Serve Cocktails Market
Global Spirits and Cocktail Platforms
- Diageo plc
- Pernod Ricard SA
- Bacardi Limited
- Brown-Forman Corporation
- Campari Group
Ready-to-Serve and Premixed Cocktail Platforms
- Suntory Global Spirits
- Sazerac Company
- Proximo Spirits
Ready-to-Serve Cocktails Market - Report Scope
Table 9: Report Scope for the Ready-to-Serve Cocktails Market (coverage fields and definitions), 2026 to 2036
| Coverage field | Report scope |
|---|---|
| Market breakdown | Product type / variety; packaging format; distribution channel; price tier |
| Quantitative units | USD billion |
| Market definition | Includes supplier revenue from premixed cocktails sold ready for pouring or immediate consumption. Excludes cocktail ingredients and freshly mixed on-trade drinks. |
| Regions covered | North America; Latin America; Western Europe; Eastern Europe; East Asia; South Asia and Pacific; Middle East and Africa |
| Countries covered | France, Italy, Spain, USA, UK, Australia, and additional countries in the full report |
| Key companies covered | Diageo plc; Pernod Ricard SA; Suntory Global Spirits; Bacardi Limited; Brown-Forman Corporation; Campari Group; Sazerac Company; Proximo Spirits |
| Forecast period | 2026 to 2036 |
| Approach | Primary and secondary research with market triangulation. |
As noted by FMI, the market covers commercial supplier revenue from packaged cocktails and excludes whole cocktail mixer syrups, bulk bulk keg spirits, and unblended home ingredients.
Ready-to-Serve Cocktails Market - Research Methodology
Table 10: Research Methodology for the Ready-to-Serve Cocktails Market (research methods and approach), 2026 edition
| Method | Approach |
|---|---|
| Primary Research | Analysts gathered input from manufacturers, service providers, technology developers, distributors, end users, procurement teams, and subject-matter experts. Interviews examined purchase decisions, product evaluation, adoption barriers, pricing, and commercial support. |
| Desk Research | Desk research covered government statistics, regulatory publications, trade data, industry associations, company filings, product information, and official corporate announcements. Sources were reviewed for relevance, date, geographic coverage, and consistency with the market scope. |
| Market Sizing and Forecasting | The sizing framework combined the baseline value with historical performance, segment structure, pricing and volume indicators, adoption levels, company participation, and country-level demand conditions. Segment and regional estimates were reconciled before the final total was calculated. |
| Data Validation | Estimates were checked against public data, company activity, trade patterns, and findings from primary interviews. Adjacent categories, unsupported claims, overlapping revenues, and activities outside the defined market were excluded. |
Ready-to-Serve Cocktails Market by Segments
Ready-to-Serve Cocktails Market segmented by Product type / variety:
- Standard classic formulation
- Premium craft and artisanal
- Flavored or infused variant
- Low-alcohol or zero-ABV line
Ready-to-Serve Cocktails Market segmented by Packaging format:
- Glass bottles (750 ml)
- Aluminum cans and single-serve
- Bag-in-box and draught kegs
- Other formats
Ready-to-Serve Cocktails Market segmented by Distribution channel:
- Off-trade retail supermarkets and liquor stores
- On-trade bars, pubs and restaurants
- Direct-to-consumer e-commerce
- Other channels
Ready-to-Serve Cocktails Market segmented by Price tier:
- Mass market or mainstream
- Premium tier
- Super-premium and luxury
- Other tiers
Ready-to-Serve Cocktails Market by Region
- North America
- United States
- Canada
- Latin America
- Brazil
- Mexico
- Argentina
- Chile
- Western Europe
- Germany
- France
- United Kingdom
- Italy
- Spain
- Benelux
- Nordics
- Eastern Europe
- Poland
- Czech Republic
- Romania
- Hungary
- East Asia
- Japan
- South Korea
- South Asia and Pacific
- ASEAN
- Australia and New Zealand
- Middle East and Africa
- GCC Countries
- South Africa
- Türkiye
- Israel
Research Sources and Bibliography
- [1] Suntory Global Spirits. (2026, April 21). On The Rocks launches two new ready-to-drink expressions: Passion Fruit Margarita and Sparkling Watermelon Margarita. Corporate Press Releases.
- [2] Distilled Spirits Council of the United States. (2025, February 5). Economic Briefing: U.S. distilled spirits and premixed cocktail market review.
- [3] Suntory Global Spirits. (2026). On The Rocks portfolio architecture and seasonal expressions release. Product Documentation.
- [4] European Container Glass Federation (FEVE). (2025, May 14). European glass packaging production statistics for food and beverage containers.
- [5] Agile Media Ltd. (2025, April). UK ready-to-drink category sales and off-trade value growth. Drinks Retailing News Reports.
- [6] Sazerac Company. (2025, August 18). BuzzBallz Biggies 1.75L national retail expansion announcement. Sazerac Press Room.
- [7] Distilled Spirits Council of the United States. (2025, June 12). Consumer sentiment and spirits-based premixed cocktail consumption trends.
- [8] European Commission. (2025, October 22). Excise duty tables on alcoholic beverages across EU Member States. Directorate-General for Taxation and Customs Union.
- [9] Shanken News Daily. (2026, August 3). Ready-to-serve segment holds ample promise, marketers say. Impact Databank Reports.
- [10] Fédération Française des Spiritueux. (2025, May 27). Annual review of French spirits market and aperitif trends.
- [11] Federvini. (2025, July 16). Italian wine and spirits production and commercialization report 2025.
- [12] Espirituosos España. (2025, June 19). Annual economic report: Spirits consumption in the Spanish hospitality sector.
- [13] Alcohol and Tobacco Tax and Trade Bureau (TTB). (2026, January 28). Monthly statistical release: Distilled spirits and premixed beverage production data.
- [14] Wine and Spirit Trade Association. (2025, September 24). WSTA market report: Off-trade RTD and spirits consumption trends.
- [15] Spirits & Cocktails Australia. (2025, August 20). Annual market review: Premixed alcoholic beverages and excise benchmarks in Australia.
This bibliography is provided for reader reference. The full report contains the complete reference list and detailed citations.
This Report Answers
- How large is the ready-to-serve cocktails market in 2026?
- What market value is forecast for ready-to-serve cocktails by 2036?
- Which product type holds a notable share in 2026?
- Why do glass bottles remain relevant to packaged cocktail sales?
- Which country has a notable growth outlook through 2036?
- Which companies participate in ready-to-serve cocktails today?
Table of Content
- Key Takeaways
- Market Size and CAGR
- Top Growth Driver
- Fastest Growing Segment
- Leading Region
- Key Companies
- Emerging Opportunities
- Executive Summary
- Global Market Outlook
- Demand-side Trends
- Supply-side Trends
- Technology Roadmap Analysis
- Analysis and Recommendations
- Analyst Perspective (What is happening? Why now? What should investors know?)
- Key Questions Answered
- How large is the market?
- What is the CAGR?
- What are key trends?
- Which region dominates?
- Who are the leaders?
Read More...
- Market Overview
- Market Coverage / Taxonomy
- Market Definition / Scope / Limitations
- Research Methodology
- Chapter Orientation
- Analytical Lens and Working Hypotheses
- Market Structure, Signals, and Trend Drivers
- Benchmarking and Cross-market Comparability
- Market Sizing, Forecasting, and Opportunity Mapping
- Research Design and Evidence Framework
- Desk Research Programme (Secondary Evidence)
- Expert Input and Fieldwork (Primary Evidence)
- Tooling, Models, and Reference Databases
- Data Engineering and Model Build
- Quality Assurance and Audit Trail
- Market Background
- Market Dynamics (Drivers, Restraints, Opportunity, Trends)
- Scenario Forecast (Optimistic, Likely, Conservative)
- Impact Analysis
- AI Impact
- Sustainability Impact
- Regulatory Impact
- Technology Impact
- Consumer / Buyer Analysis
- Purchase Drivers
- Adoption Barriers
- Buyer Journey
- Opportunity Map Analysis
- Product Life Cycle Analysis
- Supply Chain Analysis
- Investment Feasibility Matrix
- Value Chain Analysis
- PESTLE and Porter's Analysis
- Regulatory Landscape
- Regional Parent Market Outlook
- Production and Consumption Statistics
- Import and Export Statistics
- Global Market Analysis and Forecast, 2021 to 2036
- Historical Market Size Value (USD Billion) Analysis, 2021 to 2025
- Current and Future Market Size Value (USD Billion) Projections, 2026 to 2036
- Y-o-Y Growth Trend Analysis
- Absolute $ Opportunity Analysis
- Global Market Pricing Analysis, 2021 to 2036
- Global Market Analysis and Forecast, By Product type / variety, 2021 to 2036
- Introduction / Key Findings
- Historical Market Size Value (USD Billion) Analysis By Product type / variety, 2021 to 2025
- Current and Future Market Size Value (USD Billion) Analysis and Forecast By Product type / variety, 2026 to 2036
- Standard classic formulation
- Premium craft and artisanal
- Flavored or infused variant
- Low-alcohol or zero-ABV line
- Y-o-Y Growth Trend Analysis By Product type / variety, 2021 to 2025
- Absolute $ Opportunity Analysis By Product type / variety, 2026 to 2036
- Global Market Analysis and Forecast, By Packaging format, 2021 to 2036
- Introduction / Key Findings
- Historical Market Size Value (USD Billion) Analysis By Packaging format, 2021 to 2025
- Current and Future Market Size Value (USD Billion) Analysis and Forecast By Packaging format, 2026 to 2036
- Glass bottles (750 ml)
- Aluminum cans and single-serve
- Bag-in-box and draught kegs
- Other formats
- Y-o-Y Growth Trend Analysis By Packaging format, 2021 to 2025
- Absolute $ Opportunity Analysis By Packaging format, 2026 to 2036
- Global Market Analysis and Forecast, By Distribution channel, 2021 to 2036
- Introduction / Key Findings
- Historical Market Size Value (USD Billion) Analysis By Distribution channel, 2021 to 2025
- Current and Future Market Size Value (USD Billion) Analysis and Forecast By Distribution channel, 2026 to 2036
- Off-trade retail supermarkets and liquor stores
- On-trade bars, pubs and restaurants
- Direct-to-consumer e-commerce
- Other channels
- Y-o-Y Growth Trend Analysis By Distribution channel, 2021 to 2025
- Absolute $ Opportunity Analysis By Distribution channel, 2026 to 2036
- Global Market Analysis and Forecast, By Price tier, 2021 to 2036
- Introduction / Key Findings
- Historical Market Size Value (USD Billion) Analysis By Price tier, 2021 to 2025
- Current and Future Market Size Value (USD Billion) Analysis and Forecast By Price tier, 2026 to 2036
- Mass market or mainstream
- Premium tier
- Super-premium and luxury
- Other tiers
- Y-o-Y Growth Trend Analysis By Price tier, 2021 to 2025
- Absolute $ Opportunity Analysis By Price tier, 2026 to 2036
- Global Market Analysis and Forecast, By Region, 2021 to 2036
- Introduction
- Historical Market Size Value (USD Billion) Analysis By Region, 2021 to 2025
- Current Market Size Value (USD Billion) Analysis and Forecast By Region, 2026 to 2036
- North America
- Latin America
- Western Europe
- Eastern Europe
- East Asia
- South Asia and Pacific
- Middle East and Africa
- Market Attractiveness Analysis By Region
- North America Market Analysis and Forecast, By Country, 2021 to 2036
- Historical Market Size Value (USD Billion) Trend Analysis By Market Taxonomy, 2021 to 2025
- Market Size Value (USD Billion) Forecast By Market Taxonomy, 2026 to 2036
- By Country
- United States
- Canada
- By Product type / variety
- By Packaging format
- By Distribution channel
- By Price tier
- By Country
- Market Attractiveness Analysis
- By Country
- By Product type / variety
- By Packaging format
- By Distribution channel
- By Price tier
- Key Takeaways
- Latin America Market Analysis and Forecast, By Country
- Historical Market Size Value (USD Billion) Trend Analysis By Market Taxonomy, 2021 to 2025
- Market Size Value (USD Billion) Forecast By Market Taxonomy, 2026 to 2036
- By Country
- Brazil
- Mexico
- Argentina
- Chile
- By Product type / variety
- By Packaging format
- By Distribution channel
- By Price tier
- By Country
- Market Attractiveness Analysis
- By Country
- By Product type / variety
- By Packaging format
- By Distribution channel
- By Price tier
- Key Takeaways
- Western Europe Market Analysis and Forecast, By Country
- Historical Market Size Value (USD Billion) Trend Analysis By Market Taxonomy, 2021 to 2025
- Market Size Value (USD Billion) Forecast By Market Taxonomy, 2026 to 2036
- By Country
- Germany
- France
- United Kingdom
- Italy
- Spain
- Benelux
- Nordics
- By Product type / variety
- By Packaging format
- By Distribution channel
- By Price tier
- By Country
- Market Attractiveness Analysis
- By Country
- By Product type / variety
- By Packaging format
- By Distribution channel
- By Price tier
- Key Takeaways
- Eastern Europe Market Analysis and Forecast, By Country
- Historical Market Size Value (USD Billion) Trend Analysis By Market Taxonomy, 2021 to 2025
- Market Size Value (USD Billion) Forecast By Market Taxonomy, 2026 to 2036
- By Country
- Poland
- Czech Republic
- Romania
- Hungary
- By Product type / variety
- By Packaging format
- By Distribution channel
- By Price tier
- By Country
- Market Attractiveness Analysis
- By Country
- By Product type / variety
- By Packaging format
- By Distribution channel
- By Price tier
- Key Takeaways
- East Asia Market Analysis and Forecast, By Country
- Historical Market Size Value (USD Billion) Trend Analysis By Market Taxonomy, 2021 to 2025
- Market Size Value (USD Billion) Forecast By Market Taxonomy, 2026 to 2036
- By Country
- Japan
- South Korea
- By Product type / variety
- By Packaging format
- By Distribution channel
- By Price tier
- By Country
- Market Attractiveness Analysis
- By Country
- By Product type / variety
- By Packaging format
- By Distribution channel
- By Price tier
- Key Takeaways
- South Asia and Pacific Market Analysis and Forecast, By Country
- Historical Market Size Value (USD Billion) Trend Analysis By Market Taxonomy, 2021 to 2025
- Market Size Value (USD Billion) Forecast By Market Taxonomy, 2026 to 2036
- By Country
- ASEAN
- Australia and New Zealand
- By Product type / variety
- By Packaging format
- By Distribution channel
- By Price tier
- By Country
- Market Attractiveness Analysis
- By Country
- By Product type / variety
- By Packaging format
- By Distribution channel
- By Price tier
- Key Takeaways
- Middle East and Africa Market Analysis and Forecast, By Country
- Historical Market Size Value (USD Billion) Trend Analysis By Market Taxonomy, 2021 to 2025
- Market Size Value (USD Billion) Forecast By Market Taxonomy, 2026 to 2036
- By Country
- GCC Countries
- South Africa
- Türkiye
- Israel
- By Product type / variety
- By Packaging format
- By Distribution channel
- By Price tier
- By Country
- Market Attractiveness Analysis
- By Country
- By Product type / variety
- By Packaging format
- By Distribution channel
- By Price tier
- Key Takeaways
- Key Countries Market Analysis
- United States
- Pricing Analysis
- Market Share Analysis, 2025
- By Product type / variety
- By Packaging format
- By Distribution channel
- By Price tier
- Canada
- Pricing Analysis
- Market Share Analysis, 2025
- By Product type / variety
- By Packaging format
- By Distribution channel
- By Price tier
- Mexico
- Pricing Analysis
- Market Share Analysis, 2025
- By Product type / variety
- By Packaging format
- By Distribution channel
- By Price tier
- Brazil
- Pricing Analysis
- Market Share Analysis, 2025
- By Product type / variety
- By Packaging format
- By Distribution channel
- By Price tier
- Chile
- Pricing Analysis
- Market Share Analysis, 2025
- By Product type / variety
- By Packaging format
- By Distribution channel
- By Price tier
- Germany
- Pricing Analysis
- Market Share Analysis, 2025
- By Product type / variety
- By Packaging format
- By Distribution channel
- By Price tier
- United Kingdom
- Pricing Analysis
- Market Share Analysis, 2025
- By Product type / variety
- By Packaging format
- By Distribution channel
- By Price tier
- Italy
- Pricing Analysis
- Market Share Analysis, 2025
- By Product type / variety
- By Packaging format
- By Distribution channel
- By Price tier
- Spain
- Pricing Analysis
- Market Share Analysis, 2025
- By Product type / variety
- By Packaging format
- By Distribution channel
- By Price tier
- France
- Pricing Analysis
- Market Share Analysis, 2025
- By Product type / variety
- By Packaging format
- By Distribution channel
- By Price tier
- ASEAN
- Pricing Analysis
- Market Share Analysis, 2025
- By Product type / variety
- By Packaging format
- By Distribution channel
- By Price tier
- Australia and New Zealand
- Pricing Analysis
- Market Share Analysis, 2025
- By Product type / variety
- By Packaging format
- By Distribution channel
- By Price tier
- Japan
- Pricing Analysis
- Market Share Analysis, 2025
- By Product type / variety
- By Packaging format
- By Distribution channel
- By Price tier
- South Korea
- Pricing Analysis
- Market Share Analysis, 2025
- By Product type / variety
- By Packaging format
- By Distribution channel
- By Price tier
- Poland
- Pricing Analysis
- Market Share Analysis, 2025
- By Product type / variety
- By Packaging format
- By Distribution channel
- By Price tier
- Hungary
- Pricing Analysis
- Market Share Analysis, 2025
- By Product type / variety
- By Packaging format
- By Distribution channel
- By Price tier
- Türkiye
- Pricing Analysis
- Market Share Analysis, 2025
- By Product type / variety
- By Packaging format
- By Distribution channel
- By Price tier
- South Africa
- Pricing Analysis
- Market Share Analysis, 2025
- By Product type / variety
- By Packaging format
- By Distribution channel
- By Price tier
- Australia
- Pricing Analysis
- Market Share Analysis, 2025
- By Product type / variety
- By Packaging format
- By Distribution channel
- By Price tier
- United States
- Market Structure Analysis
- Competition Dashboard
- Competition Benchmarking
- Market Share Analysis of Top Players
- By Regional
- By Product type / variety
- By Packaging format
- By Distribution channel
- By Price tier
- Emerging Startups
- Innovation Benchmarking
- Competition Analysis
- Competition Deep Dive
- Diageo plc
- Overview
- Product Portfolio
- Profitability by Market Segments
- Sales Footprint
- Strategy Overview
- Marketing Strategy
- Product Strategy
- Channel Strategy
- Pernod Ricard SA
- Suntory Global Spirits
- Bacardi Limited
- Brown-Forman Corporation
- Campari Group
- Sazerac Company
- Proximo Spirits
- Diageo plc
- Case Studies
- Success Stories
- Recent Developments
- Competition Deep Dive
- Assumptions & Acronyms Used
List of Tables
- Table 1: Global Market Value (USD Billion) Forecast by Region, 2021 to 2036
- Table 2: Global Market Value (USD Billion) Forecast by Product type / variety, 2021 to 2036
- Table 3: Global Market Value (USD Billion) Forecast by Packaging format, 2021 to 2036
- Table 4: Global Market Value (USD Billion) Forecast by Distribution channel, 2021 to 2036
- Table 5: Global Market Value (USD Billion) Forecast by Price tier, 2021 to 2036
- Table 6: North America Market Value (USD Billion) Forecast by Country, 2021 to 2036
- Table 7: North America Market Value (USD Billion) Forecast by Product type / variety, 2021 to 2036
- Table 8: North America Market Value (USD Billion) Forecast by Packaging format, 2021 to 2036
- Table 9: North America Market Value (USD Billion) Forecast by Distribution channel, 2021 to 2036
- Table 10: North America Market Value (USD Billion) Forecast by Price tier, 2021 to 2036
- Table 11: Latin America Market Value (USD Billion) Forecast by Country, 2021 to 2036
- Table 12: Latin America Market Value (USD Billion) Forecast by Product type / variety, 2021 to 2036
- Table 13: Latin America Market Value (USD Billion) Forecast by Packaging format, 2021 to 2036
- Table 14: Latin America Market Value (USD Billion) Forecast by Distribution channel, 2021 to 2036
- Table 15: Latin America Market Value (USD Billion) Forecast by Price tier, 2021 to 2036
- Table 16: Western Europe Market Value (USD Billion) Forecast by Country, 2021 to 2036
- Table 17: Western Europe Market Value (USD Billion) Forecast by Product type / variety, 2021 to 2036
- Table 18: Western Europe Market Value (USD Billion) Forecast by Packaging format, 2021 to 2036
- Table 19: Western Europe Market Value (USD Billion) Forecast by Distribution channel, 2021 to 2036
- Table 20: Western Europe Market Value (USD Billion) Forecast by Price tier, 2021 to 2036
- Table 21: Eastern Europe Market Value (USD Billion) Forecast by Country, 2021 to 2036
- Table 22: Eastern Europe Market Value (USD Billion) Forecast by Product type / variety, 2021 to 2036
- Table 23: Eastern Europe Market Value (USD Billion) Forecast by Packaging format, 2021 to 2036
- Table 24: Eastern Europe Market Value (USD Billion) Forecast by Distribution channel, 2021 to 2036
- Table 25: Eastern Europe Market Value (USD Billion) Forecast by Price tier, 2021 to 2036
- Table 26: East Asia Market Value (USD Billion) Forecast by Country, 2021 to 2036
- Table 27: East Asia Market Value (USD Billion) Forecast by Product type / variety, 2021 to 2036
- Table 28: East Asia Market Value (USD Billion) Forecast by Packaging format, 2021 to 2036
- Table 29: East Asia Market Value (USD Billion) Forecast by Distribution channel, 2021 to 2036
- Table 30: East Asia Market Value (USD Billion) Forecast by Price tier, 2021 to 2036
- Table 31: South Asia and Pacific Market Value (USD Billion) Forecast by Country, 2021 to 2036
- Table 32: South Asia and Pacific Market Value (USD Billion) Forecast by Product type / variety, 2021 to 2036
- Table 33: South Asia and Pacific Market Value (USD Billion) Forecast by Packaging format, 2021 to 2036
- Table 34: South Asia and Pacific Market Value (USD Billion) Forecast by Distribution channel, 2021 to 2036
- Table 35: South Asia and Pacific Market Value (USD Billion) Forecast by Price tier, 2021 to 2036
- Table 36: Middle East and Africa Market Value (USD Billion) Forecast by Country, 2021 to 2036
- Table 37: Middle East and Africa Market Value (USD Billion) Forecast by Product type / variety, 2021 to 2036
- Table 38: Middle East and Africa Market Value (USD Billion) Forecast by Packaging format, 2021 to 2036
- Table 39: Middle East and Africa Market Value (USD Billion) Forecast by Distribution channel, 2021 to 2036
- Table 40: Middle East and Africa Market Value (USD Billion) Forecast by Price tier, 2021 to 2036
List of Figures
- Figure 1: Global Market Pricing Analysis
- Figure 2: Global Market Value (USD Billion) Forecast 2021-2036
- Figure 3: Global Market Value Share and BPS Analysis by Product type / variety, 2026 and 2036
- Figure 4: Global Market Y-o-Y Growth Comparison by Product type / variety, 2026-2036
- Figure 5: Global Market Attractiveness Analysis by Product type / variety
- Figure 6: Global Market Value Share and BPS Analysis by Packaging format, 2026 and 2036
- Figure 7: Global Market Y-o-Y Growth Comparison by Packaging format, 2026-2036
- Figure 8: Global Market Attractiveness Analysis by Packaging format
- Figure 9: Global Market Value Share and BPS Analysis by Distribution channel, 2026 and 2036
- Figure 10: Global Market Y-o-Y Growth Comparison by Distribution channel, 2026-2036
- Figure 11: Global Market Attractiveness Analysis by Distribution channel
- Figure 12: Global Market Value Share and BPS Analysis by Price tier, 2026 and 2036
- Figure 13: Global Market Y-o-Y Growth Comparison by Price tier, 2026-2036
- Figure 14: Global Market Attractiveness Analysis by Price tier
- Figure 15: Global Market Value (USD Billion) Share and BPS Analysis by Region, 2026 and 2036
- Figure 16: Global Market Y-o-Y Growth Comparison by Region, 2026-2036
- Figure 17: Global Market Attractiveness Analysis by Region
- Figure 18: North America Market Incremental Dollar Opportunity, 2026-2036
- Figure 19: Latin America Market Incremental Dollar Opportunity, 2026-2036
- Figure 20: Western Europe Market Incremental Dollar Opportunity, 2026-2036
- Figure 21: Eastern Europe Market Incremental Dollar Opportunity, 2026-2036
- Figure 22: East Asia Market Incremental Dollar Opportunity, 2026-2036
- Figure 23: South Asia and Pacific Market Incremental Dollar Opportunity, 2026-2036
- Figure 24: Middle East and Africa Market Incremental Dollar Opportunity, 2026-2036
- Figure 25: North America Market Value Share and BPS Analysis by Country, 2026 and 2036
- Figure 26: North America Market Value Share and BPS Analysis by Product type / variety, 2026 and 2036
- Figure 27: North America Market Y-o-Y Growth Comparison by Product type / variety, 2026-2036
- Figure 28: North America Market Attractiveness Analysis by Product type / variety
- Figure 29: North America Market Value Share and BPS Analysis by Packaging format, 2026 and 2036
- Figure 30: North America Market Y-o-Y Growth Comparison by Packaging format, 2026-2036
- Figure 31: North America Market Attractiveness Analysis by Packaging format
- Figure 32: North America Market Value Share and BPS Analysis by Distribution channel, 2026 and 2036
- Figure 33: North America Market Y-o-Y Growth Comparison by Distribution channel, 2026-2036
- Figure 34: North America Market Attractiveness Analysis by Distribution channel
- Figure 35: North America Market Value Share and BPS Analysis by Price tier, 2026 and 2036
- Figure 36: North America Market Y-o-Y Growth Comparison by Price tier, 2026-2036
- Figure 37: North America Market Attractiveness Analysis by Price tier
- Figure 38: Latin America Market Value Share and BPS Analysis by Country, 2026 and 2036
- Figure 39: Latin America Market Value Share and BPS Analysis by Product type / variety, 2026 and 2036
- Figure 40: Latin America Market Y-o-Y Growth Comparison by Product type / variety, 2026-2036
- Figure 41: Latin America Market Attractiveness Analysis by Product type / variety
- Figure 42: Latin America Market Value Share and BPS Analysis by Packaging format, 2026 and 2036
- Figure 43: Latin America Market Y-o-Y Growth Comparison by Packaging format, 2026-2036
- Figure 44: Latin America Market Attractiveness Analysis by Packaging format
- Figure 45: Latin America Market Value Share and BPS Analysis by Distribution channel, 2026 and 2036
- Figure 46: Latin America Market Y-o-Y Growth Comparison by Distribution channel, 2026-2036
- Figure 47: Latin America Market Attractiveness Analysis by Distribution channel
- Figure 48: Latin America Market Value Share and BPS Analysis by Price tier, 2026 and 2036
- Figure 49: Latin America Market Y-o-Y Growth Comparison by Price tier, 2026-2036
- Figure 50: Latin America Market Attractiveness Analysis by Price tier
- Figure 51: Western Europe Market Value Share and BPS Analysis by Country, 2026 and 2036
- Figure 52: Western Europe Market Value Share and BPS Analysis by Product type / variety, 2026 and 2036
- Figure 53: Western Europe Market Y-o-Y Growth Comparison by Product type / variety, 2026-2036
- Figure 54: Western Europe Market Attractiveness Analysis by Product type / variety
- Figure 55: Western Europe Market Value Share and BPS Analysis by Packaging format, 2026 and 2036
- Figure 56: Western Europe Market Y-o-Y Growth Comparison by Packaging format, 2026-2036
- Figure 57: Western Europe Market Attractiveness Analysis by Packaging format
- Figure 58: Western Europe Market Value Share and BPS Analysis by Distribution channel, 2026 and 2036
- Figure 59: Western Europe Market Y-o-Y Growth Comparison by Distribution channel, 2026-2036
- Figure 60: Western Europe Market Attractiveness Analysis by Distribution channel
- Figure 61: Western Europe Market Value Share and BPS Analysis by Price tier, 2026 and 2036
- Figure 62: Western Europe Market Y-o-Y Growth Comparison by Price tier, 2026-2036
- Figure 63: Western Europe Market Attractiveness Analysis by Price tier
- Figure 64: Eastern Europe Market Value Share and BPS Analysis by Country, 2026 and 2036
- Figure 65: Eastern Europe Market Value Share and BPS Analysis by Product type / variety, 2026 and 2036
- Figure 66: Eastern Europe Market Y-o-Y Growth Comparison by Product type / variety, 2026-2036
- Figure 67: Eastern Europe Market Attractiveness Analysis by Product type / variety
- Figure 68: Eastern Europe Market Value Share and BPS Analysis by Packaging format, 2026 and 2036
- Figure 69: Eastern Europe Market Y-o-Y Growth Comparison by Packaging format, 2026-2036
- Figure 70: Eastern Europe Market Attractiveness Analysis by Packaging format
- Figure 71: Eastern Europe Market Value Share and BPS Analysis by Distribution channel, 2026 and 2036
- Figure 72: Eastern Europe Market Y-o-Y Growth Comparison by Distribution channel, 2026-2036
- Figure 73: Eastern Europe Market Attractiveness Analysis by Distribution channel
- Figure 74: Eastern Europe Market Value Share and BPS Analysis by Price tier, 2026 and 2036
- Figure 75: Eastern Europe Market Y-o-Y Growth Comparison by Price tier, 2026-2036
- Figure 76: Eastern Europe Market Attractiveness Analysis by Price tier
- Figure 77: East Asia Market Value Share and BPS Analysis by Country, 2026 and 2036
- Figure 78: East Asia Market Value Share and BPS Analysis by Product type / variety, 2026 and 2036
- Figure 79: East Asia Market Y-o-Y Growth Comparison by Product type / variety, 2026-2036
- Figure 80: East Asia Market Attractiveness Analysis by Product type / variety
- Figure 81: East Asia Market Value Share and BPS Analysis by Packaging format, 2026 and 2036
- Figure 82: East Asia Market Y-o-Y Growth Comparison by Packaging format, 2026-2036
- Figure 83: East Asia Market Attractiveness Analysis by Packaging format
- Figure 84: East Asia Market Value Share and BPS Analysis by Distribution channel, 2026 and 2036
- Figure 85: East Asia Market Y-o-Y Growth Comparison by Distribution channel, 2026-2036
- Figure 86: East Asia Market Attractiveness Analysis by Distribution channel
- Figure 87: East Asia Market Value Share and BPS Analysis by Price tier, 2026 and 2036
- Figure 88: East Asia Market Y-o-Y Growth Comparison by Price tier, 2026-2036
- Figure 89: East Asia Market Attractiveness Analysis by Price tier
- Figure 90: South Asia and Pacific Market Value Share and BPS Analysis by Country, 2026 and 2036
- Figure 91: South Asia and Pacific Market Value Share and BPS Analysis by Product type / variety, 2026 and 2036
- Figure 92: South Asia and Pacific Market Y-o-Y Growth Comparison by Product type / variety, 2026-2036
- Figure 93: South Asia and Pacific Market Attractiveness Analysis by Product type / variety
- Figure 94: South Asia and Pacific Market Value Share and BPS Analysis by Packaging format, 2026 and 2036
- Figure 95: South Asia and Pacific Market Y-o-Y Growth Comparison by Packaging format, 2026-2036
- Figure 96: South Asia and Pacific Market Attractiveness Analysis by Packaging format
- Figure 97: South Asia and Pacific Market Value Share and BPS Analysis by Distribution channel, 2026 and 2036
- Figure 98: South Asia and Pacific Market Y-o-Y Growth Comparison by Distribution channel, 2026-2036
- Figure 99: South Asia and Pacific Market Attractiveness Analysis by Distribution channel
- Figure 100: South Asia and Pacific Market Value Share and BPS Analysis by Price tier, 2026 and 2036
- Figure 101: South Asia and Pacific Market Y-o-Y Growth Comparison by Price tier, 2026-2036
- Figure 102: South Asia and Pacific Market Attractiveness Analysis by Price tier
- Figure 103: Middle East and Africa Market Value Share and BPS Analysis by Country, 2026 and 2036
- Figure 104: Middle East and Africa Market Value Share and BPS Analysis by Product type / variety, 2026 and 2036
- Figure 105: Middle East and Africa Market Y-o-Y Growth Comparison by Product type / variety, 2026-2036
- Figure 106: Middle East and Africa Market Attractiveness Analysis by Product type / variety
- Figure 107: Middle East and Africa Market Value Share and BPS Analysis by Packaging format, 2026 and 2036
- Figure 108: Middle East and Africa Market Y-o-Y Growth Comparison by Packaging format, 2026-2036
- Figure 109: Middle East and Africa Market Attractiveness Analysis by Packaging format
- Figure 110: Middle East and Africa Market Value Share and BPS Analysis by Distribution channel, 2026 and 2036
- Figure 111: Middle East and Africa Market Y-o-Y Growth Comparison by Distribution channel, 2026-2036
- Figure 112: Middle East and Africa Market Attractiveness Analysis by Distribution channel
- Figure 113: Middle East and Africa Market Value Share and BPS Analysis by Price tier, 2026 and 2036
- Figure 114: Middle East and Africa Market Y-o-Y Growth Comparison by Price tier, 2026-2036
- Figure 115: Middle East and Africa Market Attractiveness Analysis by Price tier
- Figure 116: Global Market - Tier Structure Analysis
- Figure 117: Global Market - Company Share Analysis
Frequently Asked Questions
How big is the Ready-to-Serve Cocktails Market in 2026?
Future Market Insights estimates that the ready-to-serve cocktails market will reach USD 6.5 billion in 2026. The market is projected to expand further to reach USD 19.3 billion by 2036.
What is the market CAGR from 2026 to 2036?
As per FMI, ready-to-serve cocktail demand is projected to expand at an 11.5% CAGR between 2026 and 2036, driven by consumer preference for bar-quality recipes at home.
Which product type leads the market in 2026?
Standard classic formulation is projected to account for 35.1% of product type revenue in 2026, supported by consumer familiarity with margaritas, martinis, and old fashioneds.
Which packaging format leads the market in 2026?
Glass bottles (750 ml) are forecast to represent 39.0% of packaging-format revenue in 2026, as multi-serve volume aligns with at-home hosting and planned dinner entertaining.
Which country has a notable growth outlook?
France is projected to register a 14.0% CAGR through 2036, supported by strong aperitif dining habits and the growing availability of lower-alcohol bottled options.
Who are notable companies in this market?
Notable companies include Diageo plc, Pernod Ricard SA, Suntory Global Spirits, Bacardi Limited, Brown-Forman Corporation, Campari Group, Sazerac Company, and Proximo Spirits.
Preview the report firsthand - request a free sample
Get SampleGet the brochure for pricing and purchase details.
Get PDF
