Reports

- Global Locations -

Headquarters

Future Market Insights, Inc.

Christiana Corporate, 200
Continental Drive, Suite 401,
Newark, Delaware - 19713,
United States

T: +1-845-579-5705

Americas

Future Market Insights, Inc.

616 Corporate Way, Suite 2-9018,
Valley Cottage, NY 10989, United States

T: +1-347-918-3531

MEA

Future Market Insights

1602-6 Jumeirah Bay X2 Tower, Plot No: JLT-PH2-X2A,
Jumeirah Lakes Towers, Dubai,
United Arab Emirates

Europe

Future Market Insights

3rd Floor, 207 Regent Street,
W1B 3HH London
United Kingdom

T: + 44 (0) 20 8123 9659
D: +44 (0) 20 3287 4268

Asia Pacific

Future Market Insights

IndiaLand Global Tech Park, Unit UG-1, Behind Grand HighStreet, Phase 1, Hinjawadi, MH, Pune – 411057, India

Wine Bottle Sterilizer Market Outlook (2023 to 2033)

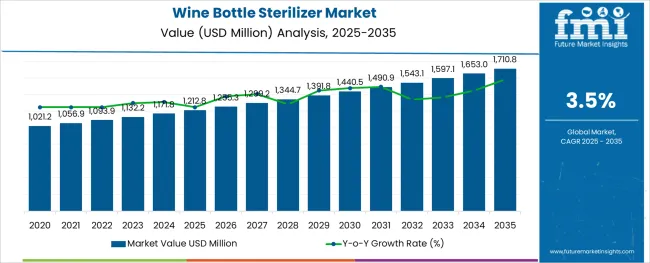
As per the analysts of Future Market Insights, the wine bottle sterilizer market is expected to grow at a CAGR of 3.5% during the forecast period. The industry value is expected to grow from US$ 1,132.2 million in 2023 to US$ 1,597.1 million in 2033. The market was worth US$ 1,093.9 million in 2022.

A wine bottle sterilizer is an essential tool for any wine enthusiast. The wine bottle sterilizer is quick and easy to use, and it is a great way to keep your wine collection safe and healthy. By removing pollutants including bacteria, mould, and yeast from the bottle's surface, wine sterilizers assist in purifying the beverage. By doing so, it is possible to make sure that the wine is secure to consume and will not upset the stomach.

The preference for wine sterilizers is rising across a range of applications, including industrial, commercial, and other uses, which is what is driving the market expansion. Yet another factor driving the spreading out of this market is the rising popularity of high-temperature wine sterilizers. The food and beverage sector uses high-temperature wine sterilizers frequently because of how well they work in sterilizing containers and surfaces.

For the purpose of limiting naturally occurring microorganisms, consumers prefer to purchase warmers and sterilizers. When it comes to purchasing decisions, ease of mobility and the lack of a requirement for liquid disinfectants are important considerations for customers. There are several advantages to utilizing bottle sterilizers over manually heating, wiping, and watering.

Owing to increased demand for vineyard products, including wine bottles, manufacturers are concentrating on providing upgraded versions with more features and better materials. On the other hand, growing technological developments in wine bottle washers and sterilizers, including alarm systems that sound when the wine cleaning process is finished, fully automatic products, and others, along with an increase in the number of product promotion campaigns through media and social media channels, will further contribute by creating enormous opportunities that will drive the growth of the wine bottle sterilizer market in the aforementioned projected timeframe.

Manufacturers are now working on a UV wine sterilizer, a machine that employs ultraviolet light to destroy any yeast, bacteria, or germs that may be present in wine. A UV wine sterilizer, a device that employs ultraviolet radiation to inactivate microorganisms including yeast, bacteria, and germs that may be present in the wine, is also being developed by manufacturers at the moment. It is safe to use even on surfaces that may come into touch with food, and the procedure has no impact on the flavor of the wine. Since they are compact, portable, and suitable for both domestic and commercial purposes, consumers now prefer UV wine sterilizers. These can be used to clean wine bottles, glasses, and other containers.

Attribute Details
Market Size Value in 2023 US$ 1,132.2 Million
Market Forecast Value in 2033 US$ 1,597.1 Million
Global Growth Rate (2023 to 2033) 3.5%
Forecast Period 2023 to 2033
Global Market Share of USA, Germany, Japan, and Australia 68.7%

Don't pay for what you don't need

Customize your report by selecting specific countries or regions and save 30%!

Historical Outlook versus Future Projections for Wine Bottle Sterilizer Market

The global market for wine bottle sterilizers increased from US$ 960.7 million to US$ 1,093.9 million between 2018 and 2022 with a CAGR of 3.3%.

The industry is expanding due to the rising demand for wine on a global scale along with the rising adoption of organic wines. As mainstream audiences develop an awareness of the health advantages of drinking wine, a pathway for wine bottle sterilizers becomes increasingly crucial.

  • Short Term (2023 to 2026): The rising disposable incomes and changing lifestyle trends are driving the demand for premium wines, which in turn is bolstering the market growth. Moreover, home brewing is becoming progressively trendy as a leisure activity in developed nations which necessitates the deployment of wine bottle sterilizers.
  • Medium Term (2026 to 2029): The proliferation of hypermarkets and supermarkets, wine shops, and online platforms for e-tailing, as well as rising wine prices, will broaden the product's appeal. Wine bottle sterilizers are likely to become additional popular as wine bars and eateries proliferate.
  • Long Term (2029 to 2033): Manufacturers are working on developing wine bottle sterilizers that are more effective and less expensive with the help of technological breakthroughs in sterilizing technology.

During the forecast period, the global wine bottle sterilizer market is anticipated to grow from US$ 1,132.2 Million in 2023 to US$ 1,597.1 Million by 2033 with a CAGR of 3.5%.

Wine Bottle Sterilizer Market

Comparative Analysis of Adjacent Markets

Wine Bottle Sterilizer Market:

Differentiating Aspects Wine Bottle Sterilizer Market
CAGR 3.5%
Market Valuation in 2023 US$ 1,132.2 Million
Projected Market Value in 2033 US$ 1,597.1 Million
Driver Wine sterilizers are becoming popular as wine bars and eateries proliferate.
Trend The rise in consumer interest in home brewing as a pastime in developed nations.
Opportunity Wine bottle sterilizers are becoming more effective and affordable owing to developments in sterilizing technology.

Wine Cooler Market:

Differentiating Aspects Wine Cooler Market
CAGR 5.6%
Market Valuation in 2023 US$ 2.63 Billion
Projected Market Value in 2033 US$ 4.53 Billion
Driver Wine cooler demand is on the rise as a result of the booming food and beverage sector.
Trend The demand for high-end wine coolers with large bottle capacities has increased due to the fast-expanding wine consumption.
Opportunity Market participants are concentrating on generating high-end range wine coolers with multiple freezers and refrigerator compartments.

Wine Barrel Market:

Differentiating Aspects Wine Barrel Market
CAGR 4.8%
Market Valuation in 2023 US$ 4.30 Billion
Projected Market Value in 2033 US$ 6.87 Billion
Driver Numerous health advantages of drinking wine are fueling the wine barrels industry.
Trend With changing lifestyles, more individuals are adopting off-the-shelf alcohol-drinking practices, particularly in developing countries.
Opportunity Due to the ease of access to alcohol brought about by increased retail penetration, there will be a large increase in alcohol consumption and hence, the need for alcohol packaging solutions.
Nandini Roy Choudhury

Principal Consultant

Talk to Analyst

Find your sweet spots for generating winning opportunities in this market.

Category-wise Insights

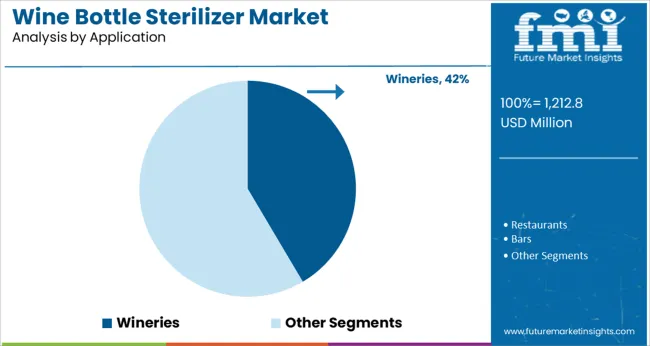
In which industry is Wine Bottle Sterilizer used the most?

Wineries have long been engaged in the production and sale of wine. However, there has been a rise in demand for wine bottle sterilizers in recent years. Wine bottle sterilization is an essential stage in the winemaking process, and many wineries are increasingly asking for sterilizers designed exclusively for wine bottles.

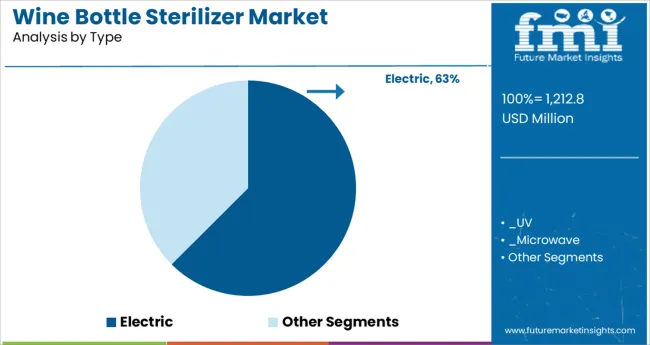
What are the advantages of an Electric Wine Bottle Sterilizer?

An electric wine bottle sterilizer is an easy and effective way to clean your wine bottles. This type of sterilizer uses electricity to heat up a small element inside the device, which in turn sterile the bottles. Here are some of the advantages of using an electric Wine Bottle Sterilizer:

  • They are quick and easy to use.
  • They are more effective than other methods, such as boiling water.
  • They can be used on a variety of different types of bottles, including plastic and glass.
  • They are safe to use and will not damage the bottles.
  • They have a removable water drainage pan that is available as an option, making it universal.

What are the different materials available for Wine Bottle Sterilizers?

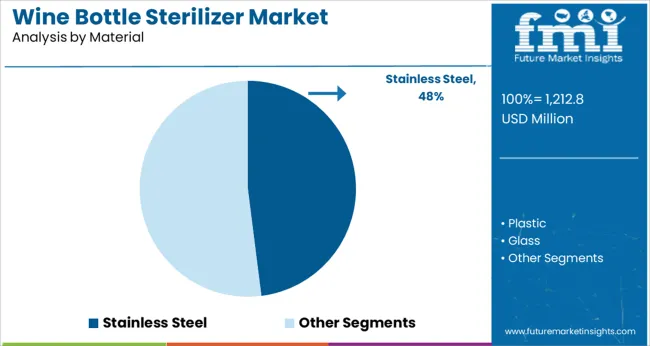
Wine bottle sterilizers come in many different shapes, sizes, and materials. The most common wine bottle sterilizers are made of plastic, glass, or metal. Each type of sterilizer has its own advantages and disadvantages.

Plastic wine bottle sterilizers are preferred by consumers mostly as these are the least expensive option. They are also the lightest weight and most portable option. They might not survive as long, however, as they are not as strong as glass or metal sterilizers.

Glass wine bottle sterilizers are not only more expensive than plastic but also more durable. However, they are also likely to break if dropped. Since they are heavier than plastic sterilizers, transportation might be more challenging.

Metal wine bottle sterilizers are both more expensive and durable options than the rest. They will not break if dropped and will last for many years with proper care.
Country-wise Insights

How is the Wine Bottle Sterilizer Market Evolving in the United States?

Owing to the huge demand for wine and spirits from developing nations like Brazil and Mexico, North America now has a lion's share of the global wine bottle sterilizer market in terms of revenue. The contribution of the United States is implacable in holding this huge market share.
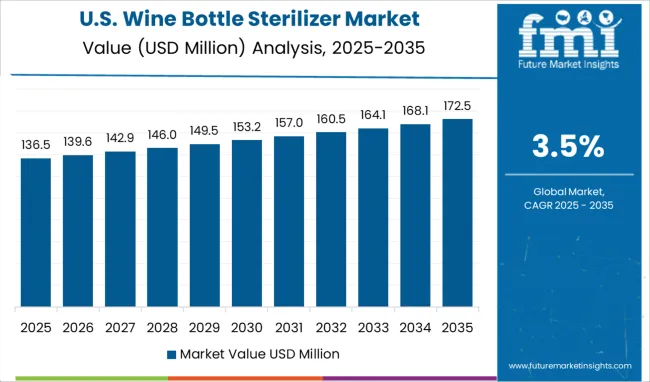
With a market share of 37.7% and a projected value of US$426.8 million in 2023, the USA wine bottle sterilizer market is seeing significant growth. Wines have been produced in the United States for a very long time, and the nation now considers wine goods to be an important meal component. The industry is being driven by the fact that drinking wine has become a sign of social standing, particularly among millennials and younger generations of the state.

In the past, wine was typically packaged in glass bottles and stored in a cool, dark place by wine manufacturers in the country. They have now recognized that wine must be stored in a sterile environment in order to prevent spoilage. This has resulted in the high adoption of sterilizers by wineries, bars, and restaurants. Additionally, it is anticipated that increased awareness of the need of upholding quality standards would further fuel product demand.

What is Europe Performing in the Wine Bottle Sterilize Market?

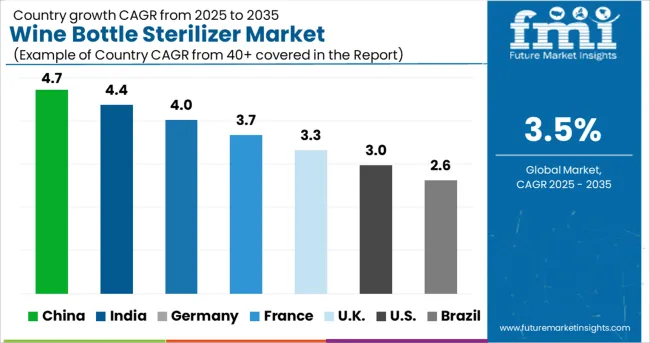
The most prolific wine producers are located in European nations. Since wine has always been a significant element of the vibrant European culture and continues to be, the European wine industry is sophisticated. Additionally, the wine bottle sterilizer market in this region has expanded as a result of the surge in wine drinking with food at home. Thus, as a result of the awareness of the need to protect wine from any sort of contaminants, the European wine bottle sterilizer market likewise has high development prospects. The United Kingdom and Germany are the most lucrative markets for wine bottle sterilizers in Europe.

Country United Kingdom
Growth Factor Owing to its long reputation as a top-notch wine producer, the United Kingdom wine bottle sterilizer market has a significant market share. Furthermore, the United Kingdom has witnessed the effect of the Covid-19 pandemic, which in turn has surged the adoption of wine bottle sterilizers. Manufacturers in this country are experimenting with the latest technology owing to the reputation of wine here. An important area where United Kingdom manufacturers are innovating is in the design of their products. Additionally, these products are often very easy to use, making them perfect for even the most novice wine drinkers. CAGR - 6.5%
Country Germany
Growth Factor In recent years, Germany has become a leading innovator in the wine bottle sterilizer market. Manufacturers in this country have developed a number of new and innovative products that are helping to make the sterilization process more efficient and effective. One of the most popular innovations in this space is the use of UV light to sterilize wine bottles. This technology is becoming increasingly popular as it is shown to be more effective than other methods, such as using chemicals or steam. Market Share - 21.9%

Get the data you need at a Fraction of the cost

Personalize your report by choosing insights you need
and save 40%!

Startup Ecosystem

The wine bottle sterilizer market requires a revamp, hence, new entrants are evolving to penetrate in the market. Start-ups worldwide are longing to participate in several events to bring their own products. To meet customer demand and improve their brand's reputation, the well-known businesses operating in the market provide unique items. Using this tactic, businesses could be able to improve their brand image. In addition, implementing innovative manufacturing technology enables businesses to save labor expenses, increase productivity, improve operational efficiency, and meet organizational objectives.

Top Start-ups to Keep an Eye on

Start-up Company CP Lab Safety
Country United States
Description The company offers cleaning and sterilizing services. The company is ISO-certified and FDA-registered. Its facility brags advanced linear accelerators that consent for high volume fabrication providing undeviating sterilization to the product.
Start-up Company Ava Winery
Country United States
Description This San Francisco-based start-up intents to disrupt high-end wines by propositioning bottles of chemically identical wine low-cost and more sustainably.

Competitive Landscape

The competitive landscape of the Wine Bottle Sterilizer market is quite fragmented with the presence of a large number of small and medium-sized players. The key players in the market are focused on expanding their product portfolio and geographical reach to gain a competitive edge over their peers. The leading players in the market are also investing in research & development activities to develop innovative products.

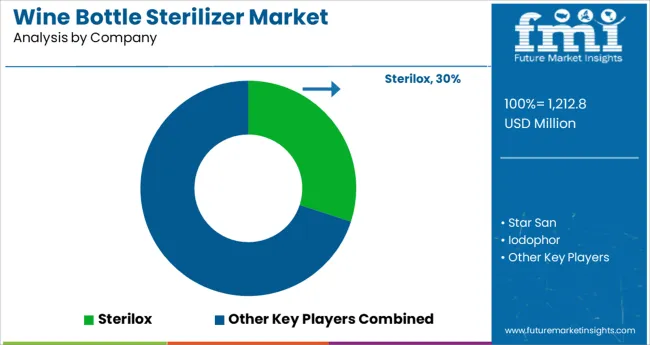
Creating solutions for sterilization and disinfection is the focus of the manufacturer SterilOx. In the United Arab Emirates, the corporation works with a group of businessmen and engineers along with the Russian Research & Development Institute to operate this company. The company offers highly efficient, all-natural, and environment-friendly sanitizers and sterilizers in a single solution using a full-cycle production facility and local ingredients. Additionally, it provides a comprehensive, customized solution that works for a variety of locations.

On the other hand, Wine Guardian is the industry pioneer in wine cellar chilling. It is an air innovation company that offers wine cellar cooling units to meet every requirement, from the largest commercial cellars to small cellars for wine storage at home.

Aquatech BM is another important key player in the market. The company has a team of professionals who possess vast experience in the design and production of industrial and commercial sterilization equipment including bottle washers. Its bottle washers are used by several industries such as breweries, dairy farms, laboratories, wineries, and more. The company strives to offer dependable products that suit the requirements and budget of the customers.

Recent Developments

  • In November 2022, Wine Guardian announced the addition of a new ductless split wine room cooling system to its portfolio. It was created specifically for use in wine walls, where it offers the best cooling and ventilation to maintain long-term storage conditions for collections of great wine.
  • In January 2021, the multi-functional dryer was introduced by Aquatech BM. It has a great capacity and is simple to use. It also enables quick evaporation.

Wine Bottle Sterilizer Market Report Scope

Attribute Details
Forecast Period 2023 to 2033
Historical Data Available for 2018 to 2022
Market Analysis USD million for Value and Units for Volume
Key Regions Covered
  • North America
  • Latin America
  • Europe
  • Asia Pacific
  • Oceania
  • Middle East and Africa (MEA)
Key Countries Covered
  • USA
  • Canada
  • Mexico
  • Germany
  • United Kingdom
  • France
  • Italy
  • Spain
  • China
  • Japan
  • India
  • South Korea
  • Australia
  • Brazil
  • Argentina
  • South Africa
  • UAE
Key Segments Covered
  • Type
  • Material
  • Application
  • Distribution Channel
  • Region
Key Companies Profiled
  • Sterilox
  • Star San
  • Iodophor
  • Wine Guardian
  • The Vintner's Friend
  • The Champagne Maker
  • The Wine Doctor
  • Aquatech BM
  • Midwest Supplies LLC
  • Presque Isle Wine Cellars
Report Coverage Company Share Analysis, DROT Analysis, Market Dynamics and Challenges, Strategic Growth Initiatives, Market Forecast, Competitive Landscape,
Customization & Pricing Available upon Request

Wine Bottle Sterilizer Market Segmentation

By Type:

  • Electric
    • UV
    • Microwave
    • Ozone sterilizers
  • Non-electric

By Material:

  • Plastic
  • Glass
  • Material

By Application:

  • Wineries
  • Restaurants
  • Bars
  • Hotels

By Distribution Channel:

  • Supermarkets/Hypermarkets
  • Speciality Stores
  • Convenience Stores
  • E-commerce Websites

By Region:

  • North America
  • Latin America
  • Europe
  • Asia Pacific
  • Oceania
  • MEA

Frequently Asked Questions

How big is the Wine Bottle Sterilizer Market?

The Wine Bottle Sterilizer Market will reach nearly US$ 1,132.2 million by 2023.

At what rate Wine Bottle Sterilizer Market is expected to grow?

The Wine Bottle Sterilizer Market is expected to rise at a CAGR of 3.5%.

What is the United States Wine Bottle Sterilizer Market Outlook?

By the year 2023, the United States will account for 37.7% of the global market of Wine Bottle sterilizers.

At what rate will Wine Bottle Sterilizer Market grow in United Kingdom?

The United Kingdom Wine Bottle Sterilizer Market will grow at 6.5% CAGR between 2023 and 2033.

Which companies dominate the market?

Midwest Supplies LLC, Wine Guardian, The Vintner's Friend, and Presque Isle Wine Cellars are the companies dominating the Wine Bottle Sterilizer Market.

What is the demand outlook forecast for the Wine Bottle Sterilizer Market?

The global demand for Wine Bottle Sterilizer Market is forecasted to surpass US$ 1,597.1 million by the year 2033.

Table of Content

1. Executive Summary | Wine Bottle Sterilizer Market

    1.1. Global Market Outlook

    1.2. Demand-side Trends

    1.3. Supply-side Trends

    1.4. Technology Roadmap Analysis

    1.5. Analysis and Recommendations

2. Market Overview

    2.1. Market Coverage / Taxonomy

    2.2. Market Definition / Scope / Limitations

3. Market Background

    3.1. Market Dynamics

        3.1.1. Drivers

        3.1.2. Restraints

        3.1.3. Opportunity

        3.1.4. Trends

    3.2. Scenario Forecast

        3.2.1. Demand in Optimistic Scenario

        3.2.2. Demand in Likely Scenario

        3.2.3. Demand in Conservative Scenario

    3.3. Product launches & Recent Developments

    3.4. Product Life Cycle Analysis

    3.5. Value Chain Analysis

        3.5.1. Supply Side Participants and their Roles

            3.5.1.1. Producers

            3.5.1.2. Mid-Level Participants (Traders/ Agents/ Brokers)

            3.5.1.3. Wholesalers and Distributors

        3.5.2. % of Operating Margin Analysis

        3.5.3. List of Raw Material Suppliers

        3.5.4. List of Existing and Potential Buyer’s

    3.6. Global Market - Pricing Analysis

        3.6.1. Price Point Assessment by Region

        3.6.2. Price Point Assessment by Product Type

        3.6.3. Price Forecast till 2033

        3.6.4. Factors affecting pricing

    3.7. Forecast Factors - Relevance & Impact

    3.8. PESTLE and Porter’s Analysis

    3.9. Regulatory Landscape

        3.9.1. Packaging & Labelling Regulations

        3.9.2. Certifications and Certifying Agency Overview

        3.9.3. Import/Export Policies

    3.10. Regional Parent Market Outlook

    3.11. Production and Consumption Statistics

    3.12. Import and Export Statistics

    3.13. Consumers Survey Analysis

    3.14. Macro-Economic Factors

    3.15. Product Claims & Nutritional Information scanned by Buyers

4. Global Market Analysis 2018 to 2022 and Forecast, 2023 to 2033

    4.1. Historical Market Size Value (US$ million) & Volume (MT) Analysis, 2018 to 2022

    4.2. Current and Future Market Size Value (US$ million) & Volume (MT) Projections, 2023 to 2033

        4.2.1. Y-o-Y Growth Trend Analysis

        4.2.2. Absolute $ Opportunity Analysis

5. Global Market Analysis 2018 to 2022 and Forecast 2023 to 2033, By Type

    5.1. Introduction / Key Findings

    5.2. Historical Market Size Value (US$ million) & Volume (MT) Analysis By Type, 2018 to 2022

    5.3. Current and Future Market Size Value (US$ million) & Volume (MT) Analysis and Forecast By Type, 2023 to 2033

        5.3.1. Electric

            5.3.1.1. UV

            5.3.1.2. Microwave

            5.3.1.3. Ozone Sterilizers

        5.3.2. Non-electric

    5.4. Y-o-Y Growth Trend Analysis By Type, 2018 to 2022

    5.5. Absolute $ Opportunity Analysis By Type, 2023 to 2033

6. Global Market Analysis 2018 to 2022 and Forecast 2023 to 2033, By Material

    6.1. Introduction / Key Findings

    6.2. Historical Market Size Value (US$ million) & Volume (MT) Analysis By Material, 2018 to 2022

    6.3. Current and Future Market Size Value (US$ million) & Volume (MT) Analysis and Forecast By Material, 2023 to 2033

        6.3.1. Plastic

        6.3.2. Glass

        6.3.3. Metal

    6.4. Y-o-Y Growth Trend Analysis By Material, 2018 to 2022

    6.5. Absolute $ Opportunity Analysis By Material, 2023 to 2033

7. Global Market Analysis 2018 to 2022 and Forecast 2023 to 2033, By Application

    7.1. Introduction / Key Findings

    7.2. Historical Market Size Value (US$ million) & Volume (MT) Analysis By Application, 2018 to 2022

    7.3. Current and Future Market Size Value (US$ million) & Volume (MT) Analysis and Forecast By Application, 2023 to 2033

        7.3.1. Wineries

        7.3.2. Restaurants

        7.3.3. Bars

        7.3.4. Hotels

    7.4. Y-o-Y Growth Trend Analysis By Application, 2018 to 2022

    7.5. Absolute $ Opportunity Analysis By Application, 2023 to 2033

8. Global Market Analysis 2018 to 2022 and Forecast 2023 to 2033, By Distribution Channel

    8.1. Introduction / Key Findings

    8.2. Historical Market Size Value (US$ million) & Volume (MT) Analysis By Distribution Channel, 2018 to 2022

    8.3. Current and Future Market Size Value (US$ million) & Volume (MT) Analysis and Forecast By Distribution Channel, 2023 to 2033

        8.3.1. Supermarkets/Hypermarkets

        8.3.2. Speciality Stores

        8.3.3. Convenience Stores

        8.3.4. E-commerce Websites

    8.4. Y-o-Y Growth Trend Analysis By Distribution Channel, 2018 to 2022

    8.5. Absolute $ Opportunity Analysis By Distribution Channel, 2023 to 2033

9. Global Market Analysis 2018 to 2022 and Forecast 2023 to 2033, By Region

    9.1. Introduction

    9.2. Historical Market Size Value (US$ million) & Volume (MT) Analysis By Region, 2018 to 2022

    9.3. Current Market Size Value (US$ million) & Volume (MT) Analysis and Forecast By Region, 2023 to 2033

        9.3.1. North America

        9.3.2. Latin America

        9.3.3. Europe

        9.3.4. East Asia

        9.3.5. South Asia

        9.3.6. Oceania

        9.3.7. MEA

    9.4. Market Attractiveness Analysis By Region

10. North America Market Analysis 2018 to 2022 and Forecast 2023 to 2033, By Country

    10.1. Historical Market Size Value (US$ million) & Volume (MT) Trend Analysis By Market Taxonomy, 2018 to 2022

    10.2. Market Size Value (US$ million) & Volume (MT) Forecast By Market Taxonomy, 2023 to 2033

        10.2.1. By Country

            10.2.1.1. The USA

            10.2.1.2. Canada

        10.2.2. By Type

        10.2.3. By Material

        10.2.4. By Application

        10.2.5. By Distribution Channel

    10.3. Market Attractiveness Analysis

        10.3.1. By Country

        10.3.2. By Type

        10.3.3. By Material

        10.3.4. By Application

        10.3.5. By Distribution Channel

    10.4. Key Takeaways

11. Latin America Market Analysis 2018 to 2022 and Forecast 2023 to 2033, By Country

    11.1. Historical Market Size Value (US$ million) & Volume (MT) Trend Analysis By Market Taxonomy, 2018 to 2022

    11.2. Market Size Value (US$ million) & Volume (MT) Forecast By Market Taxonomy, 2023 to 2033

        11.2.1. By Country

            11.2.1.1. Brazil

            11.2.1.2. Mexico

            11.2.1.3. Argentina

            11.2.1.4. Chile

            11.2.1.5. Peru

            11.2.1.6. Rest of Latin America

        11.2.2. By Type

        11.2.3. By Material

        11.2.4. By Application

        11.2.5. By Distribution Channel

    11.3. Market Attractiveness Analysis

        11.3.1. By Country

        11.3.2. By Type

        11.3.3. By Material

        11.3.4. By Application

        11.3.5. By Distribution Channel

    11.4. Key Takeaways

12. Europe Market Analysis 2018 to 2022 and Forecast 2023 to 2033, By Country

    12.1. Historical Market Size Value (US$ million) & Volume (MT) Trend Analysis By Market Taxonomy, 2018 to 2022

    12.2. Market Size Value (US$ million) & Volume (MT) Forecast By Market Taxonomy, 2023 to 2033

        12.2.1. By Country

            12.2.1.1. Germany

            12.2.1.2. Italy

            12.2.1.3. France

            12.2.1.4. The United Kingdom

            12.2.1.5. Spain

            12.2.1.6. Russia

            12.2.1.7. BENELUX

            12.2.1.8. Poland

            12.2.1.9. Nordic Countries

            12.2.1.10. Rest of Europe

        12.2.2. By Type

        12.2.3. By Material

        12.2.4. By Application

        12.2.5. By Distribution Channel

    12.3. Market Attractiveness Analysis

        12.3.1. By Country

        12.3.2. By Type

        12.3.3. By Material

        12.3.4. By Application

        12.3.5. By Distribution Channel

    12.4. Key Takeaways

13. East Asia Market Analysis 2018 to 2022 and Forecast 2023 to 2033, By Country

    13.1. Historical Market Size Value (US$ million) & Volume (MT) Trend Analysis By Market Taxonomy, 2018 to 2022

    13.2. Market Size Value (US$ million) & Volume (MT) Forecast By Market Taxonomy, 2023 to 2033

        13.2.1. By Country

            13.2.1.1. China

            13.2.1.2. Japan

            13.2.1.3. South Korea

        13.2.2. By Type

        13.2.3. By Material

        13.2.4. By Application

        13.2.5. By Distribution Channel

    13.3. Market Attractiveness Analysis

        13.3.1. By Country

        13.3.2. By Type

        13.3.3. By Material

        13.3.4. By Application

        13.3.5. By Distribution Channel

    13.4. Key Takeaways

14. South Asia Market Analysis 2018 to 2022 and Forecast 2023 to 2033, By Country

    14.1. Historical Market Size Value (US$ million) & Volume (MT) Trend Analysis By Market Taxonomy, 2018 to 2022

    14.2. Market Size Value (US$ million) & Volume (MT) Forecast By Market Taxonomy, 2023 to 2033

        14.2.1. By Country

            14.2.1.1. India

            14.2.1.2. Thailand

            14.2.1.3. Malaysia

            14.2.1.4. Indonesia

            14.2.1.5. Singapore

            14.2.1.6. Rest of South Asia

        14.2.2. By Type

        14.2.3. By Material

        14.2.4. By Application

        14.2.5. By Distribution Channel

    14.3. Market Attractiveness Analysis

        14.3.1. By Country

        14.3.2. By Type

        14.3.3. By Material

        14.3.4. By Application

        14.3.5. By Distribution Channel

    14.4. Key Takeaways

15. Oceania Market Analysis 2018 to 2022 and Forecast 2023 to 2033, By Country

    15.1. Historical Market Size Value (US$ million) & Volume (MT) Trend Analysis By Market Taxonomy, 2018 to 2022

    15.2. Market Size Value (US$ million) & Volume (MT) Forecast By Market Taxonomy, 2023 to 2033

        15.2.1. By Country

            15.2.1.1. Australia

            15.2.1.2. New Zealand

        15.2.2. By Type

        15.2.3. By Material

        15.2.4. By Application

        15.2.5. By Distribution Channel

    15.3. Market Attractiveness Analysis

        15.3.1. By Country

        15.3.2. By Type

        15.3.3. By Material

        15.3.4. By Application

        15.3.5. By Distribution Channel

    15.4. Key Takeaways

16. MEA Market Analysis 2018 to 2022 and Forecast 2023 to 2033, By Country

    16.1. Historical Market Size Value (US$ million) & Volume (MT) Trend Analysis By Market Taxonomy, 2018 to 2022

    16.2. Market Size Value (US$ million) & Volume (MT) Forecast By Market Taxonomy, 2023 to 2033

        16.2.1. By Country

            16.2.1.1. GCC Countries

            16.2.1.2. South Africa

            16.2.1.3. Central Africa

            16.2.1.4. North Africa

        16.2.2. By Type

        16.2.3. By Material

        16.2.4. By Application

        16.2.5. By Distribution Channel

    16.3. Market Attractiveness Analysis

        16.3.1. By Country

        16.3.2. By Type

        16.3.3. By Material

        16.3.4. By Application

        16.3.5. By Distribution Channel

    16.4. Key Takeaways

17. Key Countries Market Analysis

    17.1. The USA

        17.1.1. Pricing Analysis

        17.1.2. Market Share Analysis, 2022

            17.1.2.1. By Type

            17.1.2.2. By Material

            17.1.2.3. By Application

            17.1.2.4. By Distribution Channel

    17.2. Canada

        17.2.1. Pricing Analysis

        17.2.2. Market Share Analysis, 2022

            17.2.2.1. By Type

            17.2.2.2. By Material

            17.2.2.3. By Application

            17.2.2.4. By Distribution Channel

    17.3. Brazil

        17.3.1. Pricing Analysis

        17.3.2. Market Share Analysis, 2022

            17.3.2.1. By Type

            17.3.2.2. By Material

            17.3.2.3. By Application

            17.3.2.4. By Distribution Channel

    17.4. Mexico

        17.4.1. Pricing Analysis

        17.4.2. Market Share Analysis, 2022

            17.4.2.1. By Type

            17.4.2.2. By Material

            17.4.2.3. By Application

            17.4.2.4. By Distribution Channel

    17.5. Argentina

        17.5.1. Pricing Analysis

        17.5.2. Market Share Analysis, 2022

            17.5.2.1. By Type

            17.5.2.2. By Material

            17.5.2.3. By Application

            17.5.2.4. By Distribution Channel

    17.6. Chile

        17.6.1. Pricing Analysis

        17.6.2. Market Share Analysis, 2022

            17.6.2.1. By Type

            17.6.2.2. By Material

            17.6.2.3. By Application

            17.6.2.4. By Distribution Channel

    17.7. Peru

        17.7.1. Pricing Analysis

        17.7.2. Market Share Analysis, 2022

            17.7.2.1. By Type

            17.7.2.2. By Material

            17.7.2.3. By Application

            17.7.2.4. By Distribution Channel

    17.8. Germany

        17.8.1. Pricing Analysis

        17.8.2. Market Share Analysis, 2022

            17.8.2.1. By Type

            17.8.2.2. By Material

            17.8.2.3. By Application

            17.8.2.4. By Distribution Channel

    17.9. Italy

        17.9.1. Pricing Analysis

        17.9.2. Market Share Analysis, 2022

            17.9.2.1. By Type

            17.9.2.2. By Material

            17.9.2.3. By Application

            17.9.2.4. By Distribution Channel

    17.10. France

        17.10.1. Pricing Analysis

        17.10.2. Market Share Analysis, 2022

            17.10.2.1. By Type

            17.10.2.2. By Material

            17.10.2.3. By Application

            17.10.2.4. By Distribution Channel

    17.11. Spain

        17.11.1. Pricing Analysis

        17.11.2. Market Share Analysis, 2022

            17.11.2.1. By Type

            17.11.2.2. By Material

            17.11.2.3. By Application

            17.11.2.4. By Distribution Channel

    17.12. The United Kingdom

        17.12.1. Pricing Analysis

        17.12.2. Market Share Analysis, 2022

            17.12.2.1. By Type

            17.12.2.2. By Material

            17.12.2.3. By Application

            17.12.2.4. By Distribution Channel

    17.13. Russia

        17.13.1. Pricing Analysis

        17.13.2. Market Share Analysis, 2022

            17.13.2.1. By Type

            17.13.2.2. By Material

            17.13.2.3. By Application

            17.13.2.4. By Distribution Channel

    17.14. Poland

        17.14.1. Pricing Analysis

        17.14.2. Market Share Analysis, 2022

            17.14.2.1. By Type

            17.14.2.2. By Material

            17.14.2.3. By Application

            17.14.2.4. By Distribution Channel

    17.15. BENELUX

        17.15.1. Pricing Analysis

        17.15.2. Market Share Analysis, 2022

            17.15.2.1. By Type

            17.15.2.2. By Material

            17.15.2.3. By Application

            17.15.2.4. By Distribution Channel

    17.16. Nordic Countries

        17.16.1. Pricing Analysis

        17.16.2. Market Share Analysis, 2022

            17.16.2.1. By Type

            17.16.2.2. By Material

            17.16.2.3. By Application

            17.16.2.4. By Distribution Channel

    17.17. China

        17.17.1. Pricing Analysis

        17.17.2. Market Share Analysis, 2022

            17.17.2.1. By Type

            17.17.2.2. By Material

            17.17.2.3. By Application

            17.17.2.4. By Distribution Channel

    17.18. Japan

        17.18.1. Pricing Analysis

        17.18.2. Market Share Analysis, 2022

            17.18.2.1. By Type

            17.18.2.2. By Material

            17.18.2.3. By Application

            17.18.2.4. By Distribution Channel

    17.19. South Korea

        17.19.1. Pricing Analysis

        17.19.2. Market Share Analysis, 2022

            17.19.2.1. By Type

            17.19.2.2. By Material

            17.19.2.3. By Application

            17.19.2.4. By Distribution Channel

    17.20. India

        17.20.1. Pricing Analysis

        17.20.2. Market Share Analysis, 2022

            17.20.2.1. By Type

            17.20.2.2. By Material

            17.20.2.3. By Application

            17.20.2.4. By Distribution Channel

    17.21. Thailand

        17.21.1. Pricing Analysis

        17.21.2. Market Share Analysis, 2022

            17.21.2.1. By Type

            17.21.2.2. By Material

            17.21.2.3. By Application

            17.21.2.4. By Distribution Channel

    17.22. Indonesia

        17.22.1. Pricing Analysis

        17.22.2. Market Share Analysis, 2022

            17.22.2.1. By Type

            17.22.2.2. By Material

            17.22.2.3. By Application

            17.22.2.4. By Distribution Channel

    17.23. Malaysia

        17.23.1. Pricing Analysis

        17.23.2. Market Share Analysis, 2022

            17.23.2.1. By Type

            17.23.2.2. By Material

            17.23.2.3. By Application

            17.23.2.4. By Distribution Channel

    17.24. Singapore

        17.24.1. Pricing Analysis

        17.24.2. Market Share Analysis, 2022

            17.24.2.1. By Type

            17.24.2.2. By Material

            17.24.2.3. By Application

            17.24.2.4. By Distribution Channel

    17.25. Australia

        17.25.1. Pricing Analysis

        17.25.2. Market Share Analysis, 2022

            17.25.2.1. By Type

            17.25.2.2. By Material

            17.25.2.3. By Application

            17.25.2.4. By Distribution Channel

    17.26. New Zealand

        17.26.1. Pricing Analysis

        17.26.2. Market Share Analysis, 2022

            17.26.2.1. By Type

            17.26.2.2. By Material

            17.26.2.3. By Application

            17.26.2.4. By Distribution Channel

    17.27. GCC Countries

        17.27.1. Pricing Analysis

        17.27.2. Market Share Analysis, 2022

            17.27.2.1. By Type

            17.27.2.2. By Material

            17.27.2.3. By Application

            17.27.2.4. By Distribution Channel

    17.28. South Africa

        17.28.1. Pricing Analysis

        17.28.2. Market Share Analysis, 2022

            17.28.2.1. By Type

            17.28.2.2. By Material

            17.28.2.3. By Application

            17.28.2.4. By Distribution Channel

    17.29. North Africa

        17.29.1. Pricing Analysis

        17.29.2. Market Share Analysis, 2022

            17.29.2.1. By Type

            17.29.2.2. By Material

            17.29.2.3. By Application

            17.29.2.4. By Distribution Channel

    17.30. Central Africa

        17.30.1. Pricing Analysis

        17.30.2. Market Share Analysis, 2022

            17.30.2.1. By Type

            17.30.2.2. By Material

            17.30.2.3. By Application

            17.30.2.4. By Distribution Channel

18. Market Structure Analysis

    18.1. Competition Dashboard

    18.2. Competition Benchmarking

    18.3. Market Share Analysis of Top Players

        18.3.1. By Regional

        18.3.2. By Type

        18.3.3. By Material

        18.3.4. By Application

        18.3.5. By Distribution Channel

19. Competition Analysis

    19.1. Competition Deep Dive

        19.1.1. Sterilox

            19.1.1.1. Overview

            19.1.1.2. Product Portfolio

            19.1.1.3. Profitability by Market Segments (Type/Material/Application/Distribution Channel/Region)

            19.1.1.4. Sales Footprint

            19.1.1.5. Strategy Overview

                19.1.1.5.1. Marketing Strategy

                19.1.1.5.2. Product Strategy

                19.1.1.5.3. Channel Strategy

        19.1.2. Star San

            19.1.2.1. Overview

            19.1.2.2. Product Portfolio

            19.1.2.3. Profitability by Market Segments (Type/Material/Application/Distribution Channel/Region)

            19.1.2.4. Sales Footprint

            19.1.2.5. Strategy Overview

                19.1.2.5.1. Marketing Strategy

                19.1.2.5.2. Product Strategy

                19.1.2.5.3. Channel Strategy

        19.1.3. Iodophor

            19.1.3.1. Overview

            19.1.3.2. Product Portfolio

            19.1.3.3. Profitability by Market Segments (Type/Material/Application/Distribution Channel/Region)

            19.1.3.4. Sales Footprint

            19.1.3.5. Strategy Overview

                19.1.3.5.1. Marketing Strategy

                19.1.3.5.2. Product Strategy

                19.1.3.5.3. Channel Strategy

        19.1.4. Wine Guardian

            19.1.4.1. Overview

            19.1.4.2. Product Portfolio

            19.1.4.3. Profitability by Market Segments (Type/Material/Application/Distribution Channel/Region)

            19.1.4.4. Sales Footprint

            19.1.4.5. Strategy Overview

                19.1.4.5.1. Marketing Strategy

                19.1.4.5.2. Product Strategy

                19.1.4.5.3. Channel Strategy

        19.1.5. The Vintner's Friend

            19.1.5.1. Overview

            19.1.5.2. Product Portfolio

            19.1.5.3. Profitability by Market Segments (Type/Material/Application/Distribution Channel/Region)

            19.1.5.4. Sales Footprint

            19.1.5.5. Strategy Overview

                19.1.5.5.1. Marketing Strategy

                19.1.5.5.2. Product Strategy

                19.1.5.5.3. Channel Strategy

        19.1.6. The Champagne Maker

            19.1.6.1. Overview

            19.1.6.2. Product Portfolio

            19.1.6.3. Profitability by Market Segments (Type/Material/Application/Distribution Channel/Region)

            19.1.6.4. Sales Footprint

            19.1.6.5. Strategy Overview

                19.1.6.5.1. Marketing Strategy

                19.1.6.5.2. Product Strategy

                19.1.6.5.3. Channel Strategy

        19.1.7. The Wine Doctor

            19.1.7.1. Overview

            19.1.7.2. Product Portfolio

            19.1.7.3. Profitability by Market Segments (Type/Material/Application/Distribution Channel/Region)

            19.1.7.4. Sales Footprint

            19.1.7.5. Strategy Overview

                19.1.7.5.1. Marketing Strategy

                19.1.7.5.2. Product Strategy

                19.1.7.5.3. Channel Strategy

        19.1.8. Aquatech BM

            19.1.8.1. Overview

            19.1.8.2. Product Portfolio

            19.1.8.3. Profitability by Market Segments (Type/Material/Application/Distribution Channel/Region)

            19.1.8.4. Sales Footprint

            19.1.8.5. Strategy Overview

                19.1.8.5.1. Marketing Strategy

                19.1.8.5.2. Product Strategy

                19.1.8.5.3. Channel Strategy

        19.1.9. Midwest Supplies LLC

            19.1.9.1. Overview

            19.1.9.2. Product Portfolio

            19.1.9.3. Profitability by Market Segments (Type/Material/Application/Distribution Channel/Region)

            19.1.9.4. Sales Footprint

            19.1.9.5. Strategy Overview

                19.1.9.5.1. Marketing Strategy

                19.1.9.5.2. Product Strategy

                19.1.9.5.3. Channel Strategy

        19.1.10. Presque Isle Wine Cellars

            19.1.10.1. Overview

            19.1.10.2. Product Portfolio

            19.1.10.3. Profitability by Market Segments (Type/Material/Application/Distribution Channel/Region)

            19.1.10.4. Sales Footprint

            19.1.10.5. Strategy Overview

                19.1.10.5.1. Marketing Strategy

                19.1.10.5.2. Product Strategy

                19.1.10.5.3. Channel Strategy

20. Assumptions & Acronyms Used

21. Research Methodolog

List of Tables

Table 1: Global Market Value (US$ million) Forecast by Region, 2018 to 2033

Table 2: Global Market Volume (MT) Forecast by Region, 2018 to 2033

Table 3: Global Market Value (US$ million) Forecast by Type, 2018 to 2033

Table 4: Global Market Volume (MT) Forecast by Type, 2018 to 2033

Table 5: Global Market Value (US$ million) Forecast by Material, 2018 to 2033

Table 6: Global Market Volume (MT) Forecast by Material, 2018 to 2033

Table 7: Global Market Value (US$ million) Forecast by Application, 2018 to 2033

Table 8: Global Market Volume (MT) Forecast by Application, 2018 to 2033

Table 9: Global Market Value (US$ million) Forecast by Distribution Channel, 2018 to 2033

Table 10: Global Market Volume (MT) Forecast by Distribution Channel, 2018 to 2033

Table 11: North America Market Value (US$ million) Forecast by Country, 2018 to 2033

Table 12: North America Market Volume (MT) Forecast by Country, 2018 to 2033

Table 13: North America Market Value (US$ million) Forecast by Type, 2018 to 2033

Table 14: North America Market Volume (MT) Forecast by Type, 2018 to 2033

Table 15: North America Market Value (US$ million) Forecast by Material, 2018 to 2033

Table 16: North America Market Volume (MT) Forecast by Material, 2018 to 2033

Table 17: North America Market Value (US$ million) Forecast by Application, 2018 to 2033

Table 18: North America Market Volume (MT) Forecast by Application, 2018 to 2033

Table 19: North America Market Value (US$ million) Forecast by Distribution Channel, 2018 to 2033

Table 20: North America Market Volume (MT) Forecast by Distribution Channel, 2018 to 2033

Table 21: Latin America Market Value (US$ million) Forecast by Country, 2018 to 2033

Table 22: Latin America Market Volume (MT) Forecast by Country, 2018 to 2033

Table 23: Latin America Market Value (US$ million) Forecast by Type, 2018 to 2033

Table 24: Latin America Market Volume (MT) Forecast by Type, 2018 to 2033

Table 25: Latin America Market Value (US$ million) Forecast by Material, 2018 to 2033

Table 26: Latin America Market Volume (MT) Forecast by Material, 2018 to 2033

Table 27: Latin America Market Value (US$ million) Forecast by Application, 2018 to 2033

Table 28: Latin America Market Volume (MT) Forecast by Application, 2018 to 2033

Table 29: Latin America Market Value (US$ million) Forecast by Distribution Channel, 2018 to 2033

Table 30: Latin America Market Volume (MT) Forecast by Distribution Channel, 2018 to 2033

Table 31: Europe Market Value (US$ million) Forecast by Country, 2018 to 2033

Table 32: Europe Market Volume (MT) Forecast by Country, 2018 to 2033

Table 33: Europe Market Value (US$ million) Forecast by Type, 2018 to 2033

Table 34: Europe Market Volume (MT) Forecast by Type, 2018 to 2033

Table 35: Europe Market Value (US$ million) Forecast by Material, 2018 to 2033

Table 36: Europe Market Volume (MT) Forecast by Material, 2018 to 2033

Table 37: Europe Market Value (US$ million) Forecast by Application, 2018 to 2033

Table 38: Europe Market Volume (MT) Forecast by Application, 2018 to 2033

Table 39: Europe Market Value (US$ million) Forecast by Distribution Channel, 2018 to 2033

Table 40: Europe Market Volume (MT) Forecast by Distribution Channel, 2018 to 2033

Table 41: East Asia Market Value (US$ million) Forecast by Country, 2018 to 2033

Table 42: East Asia Market Volume (MT) Forecast by Country, 2018 to 2033

Table 43: East Asia Market Value (US$ million) Forecast by Type, 2018 to 2033

Table 44: East Asia Market Volume (MT) Forecast by Type, 2018 to 2033

Table 45: East Asia Market Value (US$ million) Forecast by Material, 2018 to 2033

Table 46: East Asia Market Volume (MT) Forecast by Material, 2018 to 2033

Table 47: East Asia Market Value (US$ million) Forecast by Application, 2018 to 2033

Table 48: East Asia Market Volume (MT) Forecast by Application, 2018 to 2033

Table 49: East Asia Market Value (US$ million) Forecast by Distribution Channel, 2018 to 2033

Table 50: East Asia Market Volume (MT) Forecast by Distribution Channel, 2018 to 2033

Table 51: South Asia Market Value (US$ million) Forecast by Country, 2018 to 2033

Table 52: South Asia Market Volume (MT) Forecast by Country, 2018 to 2033

Table 53: South Asia Market Value (US$ million) Forecast by Type, 2018 to 2033

Table 54: South Asia Market Volume (MT) Forecast by Type, 2018 to 2033

Table 55: South Asia Market Value (US$ million) Forecast by Material, 2018 to 2033

Table 56: South Asia Market Volume (MT) Forecast by Material, 2018 to 2033

Table 57: South Asia Market Value (US$ million) Forecast by Application, 2018 to 2033

Table 58: South Asia Market Volume (MT) Forecast by Application, 2018 to 2033

Table 59: South Asia Market Value (US$ million) Forecast by Distribution Channel, 2018 to 2033

Table 60: South Asia Market Volume (MT) Forecast by Distribution Channel, 2018 to 2033

Table 61: Oceania Market Value (US$ million) Forecast by Country, 2018 to 2033

Table 62: Oceania Market Volume (MT) Forecast by Country, 2018 to 2033

Table 63: Oceania Market Value (US$ million) Forecast by Type, 2018 to 2033

Table 64: Oceania Market Volume (MT) Forecast by Type, 2018 to 2033

Table 65: Oceania Market Value (US$ million) Forecast by Material, 2018 to 2033

Table 66: Oceania Market Volume (MT) Forecast by Material, 2018 to 2033

Table 67: Oceania Market Value (US$ million) Forecast by Application, 2018 to 2033

Table 68: Oceania Market Volume (MT) Forecast by Application, 2018 to 2033

Table 69: Oceania Market Value (US$ million) Forecast by Distribution Channel, 2018 to 2033

Table 70: Oceania Market Volume (MT) Forecast by Distribution Channel, 2018 to 2033

Table 71: MEA Market Value (US$ million) Forecast by Country, 2018 to 2033

Table 72: MEA Market Volume (MT) Forecast by Country, 2018 to 2033

Table 73: MEA Market Value (US$ million) Forecast by Type, 2018 to 2033

Table 74: MEA Market Volume (MT) Forecast by Type, 2018 to 2033

Table 75: MEA Market Value (US$ million) Forecast by Material, 2018 to 2033

Table 76: MEA Market Volume (MT) Forecast by Material, 2018 to 2033

Table 77: MEA Market Value (US$ million) Forecast by Application, 2018 to 2033

Table 78: MEA Market Volume (MT) Forecast by Application, 2018 to 2033

Table 79: MEA Market Value (US$ million) Forecast by Distribution Channel, 2018 to 2033

Table 80: MEA Market Volume (MT) Forecast by Distribution Channel, 2018 to 2033

List of Charts

Figure 1: Global Market Value (US$ million) by Type, 2023 to 2033

Figure 2: Global Market Value (US$ million) by Material, 2023 to 2033

Figure 3: Global Market Value (US$ million) by Application, 2023 to 2033

Figure 4: Global Market Value (US$ million) by Distribution Channel, 2023 to 2033

Figure 5: Global Market Value (US$ million) by Region, 2023 to 2033

Figure 6: Global Market Value (US$ million) Analysis by Region, 2018 to 2033

Figure 7: Global Market Volume (MT) Analysis by Region, 2018 to 2033

Figure 8: Global Market Value Share (%) and BPS Analysis by Region, 2023 to 2033

Figure 9: Global Market Y-o-Y Growth (%) Projections by Region, 2023 to 2033

Figure 10: Global Market Value (US$ million) Analysis by Type, 2018 to 2033

Figure 11: Global Market Volume (MT) Analysis by Type, 2018 to 2033

Figure 12: Global Market Value Share (%) and BPS Analysis by Type, 2023 to 2033

Figure 13: Global Market Y-o-Y Growth (%) Projections by Type, 2023 to 2033

Figure 14: Global Market Value (US$ million) Analysis by Material, 2018 to 2033

Figure 15: Global Market Volume (MT) Analysis by Material, 2018 to 2033

Figure 16: Global Market Value Share (%) and BPS Analysis by Material, 2023 to 2033

Figure 17: Global Market Y-o-Y Growth (%) Projections by Material, 2023 to 2033

Figure 18: Global Market Value (US$ million) Analysis by Application, 2018 to 2033

Figure 19: Global Market Volume (MT) Analysis by Application, 2018 to 2033

Figure 20: Global Market Value Share (%) and BPS Analysis by Application, 2023 to 2033

Figure 21: Global Market Y-o-Y Growth (%) Projections by Application, 2023 to 2033

Figure 22: Global Market Value (US$ million) Analysis by Distribution Channel, 2018 to 2033

Figure 23: Global Market Volume (MT) Analysis by Distribution Channel, 2018 to 2033

Figure 24: Global Market Value Share (%) and BPS Analysis by Distribution Channel, 2023 to 2033

Figure 25: Global Market Y-o-Y Growth (%) Projections by Distribution Channel, 2023 to 2033

Figure 26: Global Market Attractiveness by Type, 2023 to 2033

Figure 27: Global Market Attractiveness by Material, 2023 to 2033

Figure 28: Global Market Attractiveness by Application, 2023 to 2033

Figure 29: Global Market Attractiveness by Distribution Channel, 2023 to 2033

Figure 30: Global Market Attractiveness by Region, 2023 to 2033

Figure 31: North America Market Value (US$ million) by Type, 2023 to 2033

Figure 32: North America Market Value (US$ million) by Material, 2023 to 2033

Figure 33: North America Market Value (US$ million) by Application, 2023 to 2033

Figure 34: North America Market Value (US$ million) by Distribution Channel, 2023 to 2033

Figure 35: North America Market Value (US$ million) by Country, 2023 to 2033

Figure 36: North America Market Value (US$ million) Analysis by Country, 2018 to 2033

Figure 37: North America Market Volume (MT) Analysis by Country, 2018 to 2033

Figure 38: North America Market Value Share (%) and BPS Analysis by Country, 2023 to 2033

Figure 39: North America Market Y-o-Y Growth (%) Projections by Country, 2023 to 2033

Figure 40: North America Market Value (US$ million) Analysis by Type, 2018 to 2033

Figure 41: North America Market Volume (MT) Analysis by Type, 2018 to 2033

Figure 42: North America Market Value Share (%) and BPS Analysis by Type, 2023 to 2033

Figure 43: North America Market Y-o-Y Growth (%) Projections by Type, 2023 to 2033

Figure 44: North America Market Value (US$ million) Analysis by Material, 2018 to 2033

Figure 45: North America Market Volume (MT) Analysis by Material, 2018 to 2033

Figure 46: North America Market Value Share (%) and BPS Analysis by Material, 2023 to 2033

Figure 47: North America Market Y-o-Y Growth (%) Projections by Material, 2023 to 2033

Figure 48: North America Market Value (US$ million) Analysis by Application, 2018 to 2033

Figure 49: North America Market Volume (MT) Analysis by Application, 2018 to 2033

Figure 50: North America Market Value Share (%) and BPS Analysis by Application, 2023 to 2033

Figure 51: North America Market Y-o-Y Growth (%) Projections by Application, 2023 to 2033

Figure 52: North America Market Value (US$ million) Analysis by Distribution Channel, 2018 to 2033

Figure 53: North America Market Volume (MT) Analysis by Distribution Channel, 2018 to 2033

Figure 54: North America Market Value Share (%) and BPS Analysis by Distribution Channel, 2023 to 2033

Figure 55: North America Market Y-o-Y Growth (%) Projections by Distribution Channel, 2023 to 2033

Figure 56: North America Market Attractiveness by Type, 2023 to 2033

Figure 57: North America Market Attractiveness by Material, 2023 to 2033

Figure 58: North America Market Attractiveness by Application, 2023 to 2033

Figure 59: North America Market Attractiveness by Distribution Channel, 2023 to 2033

Figure 60: North America Market Attractiveness by Country, 2023 to 2033

Figure 61: Latin America Market Value (US$ million) by Type, 2023 to 2033

Figure 62: Latin America Market Value (US$ million) by Material, 2023 to 2033

Figure 63: Latin America Market Value (US$ million) by Application, 2023 to 2033

Figure 64: Latin America Market Value (US$ million) by Distribution Channel, 2023 to 2033

Figure 65: Latin America Market Value (US$ million) by Country, 2023 to 2033

Figure 66: Latin America Market Value (US$ million) Analysis by Country, 2018 to 2033

Figure 67: Latin America Market Volume (MT) Analysis by Country, 2018 to 2033

Figure 68: Latin America Market Value Share (%) and BPS Analysis by Country, 2023 to 2033

Figure 69: Latin America Market Y-o-Y Growth (%) Projections by Country, 2023 to 2033

Figure 70: Latin America Market Value (US$ million) Analysis by Type, 2018 to 2033

Figure 71: Latin America Market Volume (MT) Analysis by Type, 2018 to 2033

Figure 72: Latin America Market Value Share (%) and BPS Analysis by Type, 2023 to 2033

Figure 73: Latin America Market Y-o-Y Growth (%) Projections by Type, 2023 to 2033

Figure 74: Latin America Market Value (US$ million) Analysis by Material, 2018 to 2033

Figure 75: Latin America Market Volume (MT) Analysis by Material, 2018 to 2033

Figure 76: Latin America Market Value Share (%) and BPS Analysis by Material, 2023 to 2033

Figure 77: Latin America Market Y-o-Y Growth (%) Projections by Material, 2023 to 2033

Figure 78: Latin America Market Value (US$ million) Analysis by Application, 2018 to 2033

Figure 79: Latin America Market Volume (MT) Analysis by Application, 2018 to 2033

Figure 80: Latin America Market Value Share (%) and BPS Analysis by Application, 2023 to 2033

Figure 81: Latin America Market Y-o-Y Growth (%) Projections by Application, 2023 to 2033

Figure 82: Latin America Market Value (US$ million) Analysis by Distribution Channel, 2018 to 2033

Figure 83: Latin America Market Volume (MT) Analysis by Distribution Channel, 2018 to 2033

Figure 84: Latin America Market Value Share (%) and BPS Analysis by Distribution Channel, 2023 to 2033

Figure 85: Latin America Market Y-o-Y Growth (%) Projections by Distribution Channel, 2023 to 2033

Figure 86: Latin America Market Attractiveness by Type, 2023 to 2033

Figure 87: Latin America Market Attractiveness by Material, 2023 to 2033

Figure 88: Latin America Market Attractiveness by Application, 2023 to 2033

Figure 89: Latin America Market Attractiveness by Distribution Channel, 2023 to 2033

Figure 90: Latin America Market Attractiveness by Country, 2023 to 2033

Figure 91: Europe Market Value (US$ million) by Type, 2023 to 2033

Figure 92: Europe Market Value (US$ million) by Material, 2023 to 2033

Figure 93: Europe Market Value (US$ million) by Application, 2023 to 2033

Figure 94: Europe Market Value (US$ million) by Distribution Channel, 2023 to 2033

Figure 95: Europe Market Value (US$ million) by Country, 2023 to 2033

Figure 96: Europe Market Value (US$ million) Analysis by Country, 2018 to 2033

Figure 97: Europe Market Volume (MT) Analysis by Country, 2018 to 2033

Figure 98: Europe Market Value Share (%) and BPS Analysis by Country, 2023 to 2033

Figure 99: Europe Market Y-o-Y Growth (%) Projections by Country, 2023 to 2033

Figure 100: Europe Market Value (US$ million) Analysis by Type, 2018 to 2033

Figure 101: Europe Market Volume (MT) Analysis by Type, 2018 to 2033

Figure 102: Europe Market Value Share (%) and BPS Analysis by Type, 2023 to 2033

Figure 103: Europe Market Y-o-Y Growth (%) Projections by Type, 2023 to 2033

Figure 104: Europe Market Value (US$ million) Analysis by Material, 2018 to 2033

Figure 105: Europe Market Volume (MT) Analysis by Material, 2018 to 2033

Figure 106: Europe Market Value Share (%) and BPS Analysis by Material, 2023 to 2033

Figure 107: Europe Market Y-o-Y Growth (%) Projections by Material, 2023 to 2033

Figure 108: Europe Market Value (US$ million) Analysis by Application, 2018 to 2033

Figure 109: Europe Market Volume (MT) Analysis by Application, 2018 to 2033

Figure 110: Europe Market Value Share (%) and BPS Analysis by Application, 2023 to 2033

Figure 111: Europe Market Y-o-Y Growth (%) Projections by Application, 2023 to 2033

Figure 112: Europe Market Value (US$ million) Analysis by Distribution Channel, 2018 to 2033

Figure 113: Europe Market Volume (MT) Analysis by Distribution Channel, 2018 to 2033

Figure 114: Europe Market Value Share (%) and BPS Analysis by Distribution Channel, 2023 to 2033

Figure 115: Europe Market Y-o-Y Growth (%) Projections by Distribution Channel, 2023 to 2033

Figure 116: Europe Market Attractiveness by Type, 2023 to 2033

Figure 117: Europe Market Attractiveness by Material, 2023 to 2033

Figure 118: Europe Market Attractiveness by Application, 2023 to 2033

Figure 119: Europe Market Attractiveness by Distribution Channel, 2023 to 2033

Figure 120: Europe Market Attractiveness by Country, 2023 to 2033

Figure 121: East Asia Market Value (US$ million) by Type, 2023 to 2033

Figure 122: East Asia Market Value (US$ million) by Material, 2023 to 2033

Figure 123: East Asia Market Value (US$ million) by Application, 2023 to 2033

Figure 124: East Asia Market Value (US$ million) by Distribution Channel, 2023 to 2033

Figure 125: East Asia Market Value (US$ million) by Country, 2023 to 2033

Figure 126: East Asia Market Value (US$ million) Analysis by Country, 2018 to 2033

Figure 127: East Asia Market Volume (MT) Analysis by Country, 2018 to 2033

Figure 128: East Asia Market Value Share (%) and BPS Analysis by Country, 2023 to 2033

Figure 129: East Asia Market Y-o-Y Growth (%) Projections by Country, 2023 to 2033

Figure 130: East Asia Market Value (US$ million) Analysis by Type, 2018 to 2033

Figure 131: East Asia Market Volume (MT) Analysis by Type, 2018 to 2033

Figure 132: East Asia Market Value Share (%) and BPS Analysis by Type, 2023 to 2033

Figure 133: East Asia Market Y-o-Y Growth (%) Projections by Type, 2023 to 2033

Figure 134: East Asia Market Value (US$ million) Analysis by Material, 2018 to 2033

Figure 135: East Asia Market Volume (MT) Analysis by Material, 2018 to 2033

Figure 136: East Asia Market Value Share (%) and BPS Analysis by Material, 2023 to 2033

Figure 137: East Asia Market Y-o-Y Growth (%) Projections by Material, 2023 to 2033

Figure 138: East Asia Market Value (US$ million) Analysis by Application, 2018 to 2033

Figure 139: East Asia Market Volume (MT) Analysis by Application, 2018 to 2033

Figure 140: East Asia Market Value Share (%) and BPS Analysis by Application, 2023 to 2033

Figure 141: East Asia Market Y-o-Y Growth (%) Projections by Application, 2023 to 2033

Figure 142: East Asia Market Value (US$ million) Analysis by Distribution Channel, 2018 to 2033

Figure 143: East Asia Market Volume (MT) Analysis by Distribution Channel, 2018 to 2033

Figure 144: East Asia Market Value Share (%) and BPS Analysis by Distribution Channel, 2023 to 2033

Figure 145: East Asia Market Y-o-Y Growth (%) Projections by Distribution Channel, 2023 to 2033

Figure 146: East Asia Market Attractiveness by Type, 2023 to 2033

Figure 147: East Asia Market Attractiveness by Material, 2023 to 2033

Figure 148: East Asia Market Attractiveness by Application, 2023 to 2033

Figure 149: East Asia Market Attractiveness by Distribution Channel, 2023 to 2033

Figure 150: East Asia Market Attractiveness by Country, 2023 to 2033

Figure 151: South Asia Market Value (US$ million) by Type, 2023 to 2033

Figure 152: South Asia Market Value (US$ million) by Material, 2023 to 2033

Figure 153: South Asia Market Value (US$ million) by Application, 2023 to 2033

Figure 154: South Asia Market Value (US$ million) by Distribution Channel, 2023 to 2033

Figure 155: South Asia Market Value (US$ million) by Country, 2023 to 2033

Figure 156: South Asia Market Value (US$ million) Analysis by Country, 2018 to 2033

Figure 157: South Asia Market Volume (MT) Analysis by Country, 2018 to 2033

Figure 158: South Asia Market Value Share (%) and BPS Analysis by Country, 2023 to 2033

Figure 159: South Asia Market Y-o-Y Growth (%) Projections by Country, 2023 to 2033

Figure 160: South Asia Market Value (US$ million) Analysis by Type, 2018 to 2033

Figure 161: South Asia Market Volume (MT) Analysis by Type, 2018 to 2033

Figure 162: South Asia Market Value Share (%) and BPS Analysis by Type, 2023 to 2033

Figure 163: South Asia Market Y-o-Y Growth (%) Projections by Type, 2023 to 2033

Figure 164: South Asia Market Value (US$ million) Analysis by Material, 2018 to 2033

Figure 165: South Asia Market Volume (MT) Analysis by Material, 2018 to 2033

Figure 166: South Asia Market Value Share (%) and BPS Analysis by Material, 2023 to 2033

Figure 167: South Asia Market Y-o-Y Growth (%) Projections by Material, 2023 to 2033

Figure 168: South Asia Market Value (US$ million) Analysis by Application, 2018 to 2033

Figure 169: South Asia Market Volume (MT) Analysis by Application, 2018 to 2033

Figure 170: South Asia Market Value Share (%) and BPS Analysis by Application, 2023 to 2033

Figure 171: South Asia Market Y-o-Y Growth (%) Projections by Application, 2023 to 2033

Figure 172: South Asia Market Value (US$ million) Analysis by Distribution Channel, 2018 to 2033

Figure 173: South Asia Market Volume (MT) Analysis by Distribution Channel, 2018 to 2033

Figure 174: South Asia Market Value Share (%) and BPS Analysis by Distribution Channel, 2023 to 2033

Figure 175: South Asia Market Y-o-Y Growth (%) Projections by Distribution Channel, 2023 to 2033

Figure 176: South Asia Market Attractiveness by Type, 2023 to 2033

Figure 177: South Asia Market Attractiveness by Material, 2023 to 2033

Figure 178: South Asia Market Attractiveness by Application, 2023 to 2033

Figure 179: South Asia Market Attractiveness by Distribution Channel, 2023 to 2033

Figure 180: South Asia Market Attractiveness by Country, 2023 to 2033

Figure 181: Oceania Market Value (US$ million) by Type, 2023 to 2033

Figure 182: Oceania Market Value (US$ million) by Material, 2023 to 2033

Figure 183: Oceania Market Value (US$ million) by Application, 2023 to 2033

Figure 184: Oceania Market Value (US$ million) by Distribution Channel, 2023 to 2033

Figure 185: Oceania Market Value (US$ million) by Country, 2023 to 2033

Figure 186: Oceania Market Value (US$ million) Analysis by Country, 2018 to 2033

Figure 187: Oceania Market Volume (MT) Analysis by Country, 2018 to 2033

Figure 188: Oceania Market Value Share (%) and BPS Analysis by Country, 2023 to 2033

Figure 189: Oceania Market Y-o-Y Growth (%) Projections by Country, 2023 to 2033

Figure 190: Oceania Market Value (US$ million) Analysis by Type, 2018 to 2033

Figure 191: Oceania Market Volume (MT) Analysis by Type, 2018 to 2033

Figure 192: Oceania Market Value Share (%) and BPS Analysis by Type, 2023 to 2033

Figure 193: Oceania Market Y-o-Y Growth (%) Projections by Type, 2023 to 2033

Figure 194: Oceania Market Value (US$ million) Analysis by Material, 2018 to 2033

Figure 195: Oceania Market Volume (MT) Analysis by Material, 2018 to 2033

Figure 196: Oceania Market Value Share (%) and BPS Analysis by Material, 2023 to 2033

Figure 197: Oceania Market Y-o-Y Growth (%) Projections by Material, 2023 to 2033

Figure 198: Oceania Market Value (US$ million) Analysis by Application, 2018 to 2033

Figure 199: Oceania Market Volume (MT) Analysis by Application, 2018 to 2033

Figure 200: Oceania Market Value Share (%) and BPS Analysis by Application, 2023 to 2033

Figure 201: Oceania Market Y-o-Y Growth (%) Projections by Application, 2023 to 2033

Figure 202: Oceania Market Value (US$ million) Analysis by Distribution Channel, 2018 to 2033

Figure 203: Oceania Market Volume (MT) Analysis by Distribution Channel, 2018 to 2033

Figure 204: Oceania Market Value Share (%) and BPS Analysis by Distribution Channel, 2023 to 2033

Figure 205: Oceania Market Y-o-Y Growth (%) Projections by Distribution Channel, 2023 to 2033

Figure 206: Oceania Market Attractiveness by Type, 2023 to 2033

Figure 207: Oceania Market Attractiveness by Material, 2023 to 2033

Figure 208: Oceania Market Attractiveness by Application, 2023 to 2033

Figure 209: Oceania Market Attractiveness by Distribution Channel, 2023 to 2033

Figure 210: Oceania Market Attractiveness by Country, 2023 to 2033

Figure 211: MEA Market Value (US$ million) by Type, 2023 to 2033

Figure 212: MEA Market Value (US$ million) by Material, 2023 to 2033

Figure 213: MEA Market Value (US$ million) by Application, 2023 to 2033

Figure 214: MEA Market Value (US$ million) by Distribution Channel, 2023 to 2033

Figure 215: MEA Market Value (US$ million) by Country, 2023 to 2033

Figure 216: MEA Market Value (US$ million) Analysis by Country, 2018 to 2033

Figure 217: MEA Market Volume (MT) Analysis by Country, 2018 to 2033

Figure 218: MEA Market Value Share (%) and BPS Analysis by Country, 2023 to 2033

Figure 219: MEA Market Y-o-Y Growth (%) Projections by Country, 2023 to 2033

Figure 220: MEA Market Value (US$ million) Analysis by Type, 2018 to 2033

Figure 221: MEA Market Volume (MT) Analysis by Type, 2018 to 2033

Figure 222: MEA Market Value Share (%) and BPS Analysis by Type, 2023 to 2033

Figure 223: MEA Market Y-o-Y Growth (%) Projections by Type, 2023 to 2033

Figure 224: MEA Market Value (US$ million) Analysis by Material, 2018 to 2033

Figure 225: MEA Market Volume (MT) Analysis by Material, 2018 to 2033

Figure 226: MEA Market Value Share (%) and BPS Analysis by Material, 2023 to 2033

Figure 227: MEA Market Y-o-Y Growth (%) Projections by Material, 2023 to 2033

Figure 228: MEA Market Value (US$ million) Analysis by Application, 2018 to 2033

Figure 229: MEA Market Volume (MT) Analysis by Application, 2018 to 2033

Figure 230: MEA Market Value Share (%) and BPS Analysis by Application, 2023 to 2033

Figure 231: MEA Market Y-o-Y Growth (%) Projections by Application, 2023 to 2033

Figure 232: MEA Market Value (US$ million) Analysis by Distribution Channel, 2018 to 2033

Figure 233: MEA Market Volume (MT) Analysis by Distribution Channel, 2018 to 2033

Figure 234: MEA Market Value Share (%) and BPS Analysis by Distribution Channel, 2023 to 2033

Figure 235: MEA Market Y-o-Y Growth (%) Projections by Distribution Channel, 2023 to 2033

Figure 236: MEA Market Attractiveness by Type, 2023 to 2033

Figure 237: MEA Market Attractiveness by Material, 2023 to 2033

Figure 238: MEA Market Attractiveness by Application, 2023 to 2033

Figure 239: MEA Market Attractiveness by Distribution Channel, 2023 to 2033

Figure 240: MEA Market Attractiveness by Country, 2023 to 2033

Explore Process Automation Insights

View Reports

Wine Bottle Sterilizer Market