Reports

- Global Locations -

Headquarters

Future Market Insights, Inc.

Christiana Corporate, 200
Continental Drive, Suite 401,
Newark, Delaware - 19713,
United States

T: +1-845-579-5705

Americas

Future Market Insights, Inc.

616 Corporate Way, Suite 2-9018,
Valley Cottage, NY 10989, United States

T: +1-347-918-3531

MEA

Future Market Insights

1602-6 Jumeirah Bay X2 Tower, Plot No: JLT-PH2-X2A,
Jumeirah Lakes Towers, Dubai,
United Arab Emirates

Europe

Future Market Insights

3rd Floor, 207 Regent Street,
W1B 3HH London
United Kingdom

T: + 44 (0) 20 8123 9659
D: +44 (0) 20 3287 4268

Asia Pacific

Future Market Insights

Office No. 401-A, 4th Floor,
VANTAGE 9, S.No. 36/1/1,
Baner, Pune 411045, India

Wine Packaging Market Outlook (2022-2032)

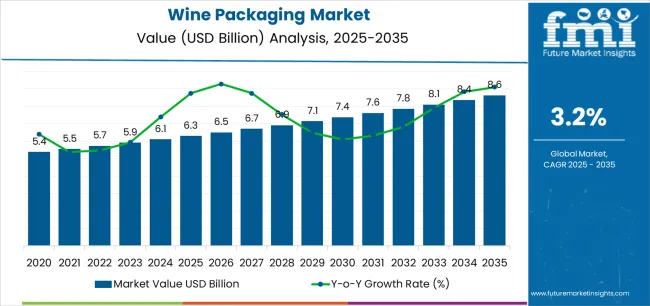
[300 Pages Report] Global wine packaging market is expected to grow at a CAGR of 5.4% during the forecast period (2022-2032). The market value is projected to increase from US$ 3.4 Bn in 2022 to US$ 5.7 Bn by 2032. Global wine packaging sales were valued at around US$ 3.3 Bn at the end of 2021 and expanded by 2x compared to past decade.

Attribute Details
Wine Packaging Market Size 2022 US$ 3.4 Billion
Market Size 2032 US$ 5.7 Billion
Value CAGR (2022-2032) 5.4%
Collective Value Share: Top 3 Countries (2022E) 35.6%

The global wine packaging market constitutes 3% of the packaging market worth US$ 130 Bn in 2022, according to Future Market Insights (FMI). Newly released data from wine packaging market analysis shows that revenues in the barrels & kegs segment of the wine packaging market grew a robust 2.8% year over year in 2021.

Demand for bag-in-box segment increased at 4.1% CAGR between 2020 and 2021, giving the combined wine packaging markets year-over-year growth of 3.2% in 2021.

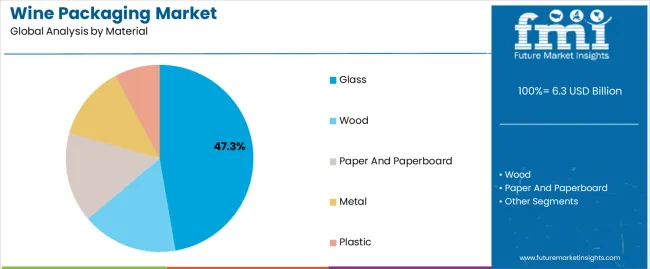
The glass in the global wine packaging market is expected to hold a market share of 33.8% by 2032 and cans & bag-in-box product type segment is anticipated to grow at 6.0% CAGR and 5.6% CAGR respectively during the forecast period.

The U.S. market is expected to witness an incremental growth of 1.6x of current value during the forecast period. The wine packaging market value share in North America is expected to account for 27% in 2022. While, China and Germany wine packaging market are expected to expand by 6.8% CAGR and 5.9% CAGR, respectively, over the forecast period.

Don't pay for what you don't need

Customize your report by selecting specific countries or regions and save 30%!

Wine Packaging Market Sales Analysis (2016-2021) Vs Demand Forecast (2022-2032)

Wine packaging is to protect and preserve the quality of wine stored within it and should be inert with respect to flavour migration from the package to the product and vice-versa. The wine packaging is available in several forms such as bottles, cans, bag-in-box, barrels & wine packaging, and others.

Consumers while purchasing wine look for aspects such as packaging, retail shelf, labelling, etc. The wine packaging not only protects and preserves the wine from within, it is also used as marketing tool.

Wine packaging is way to influence the customer’s perception and ultimately acceptance of the product. With wine, the package itself appears to have a greater influence over the consumer than other extrinsic cues such as brand name, price, etc. The wine packaging market is anticipated to rise at 5.4% CAGR from 2022 to 2032, according to FMI.

Wine Packaging Market

According to the International Organisation of Vine and Wine Intergovernmental Organisation, in 2021 world wine production is estimated between 247.1 and 253.5 mhl (million hectolitres). Expansion of e-commerce industry is boosting the wine packaging market. The Covid-19 pandemic has given an extra boost as more people turned to shop wine online, driving the durable, sustainable, and consumer friendly packaging that protects the product during the shipment.

Hence, key manufacturers are specially designing sustainable, custom-made, and consumer friendly wine packaging for e-commerce to cater to the growing demand. Nowadays, the manufacturers are focusing on sustainable wine packaging.

Will Rising Sustainability Trend Positively Influence the Wine Packaging Market?

Wine packaging is vital for the conservation of quality and nowadays to promote a more sustainable culture. Due to the current climate crisis, preference for sustainable packaging solutions is surging.

Campaigns regarding preserving forests and saving natural resources from depletion have given rise to the demand for sustainable products and packaging of the product. Hence, manufacturers are focusing on sustainable packaging solutions to support a healthy planet.

For instance, in August 2021, Mondi Plc, expanded the eGrocery portfolio with sustainable wine bottle shipping solutions.  Also, in October 2020, Frugal Limited launched the world’s first wine paper bottle made of 94% recycled material.

Ismail Sutaria
Ismail Sutaria

Principal Consultant

Talk to Analyst

Find your sweet spots for generating winning opportunities in this market.

How will Rising Alcohol Consumption Propel the Demand in Wine Packaging Market?

Demand for alcoholic beverages such as wine among the Gen-Z’s and millennials has witnessed remarkable growth in recent years. As the number of alcohol serving facilities has increased, the demand in packaging market is increasing. Rising consumption and buying patterns of wine has a significant impact on the demand for wine packaging.

Adoption of western culture and buying habits are significantly changing across the globe. Hence, as the demand and consumption for wine registers growth in western parts of the world, the wine packaging market is anticipated to expand over the forthcoming decade.

What is the Impact of the Russia-Ukraine Conflict on the Global Wine Packaging Market?

The consequences of the Russian invasion of Ukraine impacted the disruption of the supply chain in the Europe market. The severe slowdown in the Ukraine’s economy, and stop in production will affect the domestic wine and beer companies which are already struggling under high wine packaging material costs.

The escalating rife between Russia and Ukraine is anticipated to impact the barley prices due to raw material shortage and disruptions in logistics, sourcing will lead to inflation pressures and indirectly affect the wine packaging industry. The extreme uncertainty, tension, and the risk to the global supply chain will project a shockwave throughout the wine packaging market 

Get the data you need at a Fraction of the cost

Personalize your report by choosing insights you need
and save 40%!

Why is North America Considered One of the Most Lucrative Markets for Wine Packaging?

The wine packaging popularity in North America is growing due to the massive consumption of wine due to various festivals, social & corporate events, picnics, and others. The growing inclination towards one-time use trend, online wine ordering, ready-to-go beverages, and quick delivery will propel the demand for safe and reliable wine packaging in North America.

Country-wise Insights

Why is Demand for Wine Packaging Increasing in the U.S.?

Growing Consumption of Wine in the U.S. to Facilitate Wine Packaging Market Demand

According to FMI analysis, the U.S. is anticipated to hold 14% of total sales in the global wine packaging market by 2032. According to Wine Institute, in 2020 U.S. wine consumption was 1 billion gallons. The U.S. is the fourth-largest producer of wine and the largest consumer of wine in the world.

To meet the growing wine demand, the U.S. wine packaging manufacturers such as Ardagh Group is seen an increase in domestic wine bottles ordered. This company offers a wide range of wine bottles and continues to deliver innovative wine packaging and wine packaging designs. Other U.S. manufacturers such as Gallo Glass are investing in their facilities to service the Californian wine industry, which currently accounts for roughly 81% of the country’s wine.

How Big Is the Opportunity for Wine Packaging Market in Italy?

Italy to Spearhead the Growth in Wine Packaging Market between 2022 and 2032

Italy is estimated to register a CAGR of 6.7% during 2022-2032, as per the study. According to the Amfori, in terms of volume and exports Italy is the leading wine-producing country. In 2019, Italy produced around 19% of the world’s wine.

In terms of wine production, Italy’s geographical territory spans around twenty wine-producing regions. On the back of this factor, the Italian market is estimated to propel the demand for wine packaging.

Category-wise Insights

Which Material is Most Preferred for Wine Packaging?

Preference for Aesthetic Packaging to Improve the Demand for Glass Wine Packaging Material

By material, glass is estimated to register a market share of 35% in 2022. Glass remains the best choice for wine packaging among end users. Glass is the proven and trusted packaging for health, taste, and the environment.

It can be recycled endlessly without loss in quality. As there is no interaction between glass packaging and wine to affect the flavour & aroma as glass is nonporous and impermeable, and adds to the aesthetics and overall drinking experience. Glass is used to produce bottles that are widely used in wine packaging.

Which Product Type Will Offer Lucrative Growth Prospects for Global Wine Packaging Market?

Sales of Wine in Bottles to Outpace the Demand for Wine in Barrels & Kegs

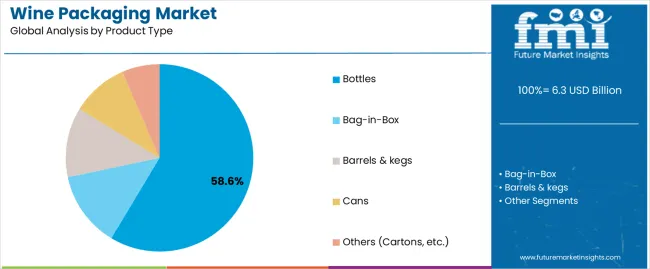
Bottles and barrels are considered to be the leading product types for the wine packaging market. Most of the wine improve in quality during barrel and bottle storage. Bottles are incredibly adaptable, in whichever shape, size, and color, and can be personalized with a variety of labels & decorations.

On the other hand, barrels are used for the aging of wines. After fermentation wine is stored in the barrels making it smooth for further consumption. The bottles and barrels & kegs segment are anticipated to hold 28 % and 33% of the market share respectively throughout the forecast period.

Competitive Landscape

Key manufacturers operating in the wine packaging market are trying to focus on innovative product launches, acquisitions, partnerships, and sustainability. The manufacturers are committed to consistently offering innovative designs, shapes, sizes, and product types for wine packaging

  • In March 2022, Vidrala S.A. partnered with Glass Hallmark. The company has embossed its bottles with a Glass Hallmark seal. The Glass Hallmark symbolizes a commitment to creating a sustainable future using glass. This aligns with the company’s sustainability strategy.
  • In March 2022, Ardagh Group S.A., to design and manufacture a highly decorated wine bottle collaborated with Constellation Brands, Inc.
  • In January 2022, Frugalpac Limited launched its second wine bottle called Celi. It is the world’s first commercially available paper bottle for wines.
  • In November 2021, Ardagh Group S.A. the leader producer of glass packaging acquired Consol Holdings Proprietary Limited on the African continent.

Scope of Report

Attribute Details
Forecast Period 2015 to 2021
Historical Data Available for 2022 to 2032
Market Analysis US$ Million for Value and Units for Volume
Key Regions Covered North America, Latin America, Europe, Middle East and Africa, East Asia, South Asia and Oceania
Key Countries Covered The USA, Canada, Brazil, Mexico, Germany, Italy, France, U.K., Spain, Russia, Turkey, South Africa, GCC Countries, Japan, South Korea, India, China, and Australia
Key Segments Covered Material, Product Type, Sales Channel, and Region
Key Companies Profiled
  • Owens-Illinois Group
  • Ardagh Group S.A.
  • Liqui-Box Corp
  • Scholle Corporation
  • All American Containers
  • TricorBraun Inc.
  • Smurfit Kappa Group
  • Mondi Plc
  • Berlin Packaging
  • Ball Corporation
  • Encore Glass, Inc.
  • International Paper Company
  • Trivium Packaging
  • Brick Packaging
  • DS Smith
  • WestRock Company
  • Frugalpac Limited
  • Vidrala S.A.
Report Coverage Market Forecast, Company Share Analysis, Competition Intelligence, DROT Analysis, Market Dynamics and Challenges, and Strategic Growth Initiatives

Wine Packaging Market by Category

By Material:

  • Glass
  • Wood
  • Paper and Paperboard
  • Metal
  • Plastic

By Product Type:

  • Bottles
  • Bag-in-Box
  • Barrels & kegs
  • Cans
  • Others (Cartons, etc.)

By Sales Channel:

  • Online Retail
  • Offline Retail

By Region:

  • North America
  • Latin America
  • Europe
  • Middle East and Africa
  • East Asia
  • South Asia
  • Oceania

Frequently Asked Questions

The market valuation of wine packaging is expected to be US$ 3.4 Bn by 2022.

As per FMI, the global market for wine packaging is projected to expand at a CAGR of 5.4% between 2022 and 2032.

The U.S., France, Italy, Germany, and China are among leading markets for wine packaging, exhibiting consistently high demand.

Rising consumption of alcoholic beverages across the continents is driving the market.

The North America market is projected to hold approximately 27.4% of the global wine packaging market share in 2022.

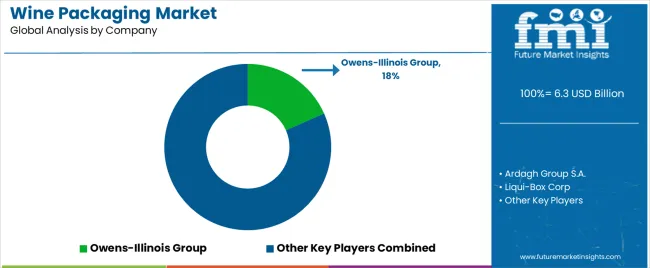
The top five companies operating in the wine packaging market are Owens-Illinois Group, Ardagh Group S.A., Liqui-Box Corp, Smurfit Kappa Group, and Mondi Plc.

Table of Content

1. Executive Summary

    1.1. Global Market Outlook

    1.2. Demand-side Trends

    1.3. Supply-side Trends

    1.4. Technology Roadmap Analysis

    1.5. Analysis and Recommendations

2. Market Overview

    2.1. Market Coverage / Taxonomy

    2.2. Market Definition / Scope / Limitations

3. Market Background

    3.1. Market Dynamics

        3.1.1. Drivers

        3.1.2. Restraints

        3.1.3. Opportunity 

        3.1.4. Trends

    3.2. Scenario Forecast

        3.2.1. Demand in Optimistic Scenario

        3.2.2. Demand in Likely Scenario

        3.2.3. Demand in Conservative Scenario

    3.3. Global Packaging Industry Analysis

    3.4. Key Industry Perspective: What Industry Leaders are Saying?

    3.5. Value Chain Analysis

        3.5.1. Exhaustive List of Active Participants

            3.5.1.1. List of Raw Material Suppliers 

            3.5.1.2. List of Manufacturers/Converters

            3.5.1.3. List of End Users (Existing and Potential Buyer)

        3.5.2. Profitability Margins

    3.6. Forecast Factors -Relevance and impact 

    3.7. Macro-Economic Factors

    3.8. Regulatory landscape

    3.9. Regional Parent Outlook 

    3.10. Consumers Survey Analysis

4. Global Wine Packaging Market Analysis 2016-2021and Forecast, 2022-2032

    4.1. Historical Market Size Value (US$ Mn)  & Volume (Units) Analysis, 2016-2021

    4.2. Current and Future Market Size Value (US$ Mn)  & Volume (Units) Projections, 2022-2032

        4.2.1. Y-o-Y Growth Trend Analysis

        4.2.2. Absolute $ Opportunity Analysis

5. Global Wine Packaging Market Analysis 2016-2021and Forecast 2022-2032, By Material

    5.1. Introduction / Key Findings

    5.2. Historical Market Size Value (US$ Mn)  & Volume (Units) Analysis By Material, 2016-2021

    5.3. Current and Future Market Size Value (US$ Mn)  & Volume (Units) Analysis and Forecast By Material, 2022-2032

        5.3.1. Glass

        5.3.2. Wood

        5.3.3. Paper & Paperboard

        5.3.4. Metal

        5.3.5. Plastic

    5.4. Y-o-Y Growth Trend Analysis By Material, 2016-2021

    5.5. Absolute $ Opportunity Analysis By Material, 2022-2032

6. Global Wine Packaging Market Analysis 2016-2021and Forecast 2022-2032, By Product Type

    6.1. Introduction / Key Findings

    6.2. Historical Market Size Value (US$ Mn)  & Volume (Units) Analysis By Product Type, 2016-2021

    6.3. Current and Future Market Size Value (US$ Mn)  & Volume (Units) Analysis and Forecast By Product Type, 2022-2032

        6.3.1. Bottles

        6.3.2. Bag-in-Box

        6.3.3. Barrels & Kegs

        6.3.4. Cans

        6.3.5. Others (Cartons, etc.)

    6.4. Y-o-Y Growth Trend Analysis By Product Type, 2016-2021

    6.5. Absolute $ Opportunity Analysis By Product Type, 2022-2032

7. Global Wine Packaging Market Analysis 2016-2021and Forecast 2022-2032, By Sales Channel

    7.1. Introduction / Key Findings

    7.2. Historical Market Size Value (US$ Mn)  & Volume (Units) Analysis By Sales Channel, 2016-2021

    7.3. Current and Future Market Size Value (US$ Mn)  & Volume (Units) Analysis and Forecast By Sales Channel, 2022-2032

        7.3.1. Online Retail

        7.3.2. Offline Retail

    7.4. Y-o-Y Growth Trend Analysis By Sales Channel, 2016-2021

    7.5. Absolute $ Opportunity Analysis By Sales Channel, 2022-2032

8. Global Wine Packaging Market Analysis 2016-2021and Forecast 2022-2032, By Region

    8.1. Introduction

    8.2. Historical Market Size Value (US$ Mn)  & Volume (Units) Analysis By Region, 2016-2021

    8.3. Current Market Size Value (US$ Mn)  & Volume (Units) Analysis and Forecast By Region, 2022-2032

        8.3.1. North America

        8.3.2. Latin America

        8.3.3. Europe

        8.3.4. East Asia

        8.3.5. South Asia

        8.3.6. Oceania

        8.3.7. MEA

    8.4. Market Attractiveness Analysis By Region

9. North America Wine Packaging Market Analysis 2016-2021and Forecast 2022-2032, By Country

    9.1. Historical Market Size Value (US$ Mn)  & Volume (Units) Trend Analysis By Market Taxonomy, 2016-2021

    9.2. Market Size Value (US$ Mn)  & Volume (Units) Forecast By Market Taxonomy, 2022-2032

        9.2.1. By Country

            9.2.1.1. U.S.

            9.2.1.2. Canada

        9.2.2. By Material

        9.2.3. By Product Type

        9.2.4. By Sales Channel

    9.3. Market Attractiveness Analysis

        9.3.1. By Country

        9.3.2. By Material

        9.3.3. By Product Type

        9.3.4. By Sales Channel

    9.4. Key Takeaways

10. Latin America Wine Packaging Market Analysis 2016-2021and Forecast 2022-2032, By Country

    10.1. Historical Market Size Value (US$ Mn)  & Volume (Units) Trend Analysis By Market Taxonomy, 2016-2021

    10.2. Market Size Value (US$ Mn)  & Volume (Units) Forecast By Market Taxonomy, 2022-2032

        10.2.1. By Country

            10.2.1.1. Brazil

            10.2.1.2. Mexico

            10.2.1.3. Argentina

            10.2.1.4. Rest of Latin America

        10.2.2. By Material

        10.2.3. By Product Type

        10.2.4. By Sales Channel

    10.3. Market Attractiveness Analysis

        10.3.1. By Country

        10.3.2. By Material

        10.3.3. By Product Type

        10.3.4. By Sales Channel

    10.4. Key Takeaways

11. Europe Wine Packaging Market Analysis 2016-2021and Forecast 2022-2032, By Country

    11.1. Historical Market Size Value (US$ Mn)  & Volume (Units) Trend Analysis By Market Taxonomy, 2016-2021

    11.2. Market Size Value (US$ Mn)  & Volume (Units) Forecast By Market Taxonomy, 2022-2032

        11.2.1. By Country

            11.2.1.1. Germany

            11.2.1.2. Italy

            11.2.1.3. France

            11.2.1.4. U.K.

            11.2.1.5. Spain

            11.2.1.6. Russia

            11.2.1.7. BENELUX

            11.2.1.8. Nordic

            11.2.1.9. Poland

            11.2.1.10. Rest of Europe

        11.2.2. By Material

        11.2.3. By Product Type

        11.2.4. By Sales Channel

    11.3. Market Attractiveness Analysis

        11.3.1. By Country

        11.3.2. By Material

        11.3.3. By Product Type

        11.3.4. By Sales Channel

    11.4. Key Takeaways

12. East Asia Wine Packaging Market Analysis 2016-2021and Forecast 2022-2032, By Country

    12.1. Historical Market Size Value (US$ Mn)  & Volume (Units) Trend Analysis By Market Taxonomy, 2016-2021

    12.2. Market Size Value (US$ Mn)  & Volume (Units) Forecast By Market Taxonomy, 2022-2032

        12.2.1. By Country

            12.2.1.1. China

            12.2.1.2. Japan

            12.2.1.3. South Korea

        12.2.2. By Material

        12.2.3. By Product Type

        12.2.4. By Sales Channel

    12.3. Market Attractiveness Analysis

        12.3.1. By Country

        12.3.2. By Material

        12.3.3. By Product Type

        12.3.4. By Sales Channel

    12.4. Key Takeaways

13. South Asia Wine Packaging Market Analysis 2016-2021and Forecast 2022-2032, By Country

    13.1. Historical Market Size Value (US$ Mn)  & Volume (Units) Trend Analysis By Market Taxonomy, 2016-2021

    13.2. Market Size Value (US$ Mn)  & Volume (Units) Forecast By Market Taxonomy, 2022-2032

        13.2.1. By Country

            13.2.1.1. India

            13.2.1.2. Thailand

            13.2.1.3. Malaysia

            13.2.1.4. Indonesia

            13.2.1.5. Rest of South Asia

        13.2.2. By Material

        13.2.3. By Product Type

        13.2.4. By Sales Channel

    13.3. Market Attractiveness Analysis

        13.3.1. By Country

        13.3.2. By Material

        13.3.3. By Product Type

        13.3.4. By Sales Channel

    13.4. Key Takeaways

14. Oceania Wine Packaging Market Analysis 2016-2021and Forecast 2022-2032, By Country

    14.1. Historical Market Size Value (US$ Mn)  & Volume (Units) Trend Analysis By Market Taxonomy, 2016-2021

    14.2. Market Size Value (US$ Mn)  & Volume (Units) Forecast By Market Taxonomy, 2022-2032

        14.2.1. By Country

            14.2.1.1. Australia

            14.2.1.2. New Zealand

        14.2.2. By Material

        14.2.3. By Product Type

        14.2.4. By Sales Channel

    14.3. Market Attractiveness Analysis

        14.3.1. By Country

        14.3.2. By Material

        14.3.3. By Product Type

        14.3.4. By Sales Channel

    14.4. Key Takeaways

15. MEA Wine Packaging Market Analysis 2016-2021and Forecast 2022-2032, By Country

    15.1. Historical Market Size Value (US$ Mn)  & Volume (Units) Trend Analysis By Market Taxonomy, 2016-2021

    15.2. Market Size Value (US$ Mn)  & Volume (Units) Forecast By Market Taxonomy, 2022-2032

        15.2.1. By Country

            15.2.1.1. GCC Countries

            15.2.1.2. Turkey

            15.2.1.3. Egypt

            15.2.1.4. South Africa

            15.2.1.5. Rest of MEA

        15.2.2. By Material

        15.2.3. By Product Type

        15.2.4. By Sales Channel

    15.3. Market Attractiveness Analysis

        15.3.1. By Country

        15.3.2. By Material

        15.3.3. By Product Type

        15.3.4. By Sales Channel

    15.4. Key Takeaways

16. Key Countries Wine Packaging Market Analysis

    16.1. U.S.

        16.1.1. Pricing Analysis

        16.1.2. Market Share Analysis, 2022

            16.1.2.1. By Material

            16.1.2.2. By Product Type

            16.1.2.3. By Sales Channel

    16.2. Canada

        16.2.1. Pricing Analysis

        16.2.2. Market Share Analysis, 2022

            16.2.2.1. By Material

            16.2.2.2. By Product Type

            16.2.2.3. By Sales Channel

    16.3. Brazil

        16.3.1. Pricing Analysis

        16.3.2. Market Share Analysis, 2022

            16.3.2.1. By Material

            16.3.2.2. By Product Type

            16.3.2.3. By Sales Channel

    16.4. Mexico

        16.4.1. Pricing Analysis

        16.4.2. Market Share Analysis, 2022

            16.4.2.1. By Material

            16.4.2.2. By Product Type

            16.4.2.3. By Sales Channel

    16.5. Germany

        16.5.1. Pricing Analysis

        16.5.2. Market Share Analysis, 2022

            16.5.2.1. By Material

            16.5.2.2. By Product Type

            16.5.2.3. By Sales Channel

    16.6. France

        16.6.1. Pricing Analysis

        16.6.2. Market Share Analysis, 2022

            16.6.2.1. By Material

            16.6.2.2. By Product Type

            16.6.2.3. By Sales Channel

    16.7. Italy

        16.7.1. Pricing Analysis

        16.7.2. Market Share Analysis, 2022

            16.7.2.1. By Material

            16.7.2.2. By Product Type

            16.7.2.3. By Sales Channel

    16.8. UK

        16.8.1. Pricing Analysis

        16.8.2. Market Share Analysis, 2022

            16.8.2.1. By Material

            16.8.2.2. By Product Type

            16.8.2.3. By Sales Channel

    16.9. Spain

        16.9.1. Pricing Analysis

        16.9.2. Market Share Analysis, 2022

            16.9.2.1. By Material

            16.9.2.2. By Product Type

            16.9.2.3. By Sales Channel

    16.10. Russia

        16.10.1. Pricing Analysis

        16.10.2. Market Share Analysis, 2022

            16.10.2.1. By Material

            16.10.2.2. By Product Type

            16.10.2.3. By Sales Channel

    16.11. China

        16.11.1. Pricing Analysis

        16.11.2. Market Share Analysis, 2022

            16.11.2.1. By Material

            16.11.2.2. By Product Type

            16.11.2.3. By Sales Channel

    16.12. Japan

        16.12.1. Pricing Analysis

        16.12.2. Market Share Analysis, 2022

            16.12.2.1. By Material

            16.12.2.2. By Product Type

            16.12.2.3. By Sales Channel

    16.13. India

        16.13.1. Pricing Analysis

        16.13.2. Market Share Analysis, 2022

            16.13.2.1. By Material

            16.13.2.2. By Product Type

            16.13.2.3. By Sales Channel

    16.14. GCC Countries

        16.14.1. Pricing Analysis

        16.14.2. Market Share Analysis, 2022

            16.14.2.1. By Material

            16.14.2.2. By Product Type

            16.14.2.3. By Sales Channel

    16.15. Australia

        16.15.1. Pricing Analysis

        16.15.2. Market Share Analysis, 2022

            16.15.2.1. By Material

            16.15.2.2. By Product Type

            16.15.2.3. By Sales Channel

17. Market Structure Analysis

    17.1. Competition Dashboard

    17.2. Competition Benchmarking

    17.3. Market Share Analysis of Top Players

        17.3.1. By Regional

        17.3.2. By Material

        17.3.3. By Product Type

        17.3.4. By Sales Channel

18. Competition Analysis

    18.1. Competition Deep Dive

        18.1.1. Owens-Illinois Group 

            18.1.1.1. Overview

            18.1.1.2. Product Portfolio

            18.1.1.3. Profitability by Market Segments (Product/Channel/Region)

            18.1.1.4. Sales Footprint

            18.1.1.5. Strategy Overview

                18.1.1.5.1. Marketing Strategy

                18.1.1.5.2. Product Strategy

                18.1.1.5.3. Channel Strategy

        18.1.2. Ardagh Group S.A.

            18.1.2.1. Overview

            18.1.2.2. Product Portfolio

            18.1.2.3. Profitability by Market Segments (Product/Channel/Region)

            18.1.2.4. Sales Footprint

            18.1.2.5. Strategy Overview

                18.1.2.5.1. Marketing Strategy

                18.1.2.5.2. Product Strategy

                18.1.2.5.3. Channel Strategy

        18.1.3. Liqui-Box Corp

            18.1.3.1. Overview

            18.1.3.2. Product Portfolio

            18.1.3.3. Profitability by Market Segments (Product/Channel/Region)

            18.1.3.4. Sales Footprint

            18.1.3.5. Strategy Overview

                18.1.3.5.1. Marketing Strategy

                18.1.3.5.2. Product Strategy

                18.1.3.5.3. Channel Strategy

        18.1.4. Scholle Corporation

            18.1.4.1. Overview

            18.1.4.2. Product Portfolio

            18.1.4.3. Profitability by Market Segments (Product/Channel/Region)

            18.1.4.4. Sales Footprint

            18.1.4.5. Strategy Overview

                18.1.4.5.1. Marketing Strategy

                18.1.4.5.2. Product Strategy

                18.1.4.5.3. Channel Strategy

        18.1.5. All American Containers

            18.1.5.1. Overview

            18.1.5.2. Product Portfolio

            18.1.5.3. Profitability by Market Segments (Product/Channel/Region)

            18.1.5.4. Sales Footprint

            18.1.5.5. Strategy Overview

                18.1.5.5.1. Marketing Strategy

                18.1.5.5.2. Product Strategy

                18.1.5.5.3. Channel Strategy

        18.1.6. TricorBraun Inc.

            18.1.6.1. Overview

            18.1.6.2. Product Portfolio

            18.1.6.3. Profitability by Market Segments (Product/Channel/Region)

            18.1.6.4. Sales Footprint

            18.1.6.5. Strategy Overview

                18.1.6.5.1. Marketing Strategy

                18.1.6.5.2. Product Strategy

                18.1.6.5.3. Channel Strategy

        18.1.7. Smurfit Kappa Group

            18.1.7.1. Overview

            18.1.7.2. Product Portfolio

            18.1.7.3. Profitability by Market Segments (Product/Channel/Region)

            18.1.7.4. Sales Footprint

            18.1.7.5. Strategy Overview

                18.1.7.5.1. Marketing Strategy

                18.1.7.5.2. Product Strategy

                18.1.7.5.3. Channel Strategy

        18.1.8. Mondi Plc

            18.1.8.1. Overview

            18.1.8.2. Product Portfolio

            18.1.8.3. Profitability by Market Segments (Product/Channel/Region)

            18.1.8.4. Sales Footprint

            18.1.8.5. Strategy Overview

                18.1.8.5.1. Marketing Strategy

                18.1.8.5.2. Product Strategy

                18.1.8.5.3. Channel Strategy

        18.1.9. Berlin Packaging

            18.1.9.1. Overview

            18.1.9.2. Product Portfolio

            18.1.9.3. Profitability by Market Segments (Product/Channel/Region)

            18.1.9.4. Sales Footprint

            18.1.9.5. Strategy Overview

                18.1.9.5.1. Marketing Strategy

                18.1.9.5.2. Product Strategy

                18.1.9.5.3. Channel Strategy

        18.1.10. Ball Corporation

            18.1.10.1. Overview

            18.1.10.2. Product Portfolio

            18.1.10.3. Profitability by Market Segments (Product/Channel/Region)

            18.1.10.4. Sales Footprint

            18.1.10.5. Strategy Overview

                18.1.10.5.1. Marketing Strategy

                18.1.10.5.2. Product Strategy

                18.1.10.5.3. Channel Strategy

        18.1.11. Encore Glass, Inc.

            18.1.11.1. Overview

            18.1.11.2. Product Portfolio

            18.1.11.3. Profitability by Market Segments (Product/Channel/Region)

            18.1.11.4. Sales Footprint

            18.1.11.5. Strategy Overview

                18.1.11.5.1. Marketing Strategy

                18.1.11.5.2. Product Strategy

                18.1.11.5.3. Channel Strategy

        18.1.12. International Paper Company

            18.1.12.1. Overview

            18.1.12.2. Product Portfolio

            18.1.12.3. Profitability by Market Segments (Product/Channel/Region)

            18.1.12.4. Sales Footprint

            18.1.12.5. Strategy Overview

                18.1.12.5.1. Marketing Strategy

                18.1.12.5.2. Product Strategy

                18.1.12.5.3. Channel Strategy

        18.1.13. Trivium Packaging

            18.1.13.1. Overview

            18.1.13.2. Product Portfolio

            18.1.13.3. Profitability by Market Segments (Product/Channel/Region)

            18.1.13.4. Sales Footprint

            18.1.13.5. Strategy Overview

                18.1.13.5.1. Marketing Strategy

                18.1.13.5.2. Product Strategy

                18.1.13.5.3. Channel Strategy

        18.1.14. Brick Packaging

            18.1.14.1. Overview

            18.1.14.2. Product Portfolio

            18.1.14.3. Profitability by Market Segments (Product/Channel/Region)

            18.1.14.4. Sales Footprint

            18.1.14.5. Strategy Overview

                18.1.14.5.1. Marketing Strategy

                18.1.14.5.2. Product Strategy

                18.1.14.5.3. Channel Strategy

        18.1.15. DS Smith

            18.1.15.1. Overview

            18.1.15.2. Product Portfolio

            18.1.15.3. Profitability by Market Segments (Product/Channel/Region)

            18.1.15.4. Sales Footprint

            18.1.15.5. Strategy Overview

                18.1.15.5.1. Marketing Strategy

                18.1.15.5.2. Product Strategy

                18.1.15.5.3. Channel Strategy

        18.1.16. WestRock Company

            18.1.16.1. Overview

            18.1.16.2. Product Portfolio

            18.1.16.3. Profitability by Market Segments (Product/Channel/Region)

            18.1.16.4. Sales Footprint

            18.1.16.5. Strategy Overview

                18.1.16.5.1. Marketing Strategy

                18.1.16.5.2. Product Strategy

                18.1.16.5.3. Channel Strategy

        18.1.17. Frugalpac Limited

            18.1.17.1. Overview

            18.1.17.2. Product Portfolio

            18.1.17.3. Profitability by Market Segments (Product/Channel/Region)

            18.1.17.4. Sales Footprint

            18.1.17.5. Strategy Overview

                18.1.17.5.1. Marketing Strategy

                18.1.17.5.2. Product Strategy

                18.1.17.5.3. Channel Strategy

        18.1.18. Vidrala S.A.

            18.1.18.1. Overview

            18.1.18.2. Product Portfolio

            18.1.18.3. Profitability by Market Segments (Product/Channel/Region)

            18.1.18.4. Sales Footprint

            18.1.18.5. Strategy Overview

                18.1.18.5.1. Marketing Strategy

                18.1.18.5.2. Product Strategy

                18.1.18.5.3. Channel Strategy

19. Assumptions & Acronyms Used

20. Research Methodology

Don't pay for what you don't need

Customize your report by selecting specific countries or regions and save 30%!

List of Tables

Table 1: Global Wine Packaging Market Value (US$ Mn) Forecast by Region, 2016-2032

Table 2: Global Wine Packaging Market Volume (Units) Forecast by Region, 2016-2032

Table 3: Global Wine Packaging Market Value (US$ Mn) Forecast by Material, 2016-2032

Table 4: Global Wine Packaging Market Volume (Units) Forecast by Material, 2016-2032

Table 5: Global Wine Packaging Market Value (US$ Mn) Forecast by Product Type, 2016-2032

Table 6: Global Wine Packaging Market Volume (Units) Forecast by Product Type, 2016-2032

Table 7: Global Wine Packaging Market Value (US$ Mn) Forecast by Sales Channel, 2016-2032

Table 8: Global Wine Packaging Market Volume (Units) Forecast by Sales Channel, 2016-2032

Table 9: North America Wine Packaging Market Value (US$ Mn) Forecast by Country, 2016-2032

Table 10: North America Wine Packaging Market Volume (Units) Forecast by Country, 2016-2032

Table 11: North America Wine Packaging Market Value (US$ Mn) Forecast by Material, 2016-2032

Table 12: North America Wine Packaging Market Volume (Units) Forecast by Material, 2016-2032

Table 13: North America Wine Packaging Market Value (US$ Mn) Forecast by Product Type, 2016-2032

Table 14: North America Wine Packaging Market Volume (Units) Forecast by Product Type, 2016-2032

Table 15: North America Wine Packaging Market Value (US$ Mn) Forecast by Sales Channel, 2016-2032

Table 16: North America Wine Packaging Market Volume (Units) Forecast by Sales Channel, 2016-2032

Table 17: Latin America Wine Packaging Market Value (US$ Mn) Forecast by Country, 2016-2032

Table 18: Latin America Wine Packaging Market Volume (Units) Forecast by Country, 2016-2032

Table 19: Latin America Wine Packaging Market Value (US$ Mn) Forecast by Material, 2016-2032

Table 20: Latin America Wine Packaging Market Volume (Units) Forecast by Material, 2016-2032

Table 21: Latin America Wine Packaging Market Value (US$ Mn) Forecast by Product Type, 2016-2032

Table 22: Latin America Wine Packaging Market Volume (Units) Forecast by Product Type, 2016-2032

Table 23: Latin America Wine Packaging Market Value (US$ Mn) Forecast by Sales Channel, 2016-2032

Table 24: Latin America Wine Packaging Market Volume (Units) Forecast by Sales Channel, 2016-2032

Table 25: Europe Wine Packaging Market Value (US$ Mn) Forecast by Country, 2016-2032

Table 26: Europe Wine Packaging Market Volume (Units) Forecast by Country, 2016-2032

Table 27: Europe Wine Packaging Market Value (US$ Mn) Forecast by Material, 2016-2032

Table 28: Europe Wine Packaging Market Volume (Units) Forecast by Material, 2016-2032

Table 29: Europe Wine Packaging Market Value (US$ Mn) Forecast by Product Type, 2016-2032

Table 30: Europe Wine Packaging Market Volume (Units) Forecast by Product Type, 2016-2032

Table 31: Europe Wine Packaging Market Value (US$ Mn) Forecast by Sales Channel, 2016-2032

Table 32: Europe Wine Packaging Market Volume (Units) Forecast by Sales Channel, 2016-2032

Table 33: East Asia Wine Packaging Market Value (US$ Mn) Forecast by Country, 2016-2032

Table 34: East Asia Wine Packaging Market Volume (Units) Forecast by Country, 2016-2032

Table 35: East Asia Wine Packaging Market Value (US$ Mn) Forecast by Material, 2016-2032

Table 36: East Asia Wine Packaging Market Volume (Units) Forecast by Material, 2016-2032

Table 37: East Asia Wine Packaging Market Value (US$ Mn) Forecast by Product Type, 2016-2032

Table 38: East Asia Wine Packaging Market Volume (Units) Forecast by Product Type, 2016-2032

Table 39: East Asia Wine Packaging Market Value (US$ Mn) Forecast by Sales Channel, 2016-2032

Table 40: East Asia Wine Packaging Market Volume (Units) Forecast by Sales Channel, 2016-2032

Table 41: South Asia Wine Packaging Market Value (US$ Mn) Forecast by Country, 2016-2032

Table 42: South Asia Wine Packaging Market Volume (Units) Forecast by Country, 2016-2032

Table 43: South Asia Wine Packaging Market Value (US$ Mn) Forecast by Material, 2016-2032

Table 44: South Asia Wine Packaging Market Volume (Units) Forecast by Material, 2016-2032

Table 45: South Asia Wine Packaging Market Value (US$ Mn) Forecast by Product Type, 2016-2032

Table 46: South Asia Wine Packaging Market Volume (Units) Forecast by Product Type, 2016-2032

Table 47: South Asia Wine Packaging Market Value (US$ Mn) Forecast by Sales Channel, 2016-2032

Table 48: South Asia Wine Packaging Market Volume (Units) Forecast by Sales Channel, 2016-2032

Table 49: Oceania Wine Packaging Market Value (US$ Mn) Forecast by Country, 2016-2032

Table 50: Oceania Wine Packaging Market Volume (Units) Forecast by Country, 2016-2032

Table 51: Oceania Wine Packaging Market Value (US$ Mn) Forecast by Material, 2016-2032

Table 52: Oceania Wine Packaging Market Volume (Units) Forecast by Material, 2016-2032

Table 53: Oceania Wine Packaging Market Value (US$ Mn) Forecast by Product Type, 2016-2032

Table 54: Oceania Wine Packaging Market Volume (Units) Forecast by Product Type, 2016-2032

Table 55: Oceania Wine Packaging Market Value (US$ Mn) Forecast by Sales Channel, 2016-2032

Table 56: Oceania Wine Packaging Market Volume (Units) Forecast by Sales Channel, 2016-2032

Table 57: MEA Wine Packaging Market Value (US$ Mn) Forecast by Country, 2016-2032

Table 58: MEA Wine Packaging Market Volume (Units) Forecast by Country, 2016-2032

Table 59: MEA Wine Packaging Market Value (US$ Mn) Forecast by Material, 2016-2032

Table 60: MEA Wine Packaging Market Volume (Units) Forecast by Material, 2016-2032

Table 61: MEA Wine Packaging Market Value (US$ Mn) Forecast by Product Type, 2016-2032

Table 62: MEA Wine Packaging Market Volume (Units) Forecast by Product Type, 2016-2032

Table 63: MEA Wine Packaging Market Value (US$ Mn) Forecast by Sales Channel, 2016-2032

Table 64: MEA Wine Packaging Market Volume (Units) Forecast by Sales Channel, 2016-2032
Ismail Sutaria
Ismail Sutaria

Principal Consultant

Talk to Analyst

Find your sweet spots for generating winning opportunities in this market.

List of Charts

Figure 1: Global Wine Packaging Market Value (US$ Mn) by Material, 2022-2032

Figure 2: Global Wine Packaging Market Value (US$ Mn) by Product Type, 2022-2032

Figure 3: Global Wine Packaging Market Value (US$ Mn) by Sales Channel, 2022-2032

Figure 4: Global Wine Packaging Market Value (US$ Mn) by Region, 2022-2032

Figure 5: Global Wine Packaging Market Value (US$ Mn) Analysis by Region, 2016-2021

Figure 6: Global Wine Packaging Market Volume (Units) Analysis by Region, 2016-2021

Figure 7: Global Wine Packaging Market Value Share (%) and BPS Analysis by Region, 2022-2032

Figure 8: Global Wine Packaging Market Y-o-Y Growth (%) Projections by Region, 2022-2032

Figure 9: Global Wine Packaging Market Value (US$ Mn) Analysis by Material, 2016-2021

Figure 10: Global Wine Packaging Market Volume (Units) Analysis by Material, 2016-2021

Figure 11: Global Wine Packaging Market Value Share (%) and BPS Analysis by Material, 2022-2032

Figure 12: Global Wine Packaging Market Y-o-Y Growth (%) Projections by Material, 2022-2032

Figure 13: Global Wine Packaging Market Value (US$ Mn) Analysis by Product Type, 2016-2021

Figure 14: Global Wine Packaging Market Volume (Units) Analysis by Product Type, 2016-2021

Figure 15: Global Wine Packaging Market Value Share (%) and BPS Analysis by Product Type, 2022-2032

Figure 16: Global Wine Packaging Market Y-o-Y Growth (%) Projections by Product Type, 2022-2032

Figure 17: Global Wine Packaging Market Value (US$ Mn) Analysis by Sales Channel, 2016-2021

Figure 18: Global Wine Packaging Market Volume (Units) Analysis by Sales Channel, 2016-2021

Figure 19: Global Wine Packaging Market Value Share (%) and BPS Analysis by Sales Channel, 2022-2032

Figure 20: Global Wine Packaging Market Y-o-Y Growth (%) Projections by Sales Channel, 2022-2032

Figure 21: Global Wine Packaging Market Attractiveness by Material, 2022-2032

Figure 22: Global Wine Packaging Market Attractiveness by Product Type, 2022-2032

Figure 23: Global Wine Packaging Market Attractiveness by Sales Channel, 2022-2032

Figure 24: Global Wine Packaging Market Attractiveness by Region, 2022-2032

Figure 25: North America Wine Packaging Market Value (US$ Mn) by Material, 2022-2032

Figure 26: North America Wine Packaging Market Value (US$ Mn) by Product Type, 2022-2032

Figure 27: North America Wine Packaging Market Value (US$ Mn) by Sales Channel, 2022-2032

Figure 28: North America Wine Packaging Market Value (US$ Mn) by Country, 2022-2032

Figure 29: North America Wine Packaging Market Value (US$ Mn) Analysis by Country, 2016-2021

Figure 30: North America Wine Packaging Market Volume (Units) Analysis by Country, 2016-2021

Figure 31: North America Wine Packaging Market Value Share (%) and BPS Analysis by Country, 2022-2032

Figure 32: North America Wine Packaging Market Y-o-Y Growth (%) Projections by Country, 2022-2032

Figure 33: North America Wine Packaging Market Value (US$ Mn) Analysis by Material, 2016-2021

Figure 34: North America Wine Packaging Market Volume (Units) Analysis by Material, 2016-2021

Figure 35: North America Wine Packaging Market Value Share (%) and BPS Analysis by Material, 2022-2032

Figure 36: North America Wine Packaging Market Y-o-Y Growth (%) Projections by Material, 2022-2032

Figure 37: North America Wine Packaging Market Value (US$ Mn) Analysis by Product Type, 2016-2021

Figure 38: North America Wine Packaging Market Volume (Units) Analysis by Product Type, 2016-2021

Figure 39: North America Wine Packaging Market Value Share (%) and BPS Analysis by Product Type, 2022-2032

Figure 40: North America Wine Packaging Market Y-o-Y Growth (%) Projections by Product Type, 2022-2032

Figure 41: North America Wine Packaging Market Value (US$ Mn) Analysis by Sales Channel, 2016-2021

Figure 42: North America Wine Packaging Market Volume (Units) Analysis by Sales Channel, 2016-2021

Figure 43: North America Wine Packaging Market Value Share (%) and BPS Analysis by Sales Channel, 2022-2032

Figure 44: North America Wine Packaging Market Y-o-Y Growth (%) Projections by Sales Channel, 2022-2032

Figure 45: North America Wine Packaging Market Attractiveness by Material, 2022-2032

Figure 46: North America Wine Packaging Market Attractiveness by Product Type, 2022-2032

Figure 47: North America Wine Packaging Market Attractiveness by Sales Channel, 2022-2032

Figure 48: North America Wine Packaging Market Attractiveness by Country, 2022-2032

Figure 49: Latin America Wine Packaging Market Value (US$ Mn) by Material, 2022-2032

Figure 50: Latin America Wine Packaging Market Value (US$ Mn) by Product Type, 2022-2032

Figure 51: Latin America Wine Packaging Market Value (US$ Mn) by Sales Channel, 2022-2032

Figure 52: Latin America Wine Packaging Market Value (US$ Mn) by Country, 2022-2032

Figure 53: Latin America Wine Packaging Market Value (US$ Mn) Analysis by Country, 2016-2021

Figure 54: Latin America Wine Packaging Market Volume (Units) Analysis by Country, 2016-2021

Figure 55: Latin America Wine Packaging Market Value Share (%) and BPS Analysis by Country, 2022-2032

Figure 56: Latin America Wine Packaging Market Y-o-Y Growth (%) Projections by Country, 2022-2032

Figure 57: Latin America Wine Packaging Market Value (US$ Mn) Analysis by Material, 2016-2021

Figure 58: Latin America Wine Packaging Market Volume (Units) Analysis by Material, 2016-2021

Figure 59: Latin America Wine Packaging Market Value Share (%) and BPS Analysis by Material, 2022-2032

Figure 60: Latin America Wine Packaging Market Y-o-Y Growth (%) Projections by Material, 2022-2032

Figure 61: Latin America Wine Packaging Market Value (US$ Mn) Analysis by Product Type, 2016-2021

Figure 62: Latin America Wine Packaging Market Volume (Units) Analysis by Product Type, 2016-2021

Figure 63: Latin America Wine Packaging Market Value Share (%) and BPS Analysis by Product Type, 2022-2032

Figure 64: Latin America Wine Packaging Market Y-o-Y Growth (%) Projections by Product Type, 2022-2032

Figure 65: Latin America Wine Packaging Market Value (US$ Mn) Analysis by Sales Channel, 2016-2021

Figure 66: Latin America Wine Packaging Market Volume (Units) Analysis by Sales Channel, 2016-2021

Figure 67: Latin America Wine Packaging Market Value Share (%) and BPS Analysis by Sales Channel, 2022-2032

Figure 68: Latin America Wine Packaging Market Y-o-Y Growth (%) Projections by Sales Channel, 2022-2032

Figure 69: Latin America Wine Packaging Market Attractiveness by Material, 2022-2032

Figure 70: Latin America Wine Packaging Market Attractiveness by Product Type, 2022-2032

Figure 71: Latin America Wine Packaging Market Attractiveness by Sales Channel, 2022-2032

Figure 72: Latin America Wine Packaging Market Attractiveness by Country, 2022-2032

Figure 73: Europe Wine Packaging Market Value (US$ Mn) by Material, 2022-2032

Figure 74: Europe Wine Packaging Market Value (US$ Mn) by Product Type, 2022-2032

Figure 75: Europe Wine Packaging Market Value (US$ Mn) by Sales Channel, 2022-2032

Figure 76: Europe Wine Packaging Market Value (US$ Mn) by Country, 2022-2032

Figure 77: Europe Wine Packaging Market Value (US$ Mn) Analysis by Country, 2016-2021

Figure 78: Europe Wine Packaging Market Volume (Units) Analysis by Country, 2016-2021

Figure 79: Europe Wine Packaging Market Value Share (%) and BPS Analysis by Country, 2022-2032

Figure 80: Europe Wine Packaging Market Y-o-Y Growth (%) Projections by Country, 2022-2032

Figure 81: Europe Wine Packaging Market Value (US$ Mn) Analysis by Material, 2016-2021

Figure 82: Europe Wine Packaging Market Volume (Units) Analysis by Material, 2016-2021

Figure 83: Europe Wine Packaging Market Value Share (%) and BPS Analysis by Material, 2022-2032

Figure 84: Europe Wine Packaging Market Y-o-Y Growth (%) Projections by Material, 2022-2032

Figure 85: Europe Wine Packaging Market Value (US$ Mn) Analysis by Product Type, 2016-2021

Figure 86: Europe Wine Packaging Market Volume (Units) Analysis by Product Type, 2016-2021

Figure 87: Europe Wine Packaging Market Value Share (%) and BPS Analysis by Product Type, 2022-2032

Figure 88: Europe Wine Packaging Market Y-o-Y Growth (%) Projections by Product Type, 2022-2032

Figure 89: Europe Wine Packaging Market Value (US$ Mn) Analysis by Sales Channel, 2016-2021

Figure 90: Europe Wine Packaging Market Volume (Units) Analysis by Sales Channel, 2016-2021

Figure 91: Europe Wine Packaging Market Value Share (%) and BPS Analysis by Sales Channel, 2022-2032

Figure 92: Europe Wine Packaging Market Y-o-Y Growth (%) Projections by Sales Channel, 2022-2032

Figure 93: Europe Wine Packaging Market Attractiveness by Material, 2022-2032

Figure 94: Europe Wine Packaging Market Attractiveness by Product Type, 2022-2032

Figure 95: Europe Wine Packaging Market Attractiveness by Sales Channel, 2022-2032

Figure 96: Europe Wine Packaging Market Attractiveness by Country, 2022-2032

Figure 97: East Asia Wine Packaging Market Value (US$ Mn) by Material, 2022-2032

Figure 98: East Asia Wine Packaging Market Value (US$ Mn) by Product Type, 2022-2032

Figure 99: East Asia Wine Packaging Market Value (US$ Mn) by Sales Channel, 2022-2032

Figure 100: East Asia Wine Packaging Market Value (US$ Mn) by Country, 2022-2032

Figure 101: East Asia Wine Packaging Market Value (US$ Mn) Analysis by Country, 2016-2021

Figure 102: East Asia Wine Packaging Market Volume (Units) Analysis by Country, 2016-2021

Figure 103: East Asia Wine Packaging Market Value Share (%) and BPS Analysis by Country, 2022-2032

Figure 104: East Asia Wine Packaging Market Y-o-Y Growth (%) Projections by Country, 2022-2032

Figure 105: East Asia Wine Packaging Market Value (US$ Mn) Analysis by Material, 2016-2021

Figure 106: East Asia Wine Packaging Market Volume (Units) Analysis by Material, 2016-2021

Figure 107: East Asia Wine Packaging Market Value Share (%) and BPS Analysis by Material, 2022-2032

Figure 108: East Asia Wine Packaging Market Y-o-Y Growth (%) Projections by Material, 2022-2032

Figure 109: East Asia Wine Packaging Market Value (US$ Mn) Analysis by Product Type, 2016-2021

Figure 110: East Asia Wine Packaging Market Volume (Units) Analysis by Product Type, 2016-2021

Figure 111: East Asia Wine Packaging Market Value Share (%) and BPS Analysis by Product Type, 2022-2032

Figure 112: East Asia Wine Packaging Market Y-o-Y Growth (%) Projections by Product Type, 2022-2032

Figure 113: East Asia Wine Packaging Market Value (US$ Mn) Analysis by Sales Channel, 2016-2021

Figure 114: East Asia Wine Packaging Market Volume (Units) Analysis by Sales Channel, 2016-2021

Figure 115: East Asia Wine Packaging Market Value Share (%) and BPS Analysis by Sales Channel, 2022-2032

Figure 116: East Asia Wine Packaging Market Y-o-Y Growth (%) Projections by Sales Channel, 2022-2032

Figure 117: East Asia Wine Packaging Market Attractiveness by Material, 2022-2032

Figure 118: East Asia Wine Packaging Market Attractiveness by Product Type, 2022-2032

Figure 119: East Asia Wine Packaging Market Attractiveness by Sales Channel, 2022-2032

Figure 120: East Asia Wine Packaging Market Attractiveness by Country, 2022-2032

Figure 121: South Asia Wine Packaging Market Value (US$ Mn) by Material, 2022-2032

Figure 122: South Asia Wine Packaging Market Value (US$ Mn) by Product Type, 2022-2032

Figure 123: South Asia Wine Packaging Market Value (US$ Mn) by Sales Channel, 2022-2032

Figure 124: South Asia Wine Packaging Market Value (US$ Mn) by Country, 2022-2032

Figure 125: South Asia Wine Packaging Market Value (US$ Mn) Analysis by Country, 2016-2021

Figure 126: South Asia Wine Packaging Market Volume (Units) Analysis by Country, 2016-2021

Figure 127: South Asia Wine Packaging Market Value Share (%) and BPS Analysis by Country, 2022-2032

Figure 128: South Asia Wine Packaging Market Y-o-Y Growth (%) Projections by Country, 2022-2032

Figure 129: South Asia Wine Packaging Market Value (US$ Mn) Analysis by Material, 2016-2021

Figure 130: South Asia Wine Packaging Market Volume (Units) Analysis by Material, 2016-2021

Figure 131: South Asia Wine Packaging Market Value Share (%) and BPS Analysis by Material, 2022-2032

Figure 132: South Asia Wine Packaging Market Y-o-Y Growth (%) Projections by Material, 2022-2032

Figure 133: South Asia Wine Packaging Market Value (US$ Mn) Analysis by Product Type, 2016-2021

Figure 134: South Asia Wine Packaging Market Volume (Units) Analysis by Product Type, 2016-2021

Figure 135: South Asia Wine Packaging Market Value Share (%) and BPS Analysis by Product Type, 2022-2032

Figure 136: South Asia Wine Packaging Market Y-o-Y Growth (%) Projections by Product Type, 2022-2032

Figure 137: South Asia Wine Packaging Market Value (US$ Mn) Analysis by Sales Channel, 2016-2021

Figure 138: South Asia Wine Packaging Market Volume (Units) Analysis by Sales Channel, 2016-2021

Figure 139: South Asia Wine Packaging Market Value Share (%) and BPS Analysis by Sales Channel, 2022-2032

Figure 140: South Asia Wine Packaging Market Y-o-Y Growth (%) Projections by Sales Channel, 2022-2032

Figure 141: South Asia Wine Packaging Market Attractiveness by Material, 2022-2032

Figure 142: South Asia Wine Packaging Market Attractiveness by Product Type, 2022-2032

Figure 143: South Asia Wine Packaging Market Attractiveness by Sales Channel, 2022-2032

Figure 144: South Asia Wine Packaging Market Attractiveness by Country, 2022-2032

Figure 145: Oceania Wine Packaging Market Value (US$ Mn) by Material, 2022-2032

Figure 146: Oceania Wine Packaging Market Value (US$ Mn) by Product Type, 2022-2032

Figure 147: Oceania Wine Packaging Market Value (US$ Mn) by Sales Channel, 2022-2032

Figure 148: Oceania Wine Packaging Market Value (US$ Mn) by Country, 2022-2032

Figure 149: Oceania Wine Packaging Market Value (US$ Mn) Analysis by Country, 2016-2021

Figure 150: Oceania Wine Packaging Market Volume (Units) Analysis by Country, 2016-2021

Figure 151: Oceania Wine Packaging Market Value Share (%) and BPS Analysis by Country, 2022-2032

Figure 152: Oceania Wine Packaging Market Y-o-Y Growth (%) Projections by Country, 2022-2032

Figure 153: Oceania Wine Packaging Market Value (US$ Mn) Analysis by Material, 2016-2021

Figure 154: Oceania Wine Packaging Market Volume (Units) Analysis by Material, 2016-2021

Figure 155: Oceania Wine Packaging Market Value Share (%) and BPS Analysis by Material, 2022-2032

Figure 156: Oceania Wine Packaging Market Y-o-Y Growth (%) Projections by Material, 2022-2032

Figure 157: Oceania Wine Packaging Market Value (US$ Mn) Analysis by Product Type, 2016-2021

Figure 158: Oceania Wine Packaging Market Volume (Units) Analysis by Product Type, 2016-2021

Figure 159: Oceania Wine Packaging Market Value Share (%) and BPS Analysis by Product Type, 2022-2032

Figure 160: Oceania Wine Packaging Market Y-o-Y Growth (%) Projections by Product Type, 2022-2032

Figure 161: Oceania Wine Packaging Market Value (US$ Mn) Analysis by Sales Channel, 2016-2021

Figure 162: Oceania Wine Packaging Market Volume (Units) Analysis by Sales Channel, 2016-2021

Figure 163: Oceania Wine Packaging Market Value Share (%) and BPS Analysis by Sales Channel, 2022-2032

Figure 164: Oceania Wine Packaging Market Y-o-Y Growth (%) Projections by Sales Channel, 2022-2032

Figure 165: Oceania Wine Packaging Market Attractiveness by Material, 2022-2032

Figure 166: Oceania Wine Packaging Market Attractiveness by Product Type, 2022-2032

Figure 167: Oceania Wine Packaging Market Attractiveness by Sales Channel, 2022-2032

Figure 168: Oceania Wine Packaging Market Attractiveness by Country, 2022-2032

Figure 169: MEA Wine Packaging Market Value (US$ Mn) by Material, 2022-2032

Figure 170: MEA Wine Packaging Market Value (US$ Mn) by Product Type, 2022-2032

Figure 171: MEA Wine Packaging Market Value (US$ Mn) by Sales Channel, 2022-2032

Figure 172: MEA Wine Packaging Market Value (US$ Mn) by Country, 2022-2032

Figure 173: MEA Wine Packaging Market Value (US$ Mn) Analysis by Country, 2016-2021

Figure 174: MEA Wine Packaging Market Volume (Units) Analysis by Country, 2016-2021

Figure 175: MEA Wine Packaging Market Value Share (%) and BPS Analysis by Country, 2022-2032

Figure 176: MEA Wine Packaging Market Y-o-Y Growth (%) Projections by Country, 2022-2032

Figure 177: MEA Wine Packaging Market Value (US$ Mn) Analysis by Material, 2016-2021

Figure 178: MEA Wine Packaging Market Volume (Units) Analysis by Material, 2016-2021

Figure 179: MEA Wine Packaging Market Value Share (%) and BPS Analysis by Material, 2022-2032

Figure 180: MEA Wine Packaging Market Y-o-Y Growth (%) Projections by Material, 2022-2032

Figure 181: MEA Wine Packaging Market Value (US$ Mn) Analysis by Product Type, 2016-2021

Figure 182: MEA Wine Packaging Market Volume (Units) Analysis by Product Type, 2016-2021

Figure 183: MEA Wine Packaging Market Value Share (%) and BPS Analysis by Product Type, 2022-2032

Figure 184: MEA Wine Packaging Market Y-o-Y Growth (%) Projections by Product Type, 2022-2032

Figure 185: MEA Wine Packaging Market Value (US$ Mn) Analysis by Sales Channel, 2016-2021

Figure 186: MEA Wine Packaging Market Volume (Units) Analysis by Sales Channel, 2016-2021

Figure 187: MEA Wine Packaging Market Value Share (%) and BPS Analysis by Sales Channel, 2022-2032

Figure 188: MEA Wine Packaging Market Y-o-Y Growth (%) Projections by Sales Channel, 2022-2032

Figure 189: MEA Wine Packaging Market Attractiveness by Material, 2022-2032

Figure 190: MEA Wine Packaging Market Attractiveness by Product Type, 2022-2032

Figure 191: MEA Wine Packaging Market Attractiveness by Sales Channel, 2022-2032

Figure 192: MEA Wine Packaging Market Attractiveness by Country, 2022-2032

Recommendations

Packaging

Wine Bags Market

Published : November 2022

Packaging

Wine Cork Market

Published : October 2022

Packaging

Wine Totes Packaging Market

Published : September 2022

Packaging

Wine Barrel Market

Published : July 2022

Explore Packaging Insights

View Reports