The Wine Cork market is experiencing steady growth driven by increasing global wine consumption and a growing preference for quality preservation during storage and transportation. The future outlook for this market is shaped by the rising awareness regarding the impact of cork quality on wine flavor and shelf life. The growing demand for premium and fine wines has reinforced the need for high-quality corks that provide an airtight seal and prevent spoilage.
Investments in sustainable and environmentally friendly cork production processes have further supported market expansion. Additionally, the demand for natural and eco-conscious materials is driving growth in cork-based solutions, particularly in regions with a strong wine culture.
Innovations in cork processing and enhanced durability have increased the adoption of corks over alternative closures As wine production continues to expand globally and consumer preference shifts toward high-quality packaging, the Wine Cork market is expected to maintain steady growth, providing opportunities for both established manufacturers and new entrants.
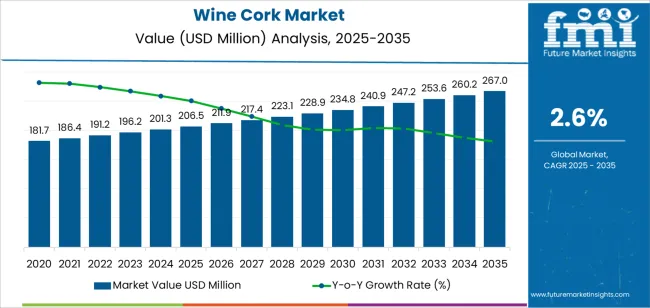
| Metric | Value |
|---|---|
| Wine Cork Market Estimated Value in (2025 E) | USD 206.5 million |
| Wine Cork Market Forecast Value in (2035 F) | USD 267.0 million |
| Forecast CAGR (2025 to 2035) | 2.6% |
The market is segmented by Cork Type, Material, and Wine Type and region. By Cork Type, the market is divided into Natural and Synthetic. In terms of Material, the market is classified into Wood, Plastic, Rubber, Silicone, Glass, and Metal. Based on Wine Type, the market is segmented into Red Wine, White Wine, Sparkling Wine, and Others (Rose Wine, Dessert Wine, Etc.). Regionally, the market is classified into North America, Latin America, Western Europe, Eastern Europe, Balkan & Baltic Countries, Russia & Belarus, Central Asia, East Asia, South Asia & Pacific, and the Middle East & Africa.
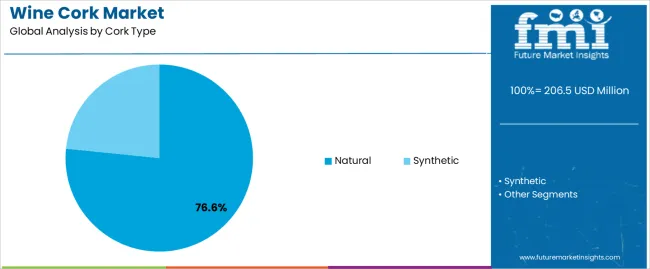
The natural cork type segment is projected to hold 76.60% of the Wine Cork market revenue share in 2025, making it the leading cork type. This dominance is attributed to the superior sealing properties and elasticity of natural corks, which ensure consistent wine preservation and aging.
Natural corks are highly preferred for premium wines as they maintain the quality, aroma, and flavor profile over extended periods. The segment has benefited from advancements in cork harvesting and processing, which have enhanced durability and reduced imperfections.
The growing demand for sustainable and biodegradable materials has further reinforced the adoption of natural corks Additionally, natural corks are valued by wine producers for their traditional appeal and consumer perception of quality, contributing to strong market penetration and sustained revenue growth.
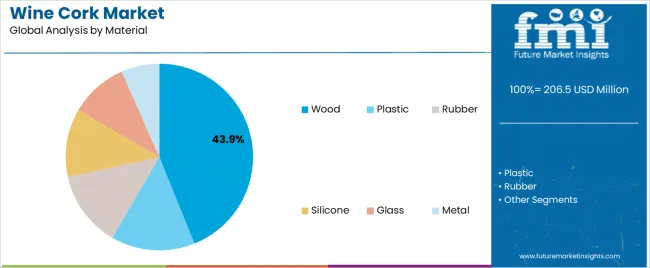
The wood material segment is expected to account for 43.90% of the Wine Cork market revenue share in 2025, reflecting its widespread use in cork production. Wood-based corks provide strength, flexibility, and reliable sealing properties suitable for various wine types.
Their compatibility with different cork processing techniques has enabled manufacturers to offer a wide range of product options to meet quality and performance requirements. The increasing demand for environmentally friendly and renewable materials supports the growth of wood-based corks.
Additionally, wood-based corks contribute to sustainable wine packaging solutions, which are increasingly favored by producers and consumers, reinforcing the segment’s leading position in the market.
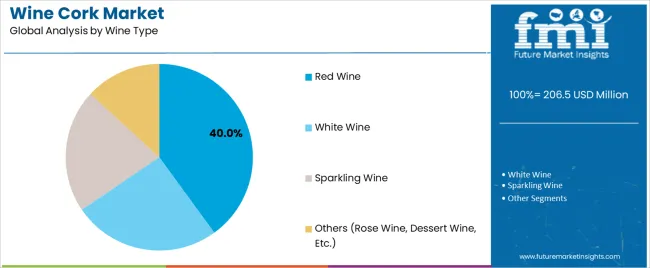
The red wine segment is anticipated to hold 40.00% of the Wine Cork market revenue share in 2025, making it the leading wine type segment. This growth is driven by the preference for high-quality wine preservation, as red wines are more sensitive to oxygen exposure and require effective sealing to maintain flavor and aroma.
The popularity of red wines globally has encouraged wineries to adopt superior cork materials that ensure consistent product quality and aging potential. The segment’s growth is further supported by rising consumption patterns in key markets and increased focus on premium and aged red wines.
The strong association between cork closure and red wine quality has cemented the preference for corks in this segment, driving sustained market adoption and revenue growth.
The below table presents the expected CAGR for the global wine cork market over several semi-annual periods spanning from 2025 to 2035. In the first half (H1) of the year from 2025 to 2035, the business is predicted to surge at a CAGR of 2.5%, followed by a slightly higher growth rate of 2.7% in the second half (H2) of the same year.
| Particular | Value CAGR |
|---|---|
| H1 | 2.5% (2025 to 2035) |
| H2 | 2.7% (2025 to 2035) |
| H1 | 2.4% (2025 to 2035) |
| H2 | 2.8% (2025 to 2035) |
Moving into the subsequent period, from H1 2025 to H2 2035, the CAGR is projected to decrease slightly to 2.4% in the first half and rise to 2.8% in the second half. In the first half (H1) the market witnessed a decrease of 10 BPS while in the second half (H2), the market witnessed an increase of 10 BPS.
Sustainability in Wine Cork to Drive the Market
The focus on sustainability drives the market for wine cork with both the consumer and producer prioritizing eco-friendly practices in production as well as in purchase. Natural cork harvested from oak trees offers a renewable option for the producers supporting the biodiversity playing a crucial role in decarburization, enhancing overall environmental value.
This sustainable harvesting process of cork coupled with its recyclable nature appeals to eco-conscious consumers preferring products with lesser impacts on the environment. With the increasing emphasis on sustainable practices by the wineries, the demand for natural cork is likely to grow.
For instance, Amorim Cork, implemented several strategies to enhance sustainability in their production further investing in renewable energy and promoting responsible forest management through the Forest Stewardship Council (FSC) certification program.
In addition to this, in April 2025, Amorim Florestal partnered with Caixa Geral de Depósitos (CGD, Portugal’s largest bank) and launched the first ESG operation in the cork sector which helps cork suppliers to benefit from reduced interest rates of loans based on their ESG rating for sustainable business.
Tourism Driving the Wine Industry is Poised to Drive the Market of Wine Cork
The wine industry is sufficient for driving the market economy. As wine consumption is so fascinating to the tourist that visits different types of places such as vineyards. Specifically, there are wine tourist that visits the different vineyards and consumes the wines as there are different types of wine tasting rooms and wine bottles.
Different types of wine-tasting tours attract tourists to visit different places for tasting. The Wine tourist gathers information regarding the quality of wine and the aroma and various processing parameters used for wine fermentation.
This automatically drives the wine industry as well as the wine sealing product that is wine cork. The rate of visiting the different vineyards and consumption of wine is simultaneously creating the market opportunity for the wine cork market.
Wine corks are used for sealing and packing wine bottles with different types of corks with different materials. Natural cork has the best properties as compared to synthetic cork. The wine cork market is growing due to the growing wine industry.
As consumers and manufacturers are focusing on naturally obtained material that can be recycled or that will have no impact on the environment when it is discarded after use. Overall, the rising demand for tourism is driving the sale of wine and simultaneously driving the wine cork market across the globe.
Rise in Alternative Wine Closure Method to Pose Challenges for the Market
The development of new alternative wine closure methods such as synthetic corks, screw caps, and glass stoppers gained popularity due to certain advantages such as consistent sealing performance, low production cost, and use of these alternate corks also reduces the risk of taints.
For instance, screw caps offer a secured and airtight seal that avoids the oxidation process ensuring the wine remains fresh for an extended period. These caps may be beneficial for the white wine and the wines that are to be consumed shortly. In addition to this screw cork offers uniform performance and eliminates variability in quality that might occur in natural cork.
The global wine cork industry recorded a CAGR of 1.8% during the historical period between 2020 and 2025. The growth of the wine cork industry was positive as it reached a value of USD 206.5 million in 2025 from USD 181.7 million in 2020.
The wine cork is a stopper used for sealing wine bottles preventing leakages ensuring the wine quality and flavor are unchanged. The wine cork can transfer oxygen through the closures causing oxidation with the inner wine benefitting to forming complex flavors.
Further, an increase in the production and consumption of wine is observed globally coupled with the growing awareness about health benefits including cardiovascular and the changing consumer preference for wine over other beverages such as beer and other non-alcoholic beverages to boost consumption. This rise in consumption is poise to boost sales for the wine cork market.
Additionally, many materials such as plastic, metal, glass, and wood are preferred to produce corks. The rising demand from consumers for eco-friendly and sustainable packaging forced manufacturers to shift towards materials such as recyclable plastics, biodegradable and reusable materials to meet this demand for sustainability.
However, the market faced various challenges by the growing alternate methods such as synthetic corks, screw caps, and others. These alternatives offer consistent quality and reduces the risk of cork taint. Despite these challenges, natural cork remained the preferred option of consumers for ongoing tradition and sustainability purposes.
Technological advancements in the closure method and innovations in the production of cork that include the method for reducing the cork taint, and improving the quality of the cork continue to drive the market for wine cork. Further fluctuations in the prices of the cork and the availability may impact both the consumers and the producers in the wine cork industry.
Tier 1 companies comprise market leaders with a market revenue of above USD 10 million capturing significant market share of 30% to 35% in global market. These market leaders are characterized by high production capacity and a wide product portfolio.
These market leaders are distinguished by their extensive expertise in manufacturing and reconditioning across multiple packaging formats and a broad geographical reach, underpinned by a robust consumer base.
They provide a wide range of series including reconditioning, recycling, and manufacturing utilizing the latest technology and meeting the regulatory standards providing the highest quality. Prominent companies within Tier 1 include Amorim Cork, M. A. Silva, and DIAM Bouchage SAS.
Tier 2 companies include mid-size players with revenue of USD 5 to 10 million having presence in specific regions and highly influencing the local market. These are characterized by a strong presence overseas and strong market knowledge. These market players have good technology and ensure regulatory compliance but may not have advanced technology and wide global reach.
Prominent companies in Tier 2 include JELINEK CORK GROUP, WidgetCo, Bangor Cork, Sugherificio Martinese & Figli Srl, J. C. RIBEIRO, Korkindustrie GmbH & Co. KG, and Advance Cork International.
Tier 3 includes the majority of small-scale companies operating at the local presence and serving niche markets having revenue below USD 5 million. These companies are notably oriented towards fulfilling local market demands and are consequently classified within the tier 3 share segment.
They are small-scale players and have limited geographical reach. Tier 3, within this context, is recognized as an unorganized market, denoting a sector characterized by a lack of extensive structure and formalization when compared to organized competitors.
The section below covers the industry analysis of the wine cork market for different countries. Market demand analysis on key countries in several regions of the globe, including North America, Asia Pacific, Europe, and others, is provided. The United States is anticipated to remain at the forefront in North America, with a CAGR of 1.5% through 2035. In Asia Pacific, India is projected to witness a CAGR of 5.9% by 2035.
| Countries | Value CAGR (2025 to 2035) |
|---|---|
| USA | 1.5% |
| Germany | 1.4% |
| Australia | 2.2% |
| Spain | 2.7% |
| India | 5.9% |
| China | 5.0% |
| Thailand | 4.1% |
According to the data published by Alcohol.org the United States consumes 206.5 billion bottles of wine annually. In addition to this Wine Institute estimated that wine consumption in the United States in 2025 per resident was 2.86 gals and 964 million total wine gallons.
This growth in the consumption of wine in the USA is driven by the changing consumer preference for wine over other drinks such as beer and spirits. The rising wine culture coupled with wine-tasting events and wine tourism in regions like Napa Valley boosted demand for wine bottles and thus surged the demand for wine corks.
Further, educating the benefits of drinking wine with meals lowers risks of type 2 diabetes to fuel the consumption of wine and this rise in consumption is poised to drive the market for wine corks.
According to the Department of Agriculture, Fisheries and Forestry, Australia exported a record high value of wine reaching USD 41.51 million in 2025 to 2025 which resembles to 31% increase in exports as compared to 2024 to 2025. This increase in exports is driven by the changing consumer preference in Thailand for Australian wine over China.
The Thailand-Australia Free Trade Agreement (TAFTA) gave Australian suppliers a trade advantage over EU and USA suppliers. Further Thailand eliminated the tariffs on Australian wine under the plurilateral ASEAN-Australia-New Zealand Free Trade Agreement to boost wine trade.
This increase in demand for wine results in higher production which increases the requirement for bottles and closures. Due to the superior sealing properties and ability to enhance wine ageing natural corks are favored for preserving the quality of wines during long transportation. Additionally, consumer’s preference for premium packaging boosts demand for natural corks.
The section contains information about the leading segments in the industry. By wine type, the red wine segment is estimated to grow at a CAGR of 2.9% throughout 2035. Additionally, the natural cork industry is projected to expand at 2.2% by 2035.
| Cork Type | Natural |
|---|---|
| Value Share (2035) | 76.6% |
The natural wine cork segment dominates the market in terms of revenue, accounting for almost 67.9% of the market share in 2025. Natural wine corks in comparison to other synthetic corks use 75% less non-renewable energy and produce 25 times less greenhouse gases and half the solid waste.
Natural cork is renewable and biodegradable contributing to less pollution and aligns with the growing demand from consumers for eco-friendly and sustainable packaging. Further advancement in cork production helps reduce cork taint (TCA contamination) boosting consumer confidence in natural corks.
| Material | Wood |
|---|---|
| Value Share (2035) | 43.9% |
Wine cork made of wood is forecast to account for a revenue of over USD 206.5 million in the wine cork market by 2025 end. It is also poised to expand at a CAGR of 3.0% across the forecast period. Wooden corks specially made from oak trees offer optimal oxygen permeability allowing wine to age gracefully by slow and controlled oxidation.
The manufacturers prefer wood wine corks over synthetic corks as the use of wooden corks enhances the quality of the wine and the sealing properties of wood due to their unique cellular structure are able to prevent leakages. Additionally, wooden corks are biodegradable, recyclable, and align with the company's sustainability goals.
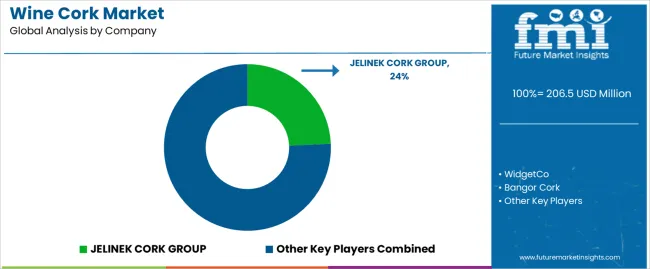
Key players operating in the wine cork market are investing in advanced technologies and facilities and also entering into partnerships. Key wine cork providers have also been acquiring smaller players to grow their presence to further penetrate the wine cork market across multiple regions.
Recent Industry Developments in the Wine Cork Market
In terms of cork type, the industry is divided into natural, and synthetic.
In terms of material, the industry is segregated into plastic, wood, rubber, silicone, glass, and metal.
The industry is classified by wine type as red wine, white wine, sparkling wine, and others (rose wine, dessert wine, etc.).
Key countries of North America, Latin America, East Asia, South Asia & Pacific, Western Europe, Eastern Europe, and the Middle East & Africa have been covered in the report.
The global wine cork market is estimated to be valued at USD 206.5 million in 2025.
The market size for the wine cork market is projected to reach USD 267.0 million by 2035.
The wine cork market is expected to grow at a 2.6% CAGR between 2025 and 2035.
The key product types in wine cork market are natural and synthetic.
In terms of material, wood segment to command 43.9% share in the wine cork market in 2025.


Our Research Products

The "Full Research Suite" delivers actionable market intel, deep dives on markets or technologies, so clients act faster, cut risk, and unlock growth.

The Leaderboard benchmarks and ranks top vendors, classifying them as Established Leaders, Leading Challengers, or Disruptors & Challengers.

Locates where complements amplify value and substitutes erode it, forecasting net impact by horizon

We deliver granular, decision-grade intel: market sizing, 5-year forecasts, pricing, adoption, usage, revenue, and operational KPIs—plus competitor tracking, regulation, and value chains—across 60 countries broadly.

Spot the shifts before they hit your P&L. We track inflection points, adoption curves, pricing moves, and ecosystem plays to show where demand is heading, why it is changing, and what to do next across high-growth markets and disruptive tech

Real-time reads of user behavior. We track shifting priorities, perceptions of today’s and next-gen services, and provider experience, then pace how fast tech moves from trial to adoption, blending buyer, consumer, and channel inputs with social signals (#WhySwitch, #UX).

Partner with our analyst team to build a custom report designed around your business priorities. From analysing market trends to assessing competitors or crafting bespoke datasets, we tailor insights to your needs.
Supplier Intelligence
Discovery & Profiling
Capacity & Footprint
Performance & Risk
Compliance & Governance
Commercial Readiness
Who Supplies Whom
Scorecards & Shortlists
Playbooks & Docs
Category Intelligence
Definition & Scope
Demand & Use Cases
Cost Drivers
Market Structure
Supply Chain Map
Trade & Policy
Operating Norms
Deliverables
Buyer Intelligence
Account Basics
Spend & Scope
Procurement Model
Vendor Requirements
Terms & Policies
Entry Strategy
Pain Points & Triggers
Outputs
Pricing Analysis
Benchmarks
Trends
Should-Cost
Indexation
Landed Cost
Commercial Terms
Deliverables
Brand Analysis
Positioning & Value Prop
Share & Presence
Customer Evidence
Go-to-Market
Digital & Reputation
Compliance & Trust
KPIs & Gaps
Outputs
Full Research Suite comprises of:
Market outlook & trends analysis
Interviews & case studies
Strategic recommendations
Vendor profiles & capabilities analysis
5-year forecasts
8 regions and 60+ country-level data splits
Market segment data splits
12 months of continuous data updates
DELIVERED AS:
PDF EXCEL ONLINE
Wine Packaging Market Size and Share Forecast Outlook 2025 to 2035
Wine Bag Market Forecast and Outlook 2025 to 2035
Wine Barrel Market Size and Share Forecast Outlook 2025 to 2035
Wine Cellar Market Size and Share Forecast Outlook 2025 to 2035
Wine Enzymes Market Analysis Size Share and Forecast Outlook 2025 to 2035
Cork Insulation Market Size and Share Forecast Outlook 2025 to 2035
Wine Box Market Size and Share Forecast Outlook 2025 to 2035
Wine Fining Agent Market Size and Share Forecast Outlook 2025 to 2035
Wine, Scotch, and Whiskey Barrels Market Size and Share Forecast Outlook 2025 to 2035
Wine Totes Packaging Market Size and Share Forecast Outlook 2025 to 2035
Wine Fermentation Equipment Market Size and Share Forecast Outlook 2025 to 2035
Wine Processing Equipment Market Size and Share Forecast Outlook 2025 to 2035
Wine Racks Market Size and Share Forecast Outlook 2025 to 2035
Wine Filling Machine Market Size and Share Forecast Outlook 2025 to 2035
Wine Bottle Sterilizer Market Size and Share Forecast Outlook 2025 to 2035
Wine Extract Market Size and Share Forecast Outlook 2025 to 2035
Wine Market Analysis - Size, Share, and Forecast Outlook 2025 to 2035
Wine Tourism Market Analysis - Size, Share, and Forecast Outlook 2025 to 2035
Wine Destemmer Market - Growth & Demand 2025 to 2035
Wine Crusher Market Growth - Winemaking Equipment & Industry Trends 2025 to 2035

Thank you!
You will receive an email from our Business Development Manager. Please be sure to check your SPAM/JUNK folder too.
Chat With
MaRIA