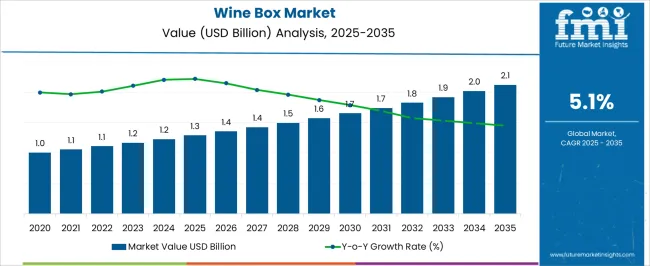
The global wine box market is set to enjoy a valuation of USD 1,112.5 Million in 2022, and further grow at a CAGR of 5.1% between 2022 and 2032 to reach USD 1,829.5 Million by 2032.
Rising demand for bottled wine across the world coupled with the increasing need for protecting wine products during storage and transportation is a key factor driving demand for wine boxes.
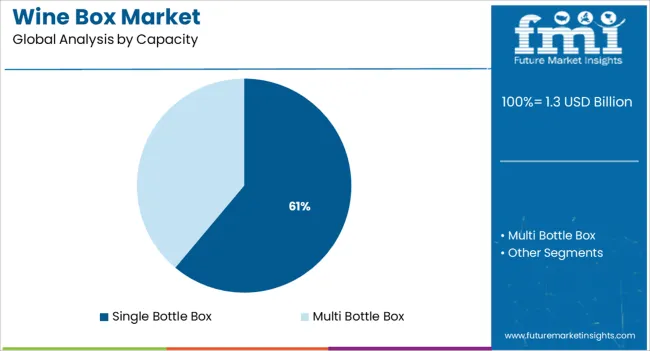
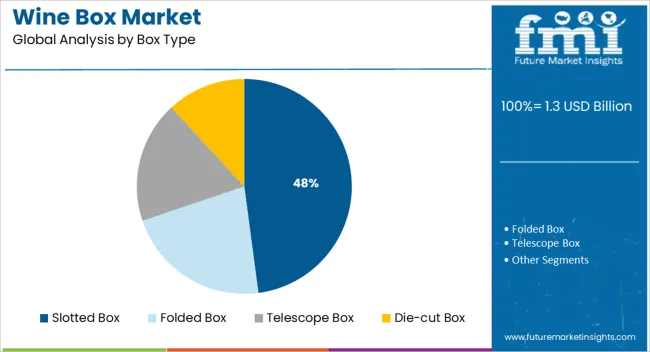
The sales of paper & paperboard wine boxes are anticipated to bolster with the top 3 countries estimated to hold around 25 to 30% of the market by the end of 2022. Based on the capacity, the multi-bottle box segment is projected to account for around 84% of the market value share by the end of 2022. The reason for the preference given to multi-bottle boxes is their ability to carry more than one bottle at a single time. By box type, the slotted box segment is projected to register a CAGR of 6.1% from 2022 to 2032.
With the propelling demand for rigid packaging, especially rigid boxes, from wine manufacturers, the overall sales of wine boxes are projected to create an absolute incremental growth opportunity of USD 771.0 Million.
Wine boxes are rigid wine packaging solutions generally made from paper & paperboard and wood materials. These protective packaging solutions help in protecting the wine bottles from any damage during transportation and storage.
Increasing consumption of bottled wine globally along with growing demand for effective alcoholic beverage packaging in the wine industry is expected to boost the worldwide market for wine boxes during the forecast period.
Demand for alcoholic beverages among the young consumer base has witnessed remarkable growth in recent years due to the increased number of alcohol-serving facilities, not only in the developed regions but also in the developing parts of the world. For instance, as per the International Organisation of Vine and Wine Intergovernmental Organisation (OIV), world wine consumption was estimated at 236 mhl in 2021, marking an increase of 2 mhl (+0.7%) compared to 2020 volume.
The rapid rise recorded in consumption and buying patterns of wine has a significant impact on the demand for spill-proof and safe packaging solutions for wine packaging. The number of wine manufacturers has increased as a result of the recent developments in Oenology. Along with that, an increase in the production of grapes has enabled wine manufacturers to produce wine around the year, irrespective of the season.
Not only the wine producers but the number of players producing wine packaging solutions for packaging single as well as multiple wine bottles has witnessed rapid growth. Increased number of industry players producing wine packaging solutions results in increased production and consumption of the wine box as a suitable packaging solution. The growing demand for wine directly drives the demand for the wine box and eventually positively contributes to the growth of the global wine box industry.
Leading manufacturers have shifted their focus towards offering customized alcoholic beverage packaging to their customers. This will help them to improve their market share significantly during the assessment period.
Attribute | Key Insights |
---|---|
Wine Box Market Estimated Value (2022) | USD 1,112.5 Million |
Projected Market Value (2032) | USD 1,829.5 Million |
Value-based CAGR (2022 to 2032) | 5.1% |
Collective Value Share: Top 5 Companies (2022E) | 15 to 20% |
According to Future Market Insights, the global market for wine boxes witnessed a CAGR of 3.5% during the historic period from 2015 to 2021 and reached a valuation of USD 1,058.5 Million at the end of 2021.
However, with the rising consumption of bottled wine across the world, the overall sales of wine boxes are projected to rise at 5.1% CAGR between 2022 and 2032.
A wine box is a rigid packaging solution made from paper & paperboard or wood materials to protect the wine bottles during their storage and transportation. Wine boxes are made available in different capacities such as single-bottle boxes and multi-bottle boxes to meet specific end-user demands.
Increasing consumption of wine across the world due to its various health benefits is a major factor augmenting the demand for wine packaging solutions including wine boxes.
The printability feature of the wine boxes is gaining momentum among wine brands as it acts as a marketing & branding tool for them. Leading wine bands are utilizing wine boxes to attract wine lovers.
Innovation is the constant force that propels major worldwide producers in the packaging sector. These businesses are regarded as market leaders in introducing cutting-edge packaging solutions to meet the needs of end users.
The packaging waste produced by conventional packaging has been addressed by some of these market leaders with the introduction of corrugated wine boxes. For wine packaging, Mondi plc, for instance, developed corrugated wine boxes.
Similarly, numerous local and international producers are shifting their focus to introducing corrugated wine boxes to increase their customer base. Wine producers in the most developing regions of the world are being introduced to such creative and economical packaging options. As a result, the global wine box industry has favorable growth prospects in both emerging and developed markets.
Growing Usage of Sustainable Corrugated Board to Boost the Market for Wine Boxes
Global, as well as domestic manufacturers, are turning to recyclable corrugated board material for manufacturing wine packaging solutions such as wine boxes. As the educated consumer class is becoming aware of the harmful effects of pollutant materials on the environment, demand for packaging solutions made from environment-friendly packaging materials is rising rapidly.
Campaigns regarding preserving forests have given rise to the demand for sustainability in every step of manufacturing the product as well as the packaging of the product. Manufacturers are switching to the usage of fully recyclable corrugated board, which can be easily recycled after proper disposal and has no negative effects on the environment.
The packaging industry also offers lucrative growth opportunities to wine box manufacturers, by differentiating their products based on the reusability features of the wine box made by them.
Global key players in alcoholic beverages can also highlight the sustainability of the wine box used to pack the wine bottles in it. Thus, the global wine box market is expected to register impressive growth over the next decade through the usage of sustainable raw materials to produce wine boxes.
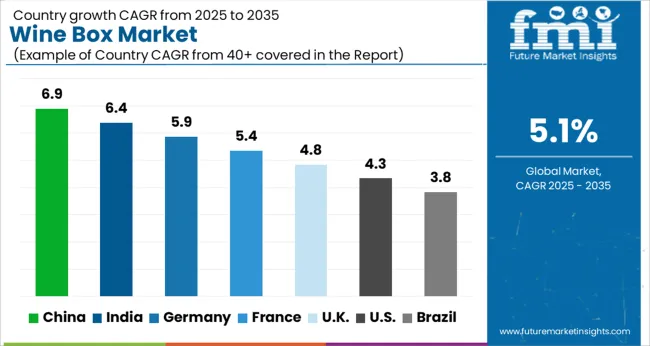
High Wine Consumption Generating Demand for Wine Boxes in the USA
As per FMI, the USA is projected to hold around 78% of the North American wine box market during the forecast period. The reason behind the same is the increasing consumption of wine in the USA
According to the Wine Institute, total wine consumption in the USA reached 3.2 gallons per resident in 2021 and this number is likely to further increase during the coming years as awareness about the health benefits of wine continues to grow. Driven by this, demand for wine boxes will surge at a steady pace across the USA
Moreover, the increasing usage of paper-based rigid boxes for protecting wine bottles during logistics operations along with the development of innovative wine boxes that can be used for aesthetic purposes as well, are expected to create lucrative opportunities for USA manufacturers.
Rising Export of Bottled Wine Boosting Wine Box Sales in Germany
As per FMI, the German wine box market is projected to expand at a CAGR of 4.9% during the forecast period owing to the increased export of bottled wine. According to the International Organisation of Vine and Wine Intergovernmental Organisation (OIV), in 2021, the share of bottled wine exports in terms of volume constituted around 73% in Germany. The increased export of bottled wine will therefore continue to generate demand for rigid wine packaging including wine boxes.
Similarly, the growing popularity of luxury packaging among wine lovers and the increasing number of wineries are expected to boost wine box sales during the assessment period.
Paper & Paperboard Remains the Most Preferred Material
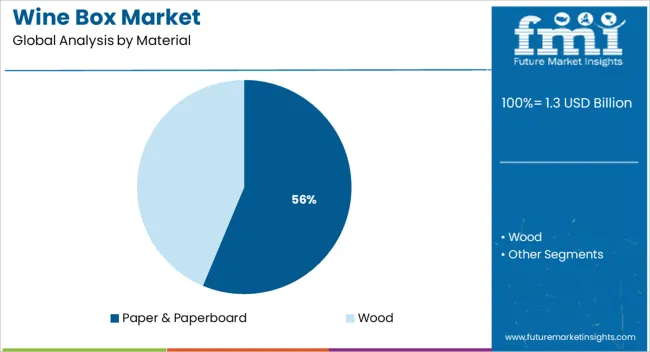
Based on the material, the paper & paperboard segment currently holds a substantial share of the global market for wine boxes and it is anticipated to grow 1.8x the current market value from 2022 to 2032. This can be attributed to the rising trend of sustainable packaging and the growing usage of paper & paperboard materials for making wine boxes due to their easy availability and low cost.
Immense features of paper & paperboard including lightweight and less expensive, are making them ideal materials for the production of wine boxes and the trend is likely to continue during the forecast period.
Growing Need for Bulk Packaging Bolstering Demand for Multi Bottle Boxes
As per FMI, the multi-bottle box segment is anticipated to grow at a CAGR of 4.8% during the forecast period of 2022 to 2032. This can be ascribed to the increased need for bulk packaging in the wine industry to carry multi wine bottles at a single time.
Multi-bottle boxes help to easily store and transport multiple bottles simultaneously, thereby reducing the need for extra packaging. As a result, both manufacturers and consumers are showing a preference for multi-bottle wine boxes over single ones.
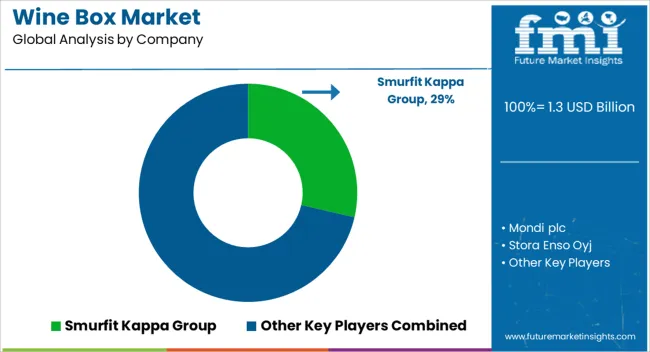
Leading players are upgrading their products with respect to unique features and properties. To gain a significant market share they are strategizing their goals. Some of these players are acquiring other small companies or are increasing their investments in research and innovations. Some of the development by the key players are as below-
Attribute | Details |
---|---|
Estimated Market Size (2022) | USD 1,112.5 Million |
Projected Market Size (2032) | USD 1,829.5 Million |
Anticipated Growth Rate (2022 to 2032) | 5.1% CAGR |
Historical Data | 2015 to 2021 |
Forecast Period | 2022 to 2032 |
Quantitative Units | Revenue in USD Billion, Volume in Units, and CAGR from 2022 to 2032 |
Segments Covered | Material, Capacity, Box Type, Region |
Regions Covered | North America; Latin America; Europe; East Asia; South Asia; Middle East and Africa; Oceania |
Key Countries Covered | USA, Canada, Mexico, Brazil, Germany, United Kingdom, France, Italy, Spain, Russia, China, Japan, India, GCC countries, Australia |
Key Companies Profiled | Smurfit Kappa Group; Mondi plc; Stora Enso Oyj; Graficas Digraf; Marber S.r.l.; Nordpack GmbH; Scotton SpA; OrCon Industries; Cartotrentina S.r.l.; Shenzhen Qingxin Packaging Co. Ltd.; SCHEFFAUER HOLZWAREN GESELLSCHAFT M.B.H.; YDP Quality Packaging (Shenzhen) Co., Ltd.; Adam Pack; Golden West Packaging Group; DS Smith plc |
Report Coverage | Revenue Forecast, Volume Forecast, Company Ranking, Competitive Landscape, Growth Factors, Trends, and Pricing Analysis |
Table 01: Global Market Value (US$ Billion) Forecast by Region, 2015 to 2032
Table 02: Global Market Volume (Units) Forecast by Region, 2015 to 2032
Table 03: Global Market Value (US$ Billion) Forecast by Material, 2015 to 2032
Table 04: Global Market Volume (Units) Forecast by Material, 2015 to 2032
Table 05: Global Market Value (US$ Billion) Forecast by Capacity, 2015 to 2032
Table 06: Global Market Volume (Units) Forecast by Capacity, 2015 to 2032
Table 07: Global Market Value (US$ Billion) Forecast by Box Type, 2015 to 2032
Table 08: Global Market Volume (Units) Forecast by Box Type, 2015 to 2032
Table 09: North America Market Value (US$ Billion) Forecast by Country, 2015 to 2032
Table 10: North America Market Volume (Units) Forecast by Country, 2015 to 2032
Table 11: North America Market Value (US$ Billion) Forecast by Material, 2015 to 2032
Table 12: North America Market Volume (Units) Forecast by Material, 2015 to 2032
Table 13: North America Market Value (US$ Billion) Forecast by Capacity, 2015 to 2032
Table 14: North America Market Volume (Units) Forecast by Capacity, 2015 to 2032
Table 15: North America Market Value (US$ Billion) Forecast by Box Type, 2015 to 2032
Table 16: North America Market Volume (Units) Forecast by Box Type, 2015 to 2032
Table 17: Latin America Market Value (US$ Billion) Forecast by Country, 2015 to 2032
Table 18: Latin America Market Volume (Units) Forecast by Country, 2015 to 2032
Table 19: Latin America Market Value (US$ Billion) Forecast by Material, 2015 to 2032
Table 20: Latin America Market Volume (Units) Forecast by Material, 2015 to 2032
Table 21: Latin America Market Value (US$ Billion) Forecast by Capacity, 2015 to 2032
Table 22: Latin America Market Volume (Units) Forecast by Capacity, 2015 to 2032
Table 23: Latin America Market Value (US$ Billion) Forecast by Box Type, 2015 to 2032
Table 24: Latin America Market Volume (Units) Forecast by Box Type, 2015 to 2032
Table 25: Europe Market Value (US$ Billion) Forecast by Country, 2015 to 2032
Table 26: Europe Market Volume (Units) Forecast by Country, 2015 to 2032
Table 27: Europe Market Value (US$ Billion) Forecast by Material, 2015 to 2032
Table 28: Europe Market Volume (Units) Forecast by Material, 2015 to 2032
Table 29: Europe Market Value (US$ Billion) Forecast by Capacity, 2015 to 2032
Table 30: Europe Market Volume (Units) Forecast by Capacity, 2015 to 2032
Table 31: Europe Market Value (US$ Billion) Forecast by Box Type, 2015 to 2032
Table 32: Europe Market Volume (Units) Forecast by Box Type, 2015 to 2032
Table 33: East Asia Market Value (US$ Billion) Forecast by Country, 2015 to 2032
Table 34: East Asia Market Volume (Units) Forecast by Country, 2015 to 2032
Table 35: East Asia Market Value (US$ Billion) Forecast by Material, 2015 to 2032
Table 36: East Asia Market Volume (Units) Forecast by Material, 2015 to 2032
Table 37: East Asia Market Value (US$ Billion) Forecast by Capacity, 2015 to 2032
Table 38: East Asia Market Volume (Units) Forecast by Capacity, 2015 to 2032
Table 39: East Asia Market Value (US$ Billion) Forecast by Box Type, 2015 to 2032
Table 40: East Asia Market Volume (Units) Forecast by Box Type, 2015 to 2032
Table 41: South Asia Market Value (US$ Billion) Forecast by Country, 2015 to 2032
Table 42: South Asia Market Volume (Units) Forecast by Country, 2015 to 2032
Table 43: South Asia Market Value (US$ Billion) Forecast by Material, 2015 to 2032
Table 44: South Asia Market Volume (Units) Forecast by Material, 2015 to 2032
Table 45: South Asia Market Value (US$ Billion) Forecast by Capacity, 2015 to 2032
Table 46: South Asia Market Volume (Units) Forecast by Capacity, 2015 to 2032
Table 47: South Asia Market Value (US$ Billion) Forecast by Box Type, 2015 to 2032
Table 48: South Asia Market Volume (Units) Forecast by Box Type, 2015 to 2032
Table 49: Oceania Market Value (US$ Billion) Forecast by Country, 2015 to 2032
Table 50: Oceania Market Volume (Units) Forecast by Country, 2015 to 2032
Table 51: Oceania Market Value (US$ Billion) Forecast by Material, 2015 to 2032
Table 52: Oceania Market Volume (Units) Forecast by Material, 2015 to 2032
Table 53: Oceania Market Value (US$ Billion) Forecast by Capacity, 2015 to 2032
Table 54: Oceania Market Volume (Units) Forecast by Capacity, 2015 to 2032
Table 55: Oceania Market Value (US$ Billion) Forecast by Box Type, 2015 to 2032
Table 56: Oceania Market Volume (Units) Forecast by Box Type, 2015 to 2032
Table 57: MEA Market Value (US$ Billion) Forecast by Country, 2015 to 2032
Table 58: MEA Market Volume (Units) Forecast by Country, 2015 to 2032
Table 59: MEA Market Value (US$ Billion) Forecast by Material, 2015 to 2032
Table 60: MEA Market Volume (Units) Forecast by Material, 2015 to 2032
Table 61: MEA Market Value (US$ Billion) Forecast by Capacity, 2015 to 2032
Table 62: MEA Market Volume (Units) Forecast by Capacity, 2015 to 2032
Table 63: MEA Market Value (US$ Billion) Forecast by Box Type, 2015 to 2032
Table 64: MEA Market Volume (Units) Forecast by Box Type, 2015 to 2032
Table 65: U.S. Market Value (US$ Billion) Forecast by Material, Capacity, and Box Type (2022(E) & 2032(F))
Table 66: Canada Market Value (US$ Billion) Forecast by Material, Capacity, and Box Type (2022(E) & 2032(F))
Table 67: Brazil Market Value (US$ Billion) Forecast by Material, Capacity, and Box Type (2022(E) & 2032(F))
Table 68: Mexico Market Value (US$ Billion) Forecast by Material, Capacity, and Box Type (2022(E) & 2032(F))
Table 69: Germany Market Value (US$ Billion) Forecast by Material, Capacity, and Box Type (2022(E) & 2032(F))
Table 70: Italy Market Value (US$ Billion) Forecast by Material, Capacity, and Box Type (2022(E) & 2032(F))
Table 71: France Market Value (US$ Billion) Forecast by Material, Capacity, and Box Type (2022(E) & 2032(F))
Table 72: Spain Market Value (US$ Billion) Forecast by Material, Capacity, and Box Type (2022(E) & 2032(F))
Table 73: U.K. Market Value (US$ Billion) Forecast by Material, Capacity, and Box Type (2022(E) & 2032(F))
Table 74: Russia Market Value (US$ Billion) Forecast by Material, Capacity, and Box Type (2022(E) & 2032(F))
Table 75: China Market Value (US$ Billion) Forecast by Material, Capacity, and Box Type (2022(E) & 2032(F))
Table 76: Japan Market Value (US$ Billion) Forecast by Material, Capacity, and Box Type (2022(E) & 2032(F))
Table 77: India Market Value (US$ Billion) Forecast by Material, Capacity, and Box Type (2022(E) & 2032(F))
Table 78: GCC Countries Market Value (US$ Billion) Forecast by Material, Capacity, and Box Type (2022(E) & 2032(F))
Table 79: Australia Market Value (US$ Billion) Forecast by Material, Capacity, and Box Type (2022(E) & 2032(F))
Figure 01: Global Market Value (US$ Billion) by Material, 2022 to 2032
Figure 02: Global Market Value (US$ Billion) by Capacity, 2022 to 2032
Figure 03: Global Market Value (US$ Billion) by Box Type, 2022 to 2032
Figure 04: Global Market Value (US$ Billion) by Region, 2022 to 2032
Figure 05: Global Market Value (US$ Billion) Analysis by Region, 2015 to 2021
Figure 06: Global Market Volume (Units) Analysis by Region, 2015 to 2032
Figure 07: Global Market Value Share (%) and BPS Analysis by Region, 2022 & 2032
Figure 08: Global Market Y-o-Y Growth (%) Projections by Region, 2022 to 2032
Figure 09: Global Market Value (US$ Billion) Analysis by Material, 2015 to 2021
Figure 10: Global Market Volume (Units) Analysis by Material, 2015 to 2032
Figure 11: Global Market Value Share (%) and BPS Analysis by Material, 2022 & 2032
Figure 12: Global Market Y-o-Y Growth (%) Projections by Material, 2022 to 2032
Figure 13: Global Market Value (US$ Billion) Analysis by Capacity, 2015 to 2021
Figure 14: Global Market Volume (Units) Analysis by Capacity, 2015 to 2032
Figure 15: Global Market Value Share (%) and BPS Analysis by Capacity, 2022 & 2032
Figure 16: Global Market Y-o-Y Growth (%) Projections by Capacity, 2022 to 2032
Figure 17: Global Market Value (US$ Billion) Analysis by Box Type, 2015 to 2021
Figure 18: Global Market Volume (Units) Analysis by Box Type, 2015 to 2032
Figure 19: Global Market Value Share (%) and BPS Analysis by Box Type, 2022 & 2032
Figure 20: Global Market Y-o-Y Growth (%) Projections by Box Type, 2022 to 2032
Figure 21: Global Market Attractiveness by Material, 2022 to 2032
Figure 22: Global Market Attractiveness by Capacity, 2022 to 2032
Figure 23: Global Market Attractiveness by Box Type, 2022 to 2032
Figure 24: Global Market Attractiveness by Box Type, 2022 to 2032
Figure 25: Global Market Attractiveness by Region, 2022 to 2032
Figure 26: North America Market Value (US$ Billion) by Material, 2022 to 2032
Figure 27: North America Market Value (US$ Billion) by Capacity, 2022 to 2032
Figure 28: North America Market Value (US$ Billion) by Box Type, 2022 to 2032
Figure 29: North America Market Value (US$ Billion) by Country, 2022 to 2032
Figure 30: North America Market Value (US$ Billion) Analysis by Country, 2015 to 2021
Figure 31: North America Market Volume (Units) Analysis by Country, 2015 to 2032
Figure 32: North America Market Value Share (%) and BPS Analysis by Country, 2022 & 2032
Figure 33: North America Market Y-o-Y Growth (%) Projections by Country, 2022 to 2032
Figure 34: North America Market Value (US$ Billion) Analysis by Material, 2015 to 2021
Figure 35: North America Market Volume (Units) Analysis by Material, 2015 to 2032
Figure 36: North America Market Value Share (%) and BPS Analysis by Material, 2022 & 2032
Figure 37: North America Market Y-o-Y Growth (%) Projections by Material, 2022 to 2032
Figure 38: North America Market Value (US$ Billion) Analysis by Capacity, 2015 to 2021
Figure 39: North America Market Volume (Units) Analysis by Capacity, 2015 to 2032
Figure 40: North America Market Value Share (%) and BPS Analysis by Capacity, 2022 & 2032
Figure 41: North America Market Y-o-Y Growth (%) Projections by Capacity, 2022 to 2032
Figure 42: North America Market Value (US$ Billion) Analysis by Box Type, 2015 to 2021
Figure 43: North America Market Volume (Units) Analysis by Box Type, 2015 to 2032
Figure 44: North America Market Value Share (%) and BPS Analysis by Box Type, 2022 & 2032
Figure 45: North America Market Y-o-Y Growth (%) Projections by Box Type, 2022 to 2032
Figure 46: North America Market Attractiveness by Material, 2022 to 2032
Figure 47: North America Market Attractiveness by Capacity, 2022 to 2032
Figure 48: North America Market Attractiveness by Box Type, 2022 to 2032
Figure 49: North America Market Attractiveness by Country, 2022 to 2032
Figure 50: Latin America Market Value (US$ Billion) by Material, 2022 & 2032
Figure 51: Latin America Market Value (US$ Billion) by Capacity, 2022 to 2032
Figure 52: Latin America Market Value (US$ Billion) by Box Type, 2022 to 2032
Figure 53: Latin America Market Value (US$ Billion) by Country, 2022 to 2032
Figure 54: Latin America Market Value (US$ Billion) Analysis by Country, 2015 to 2021
Figure 55: Latin America Market Volume (Units) Analysis by Country, 2015 to 2032
Figure 56: Latin America Market Value Share (%) and BPS Analysis by Country, 2022 & 2032
Figure 57: Latin America Market Y-o-Y Growth (%) Projections by Country, 2022 to 2032
Figure 58: Latin America Market Value (US$ Billion) Analysis by Material, 2015 to 2021
Figure 59: Latin America Market Volume (Units) Analysis by Material, 2015 to 2032
Figure 60: Latin America Market Value Share (%) and BPS Analysis by Material, 2022 & 2032
Figure 61: Latin America Market Y-o-Y Growth (%) Projections by Material, 2022 to 2032
Figure 62: Latin America Market Value (US$ Billion) Analysis by Capacity, 2015 to 2021
Figure 63: Latin America Market Volume (Units) Analysis by Capacity, 2015 to 2032
Figure 64: Latin America Market Value Share (%) and BPS Analysis by Capacity, 2022 & 2032
Figure 65: Latin America Market Y-o-Y Growth (%) Projections by Capacity, 2022 to 2032
Figure 66: Latin America Market Value (US$ Billion) Analysis by Box Type, 2015 to 2021
Figure 67: Latin America Market Volume (Units) Analysis by Box Type, 2015 to 2032
Figure 68: Latin America Market Value Share (%) and BPS Analysis by Box Type, 2022 & 2032
Figure 69: Latin America Market Y-o-Y Growth (%) Projections by Box Type, 2022 to 2032
Figure 70: Latin America Market Attractiveness by Material, 2022 to 2032
Figure 71: Latin America Market Attractiveness by Capacity, 2022 to 2032
Figure 72: Latin America Market Attractiveness by Box Type, 2022 to 2032
Figure 73: Latin America Market Attractiveness by Country, 2022 to 2032
Figure 74: Europe Market Value (US$ Billion) by Material, 2022 to 2032
Figure 75: Europe Market Value (US$ Billion) by Capacity, 2022 to 2032
Figure 76: Europe Market Value (US$ Billion) by Box Type, 2022 to 2032
Figure 77: Europe Market Value (US$ Billion) by Country, 2022 to 2032
Figure 78: Europe Market Value (US$ Billion) Analysis by Country, 2015 to 2021
Figure 79: Europe Market Volume (Units) Analysis by Country, 2015 to 2032
Figure 80: Europe Market Value Share (%) and BPS Analysis by Country, 2022 & 2032
Figure 81: Europe Market Y-o-Y Growth (%) Projections by Country, 2022 to 2032
Figure 82: Europe Market Value (US$ Billion) Analysis by Material, 2015 to 2021
Figure 83: Europe Market Volume (Units) Analysis by Material, 2015 to 2032
Figure 84: Europe Market Value Share (%) and BPS Analysis by Material, 2022 & 2032
Figure 85: Europe Market Y-o-Y Growth (%) Projections by Material, 2022 to 2032
Figure 86: Europe Market Value (US$ Billion) Analysis by Capacity, 2015 to 2021
Figure 87: Europe Market Volume (Units) Analysis by Capacity, 2015 to 2032
Figure 88: Europe Market Value Share (%) and BPS Analysis by Capacity, 2022 & 2032
Figure 89: Europe Market Y-o-Y Growth (%) Projections by Capacity, 2022 to 2032
Figure 90: Europe Market Value (US$ Billion) Analysis by Box Type, 2015 to 2021
Figure 91: Europe Market Volume (Units) Analysis by Box Type, 2015 to 2032
Figure 92: Europe Market Value Share (%) and BPS Analysis by Box Type, 2022 & 2032
Figure 93: Europe Market Y-o-Y Growth (%) Projections by Box Type, 2022 to 2032
Figure 94: Europe Market Attractiveness by Material, 2022 to 2032
Figure 95: Europe Market Attractiveness by Capacity, 2022 to 2032
Figure 96: Europe Market Attractiveness by Box Type, 2022 to 2032
Figure 97: Europe Market Attractiveness by Country, 2022 to 2032
Figure 98: East Asia Market Value (US$ Billion) by Material, 2022 to 2032
Figure 99: East Asia Market Value (US$ Billion) by Capacity, 2022 to 2032
Figure 100: East Asia Market Value (US$ Billion) by Box Type, 2022 to 2032
Figure 101: East Asia Market Value (US$ Billion) by Country, 2022 to 2032
Figure 102: East Asia Market Value (US$ Billion) Analysis by Country, 2015 to 2021
Figure 103: East Asia Market Volume (Units) Analysis by Country, 2015 to 2032
Figure 104: East Asia Market Value Share (%) and BPS Analysis by Country, 2022 & 2032
Figure 105: East Asia Market Y-o-Y Growth (%) Projections by Country, 2022 to 2032
Figure 106: East Asia Market Value (US$ Billion) Analysis by Material, 2015 to 2021
Figure 107: East Asia Market Volume (Units) Analysis by Material, 2015 to 2032
Figure 108: East Asia Market Value Share (%) and BPS Analysis by Material, 2022 & 2032
Figure 109: East Asia Market Y-o-Y Growth (%) Projections by Material, 2022 to 2032
Figure 110: East Asia Market Value (US$ Billion) Analysis by Capacity, 2015 to 2021
Figure 111: East Asia Market Volume (Units) Analysis by Capacity, 2015 to 2032
Figure 112: East Asia Market Value Share (%) and BPS Analysis by Capacity, 2022 & 2032
Figure 113: East Asia Market Y-o-Y Growth (%) Projections by Capacity, 2022 to 2032
Figure 114: East Asia Market Value (US$ Billion) Analysis by Box Type, 2015 to 2021
Figure 115: East Asia Market Volume (Units) Analysis by Box Type, 2015 to 2032
Figure 116: East Asia Market Value Share (%) and BPS Analysis by Box Type, 2022 & 2032
Figure 117: East Asia Market Y-o-Y Growth (%) Projections by Box Type, 2022 to 2032
Figure 118: East Asia Market Attractiveness by Material, 2022 to 2032
Figure 119: East Asia Market Attractiveness by Capacity, 2022 to 2032
Figure 120: East Asia Market Attractiveness by Box Type, 2022 to 2032
Figure 121: East Asia Market Attractiveness by Country, 2022 to 2032
Figure 122: South Asia Market Value (US$ Billion) by Material, 2022 to 2032
Figure 123: South Asia Market Value (US$ Billion) by Capacity, 2022 to 2032
Figure 124: South Asia Market Value (US$ Billion) by Box Type, 2022 to 2032
Figure 125: South Asia Market Value (US$ Billion) by Country, 2022 to 2032
Figure 126: South Asia Market Value (US$ Billion) Analysis by Country, 2015 to 2021
Figure 127: South Asia Market Volume (Units) Analysis by Country, 2015 to 2032
Figure 128: South Asia Market Value Share (%) and BPS Analysis by Country, 2022 & 2032
Figure 129: South Asia Market Y-o-Y Growth (%) Projections by Country, 2022 to 2032
Figure 130: South Asia Market Value (US$ Billion) Analysis by Material, 2015 to 2021
Figure 131: South Asia Market Volume (Units) Analysis by Material, 2015 to 2032
Figure 132: South Asia Market Value Share (%) and BPS Analysis by Material, 2022 & 2032
Figure 133: South Asia Market Y-o-Y Growth (%) Projections by Material, 2022 to 2032
Figure 134: South Asia Market Value (US$ Billion) Analysis by Capacity, 2015 to 2021
Figure 135: South Asia Market Volume (Units) Analysis by Capacity, 2015 to 2032
Figure 136: South Asia Market Value Share (%) and BPS Analysis by Capacity, 2022 & 2032
Figure 137: South Asia Market Y-o-Y Growth (%) Projections by Capacity, 2022 to 2032
Figure 138: South Asia Market Value (US$ Billion) Analysis by Box Type, 2015 to 2021
Figure 139: South Asia Market Volume (Units) Analysis by Box Type, 2015 to 2032
Figure 140: South Asia Market Value Share (%) and BPS Analysis by Box Type, 2022 & 2032
Figure 141: South Asia Market Y-o-Y Growth (%) Projections by Box Type, 2022 to 2032
Figure 142: South Asia Market Attractiveness by Material, 2022 to 2032
Figure 143: South Asia Market Attractiveness by Capacity, 2022 to 2032
Figure 144: South Asia Market Attractiveness by Box Type, 2022 to 2032
Figure 145: South Asia Market Attractiveness by Country, 2022 to 2032
Figure 146: Oceania Market Value (US$ Billion) by Material, 2022 to 2032
Figure 147: Oceania Market Value (US$ Billion) by Capacity, 2022 to 2032
Figure 148: Oceania Market Value (US$ Billion) by Box Type, 2022 to 2032
Figure 149: Oceania Market Value (US$ Billion) by Country, 2022 to 2032
Figure 150: Oceania Market Value (US$ Billion) Analysis by Country, 2015 to 2021
Figure 151: Oceania Market Volume (Units) Analysis by Country, 2015 to 2032
Figure 152: Oceania Market Value Share (%) and BPS Analysis by Country, 2022 & 2032
Figure 153: Oceania Market Y-o-Y Growth (%) Projections by Country, 2022 to 2032
Figure 154: Oceania Market Value (US$ Billion) Analysis by Material, 2015 to 2021
Figure 155: Oceania Market Volume (Units) Analysis by Material, 2015 to 2032
Figure 156: Oceania Market Value Share (%) and BPS Analysis by Material, 2022 & 2032
Figure 157: Oceania Market Y-o-Y Growth (%) Projections by Material, 2022 to 2032
Figure 158: Oceania Market Value (US$ Billion) Analysis by Capacity, 2015 to 2021
Figure 159: Oceania Market Volume (Units) Analysis by Capacity, 2015 to 2032
Figure 160: Oceania Market Value Share (%) and BPS Analysis by Capacity, 2022 & 2032
Figure 161: Oceania Market Y-o-Y Growth (%) Projections by Capacity, 2022 to 2032
Figure 162: Oceania Market Value (US$ Billion) Analysis by Box Type, 2015 to 2021
Figure 163: Oceania Market Volume (Units) Analysis by Box Type, 2015 to 2032
Figure 164: Oceania Market Value Share (%) and BPS Analysis by Box Type, 2022 & 2032
Figure 165: Oceania Market Y-o-Y Growth (%) Projections by Box Type, 2022 to 2032
Figure 166: Oceania Market Attractiveness by Material, 2022 to 2032
Figure 167: Oceania Market Attractiveness by Capacity, 2022 to 2032
Figure 168: Oceania Market Attractiveness by Box Type, 2022 to 2032
Figure 169 Oceania Market Attractiveness by Country, 2022 to 2032
Figure 170: MEA Market Value (US$ Billion) by Material, 2022 to 2032
Figure 171: MEA Market Value (US$ Billion) by Capacity, 2022 to 2032
Figure 172: MEA Market Value (US$ Billion) by Box Type, 2022 to 2032
Figure 173: MEA Market Value (US$ Billion) by Country, 2022 to 2032
Figure 174: MEA Market Value (US$ Billion) Analysis by Country, 2015 to 2021
Figure 175: MEA Market Volume (Units) Analysis by Country, 2015 to 2032
Figure 176: MEA Market Value Share (%) and BPS Analysis by Country, 2022 & 2032
Figure 177: MEA Market Y-o-Y Growth (%) Projections by Country, 2022 to 2032
Figure 178: MEA Market Value (US$ Billion) Analysis by Material, 2015 to 2021
Figure 179: MEA Market Volume (Units) Analysis by Material, 2015 to 2032
Figure 180: MEA Market Value Share (%) and BPS Analysis by Material, 2022 & 2032
Figure 181: MEA Market Y-o-Y Growth (%) Projections by Material, 2022 to 2032
Figure 182: MEA Market Value (US$ Billion) Analysis by Capacity, 2015 to 2021
Figure 183: MEA Market Volume (Units) Analysis by Capacity, 2015 to 2032
Figure 184: MEA Market Value Share (%) and BPS Analysis by Capacity, 2022 & 2032
Figure 185: MEA Market Y-o-Y Growth (%) Projections by Capacity, 2022 to 2032
Figure 186: MEA Market Value (US$ Billion) Analysis by Box Type, 2015 to 2021
Figure 187: MEA Market Volume (Units) Analysis by Box Type, 2015 to 2032
Figure 188: MEA Market Value Share (%) and BPS Analysis by Box Type, 2022 & 2032
Figure 189: MEA Market Y-o-Y Growth (%) Projections by Box Type, 2022 to 2032
Figure 190: MEA Market Attractiveness by Material, 2022 to 2032
Figure 191: MEA Market Attractiveness by Capacity, 2022 to 2032
Figure 192: MEA Market Attractiveness by Box Type, 2022 to 2032
Figure 193 MEA Market Attractiveness by Country, 2022 to 2032
The global wine box market size is expected to reach USD 1,112.5 Million in 2022.
During the forecast period, demand for wine boxes is anticipated to surge at a CAGR of 5.1%.
The global market for wine boxes is expected to reach a valuation of USD 1,829.5 Million by the end of 2032.
During the forecast period, paper & paperboard material is likely to be the fastest-growing material segment in the global market.
Increasing consumption of bottled wine is projected to drive the demand for wine boxes across the globe.
Smurfit Kappa Group plc, Mondi plc, Stora Enso Oyj, DS Smith plc, Graficas Digraf, Marber S.r.l., and Nordpack GmbH are the top players supplementing the sales of the wine boxes.
As per the FMI, the China market is projected to grow 1.8x the current market value during the forecast period (2022 to 2032).
Explore Similar Insights
Thank you!
You will receive an email from our Business Development Manager. Please be sure to check your SPAM/JUNK folder too.