Reports

- Global Locations -

Headquarters

Future Market Insights, Inc.

Christiana Corporate, 200
Continental Drive, Suite 401,
Newark, Delaware - 19713,
United States

T: +1-845-579-5705

Americas

Future Market Insights, Inc.

616 Corporate Way, Suite 2-9018,
Valley Cottage, NY 10989, United States

T: +1-347-918-3531

MEA

Future Market Insights

1602-6 Jumeirah Bay X2 Tower, Plot No: JLT-PH2-X2A,
Jumeirah Lakes Towers, Dubai,
United Arab Emirates

Europe

Future Market Insights

3rd Floor, 207 Regent Street,
W1B 3HH London
United Kingdom

T: + 44 (0) 20 8123 9659
D: +44 (0) 20 3287 4268

Asia Pacific

Future Market Insights

IndiaLand Global Tech Park, Unit UG-1, Behind Grand HighStreet, Phase 1, Hinjawadi, MH, Pune – 411057, India

Wine Fermentation Equipment Market Outlook (2023 to 2033)

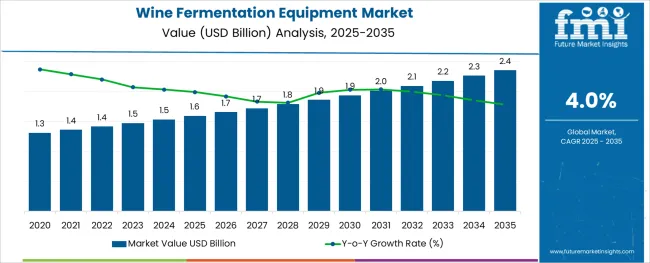
During the projected period (2023 to 2033), the global wine fermentation equipment market is expected to grow at a CAGR of 4.0%. The market is expected to surge to US$ 2,173.3 Million by the end of 2033 from US$ 1,468.2 Million in 2023.

Wine fermentation is the process of turning grape juice into wine. Fermentation occurs when yeast breaks down the sugar in the grape juice, releasing carbon dioxide and alcohol. This process can be done by using a wide variety of methods and equipment.

The most common type of fermentation equipment is the open-top fermenter. This type of fermenter is typically made of stainless steel or food-grade plastic and has a large opening at the top. The open-top fermenter allows for easy access to the must (grape juice and solids) during fermentation. Open-top fermenters are often used for red wine production as they allow for better contact between the must and skins, which helps to extract color and flavor from the grapes.

The global market is estimated to grow at a steady pace in the evaluation period with an increasing number of wineries in both developed and developing countries. There has been a surging need for wine among consumers over the past couple of years on the back of high disposable income and rising pub culture worldwide.

Millennials nowadays have become more experimental with their perception, taste, and consumption habits regarding specific alcohol products such as beer, champagne, and wine, which vary from boomers. Thus, rising consumption of wine would provide new growth opportunities for key players to expand their wine fermentation equipment product lines.

However, the price of equipment utilized in wine-making changes as per the winery size (cases) and capacity, which may hamper the market, especially in emerging economies. Countries like China and India have price-sensitive consumers that do not spend more money on premium products. Therefore, wine fermentation equipment companies in these countries hesitate to invest huge sums in purchasing new advanced machinery and other related tools.

On the other hand, developed countries are expected to witness high demand for wine fermentation equipment for both commercial and household applications with growing disposable income. In June 2021, for instance, Portland Kettle Works, a leading manufacturer of high-quality stainless steel brewing and beverage equipment, introduced Wine Tanks NW, which is a website dedicated to offering high-quality stainless steel wine tanks to winemakers across the USA and the Pacific Northwest.

Attributes Key Insights
Global Wine Fermentation Equipment Market Estimated Size (2023E) US$ 1,468.2 Million
Projected Market Valuation (2033F) US$ 2,173.3 Million
Value-based CAGR (2023 to 2033) 4.0%
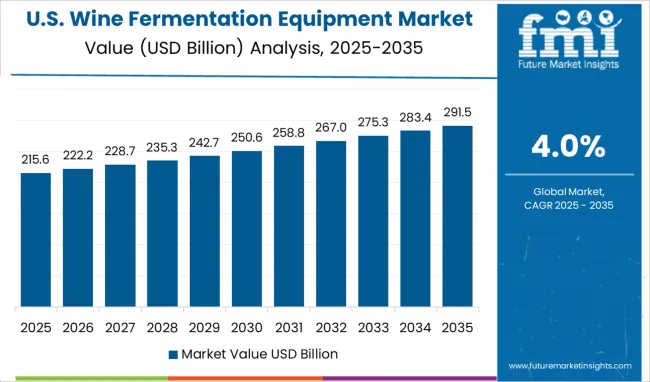
Market Share of the USA 34.8%

Don't pay for what you don't need

Customize your report by selecting specific countries or regions and save 30%!

2018 to 2022 Global Wine Fermentation Equipment Market Outlook Compared to 2023 to 2033 Demand Forecast

As per FMI, the global wine fermentation equipment market exhibited steady growth at a CAGR of 3.3% during the historical period. This growth was attributed to the rising application of wine fermentation equipment to ease the processing of wine worldwide.

Increasing adoption of automation and robotics in winemaking is projected to create new opportunities for wine fermentation equipment manufacturers. Winery motion automated equipment, automated packaging, and temperature controls are some of the state-of-the-art features that are being developed by renowned companies across the globe.

As per Wine Institute, in 2021, nearly 271.2 million 9-liter cases of wine were shipped from California to all markets in the USA and abroad. In 2020, wine shipments from California reached 269.2 million 9-liter cases. These numbers are estimated to grow at a rapid pace in the next ten years, thereby driving the global market.

Wine Fermentation Equipment Market

Market-o-nomics - Highlighting the Key Trends

A number of influential factors have been identified to stir the soup in the wine fermentation equipment market. Besides the proliferating aspects prevailing in the market, the analysts at FMI have also analyzed the restraining elements, lucrative opportunities, and upcoming threats that can pose a challenge to the progression of the wine fermentation equipment market.

The drivers, restraints, opportunities, and threats (DROTs) identified are as follows:

DRIVERS

  • Easy availability of wines through online portals and food retailers, apart from restaurants, bars, and hotels is anticipated to augur well for the market.
  • Increasing demand for table wine owing to its easy accessibility and inexpensive nature is expected to boost the market.

RESTRAINTS

  • Small-scale brands may have a hard time gaining placement on wine lists and supermarket shelves as the head office may select a handful of brands in all of their locations.
  • Excessive consumption of red wine can lead to serious heart diseases like atrial fibrillation, which is a type of rapid or irregular heartbeat.

OPPORTUNITIES

  • Expansion of the middle-class population across Brazil and Argentina can help major wine importers like Interfood Importação and Expand Importadora to launch innovative marketing campaigns in the forecast period.
  • Increasing spending by consumers on higher-value products, mainly across a wide range of categories such as premium wine, is projected to create new growth opportunities for companies.

THREATS

  • White wines are acidic in nature and thus are considered to be harmful to the teeth.
  • Drinking too many sparkling wines like champagne can trigger migraines and add up more calories in the body.
Nandini Roy Choudhury

Principal Consultant

Talk to Analyst

Find your sweet spots for generating winning opportunities in this market.

Country-wise Insights

How is Wine Fermentation Equipment Companies Faring in the USA.?

Relaxed Trade Duties in the USA to Propel Sales of Wine Fermentation Kits by 2033

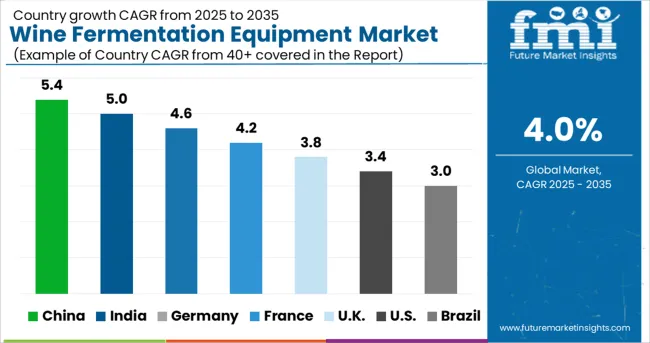
According to FMI, the wine fermentation equipment market in the USA is set to grow at a CAGR of 38% in the next ten years. Since time immemorial, massive demand for wine has been the source of all USA manufacturers’ inspiration, encouraging them to come up with innovative products.

Also, relaxed trade duties and tariffs in the country are projected to boost the popularity of wine in the USA as per the Wine Institute, in 2021, the total wine consumption per resident was 3.18 gals, while it was 3.07 gals in 2020.

Why is Germany Showcasing Exponential Demand for Wine Fermentation Equipment?

The emergence of Sensorial & Premium Brands in Germany to Drive the Demand for Wine Fermenter Buckets

Europe is witnessing a two-fold increase in the production of wine, with Germany at the top of the list. This is because customers in the nation are becoming more interested in sustainable food and beverage products that also have various health advantages.

According to FMI, the German wine fermentation equipment market is expected to grow at a CAGR of 4.4% in the evaluation period. Consumption of wine in the country is nowadays more associated with a lavish and wealthy lifestyle of consumers. They are looking to purchase a wide variety of products with distinct tastes, which is compelling key companies to come up with sensorial and premium brands in the German market.

In September 2022, Weingut Battenfeld Spanier, a reputed German wine estate, unveiled its ‘rising star’ Riesling on La Place through ne?gociant Maison Ginestet. The C.O Liquid Earth Riesling does not fall under the standard site categorization as it was sourced from a selection of the oldest vines.

Why is China Emerging as a High-potential Hub for Wine Fermentation Equipment?

Launch of China-exclusive Wines to Boost Sales of Wine Fermentation Vessels by 2033

According to FMI, the wine fermentation equipment market in China is estimated to showcase rapid growth in the assessment period. Innovation in flavor and premiumization of wine products are mainly responsible for pushing sales of wine fermentation equipment in the country.

In August 2022, for instance, Penfolds, a flagship Australian wine brand, which is owned by Treasury Wine Estates, introduced a China-exclusive wine at the country’s VATS Liquor Store, which is the most renowned nationwide spirits and wine distributor.

Penfolds Tribute 177 is made from Californian grapes and was developed primarily for VATS Liquor Store only for the mainland Chinese market. Such product launches catering to the taste and requirements of Chinese consumers are projected to augur well for the market.

How are Sales of Wine Fermentation Equipment Growing in the UK?

Introduction of Canned Products in the UK to Augment Sales of Red Wine Fermentation Tanks

During the projected period, the UK is expected to be one of the fastest-developing markets for wine fermentation equipment, says FMI. The country’s wine fermentation equipment industry is being driven by increasing demand for wine in cafeterias, hotels, quick-service restaurants, and full-service restaurants.

Premiumization is also becoming a part of ongoing trends among millennials and gen Z, thereby attracting long-term revenue by key companies in the UK Introduction of canned products by various wine-making companies in the country to provide high convenience and portability to consumers would also help the market to grow in the UK

In September 2022, for instance, British Airways announced the launch of its new online wine shop by collaborating with IAG Loyalty. It will enable consumers to utilize their Avios loyalty points to collect points from online wine purchases, as well as buy wine. Similar initiatives taken by various renowned companies in the UK are anticipated to push sales.

Category-wise Insights

Which is the Leading Application of Wine Fermentation Equipment?

The emergence of Marijuana-infused Beverages to Bolster Sales of Wine-Making Fermenters among Commercial Kitchens

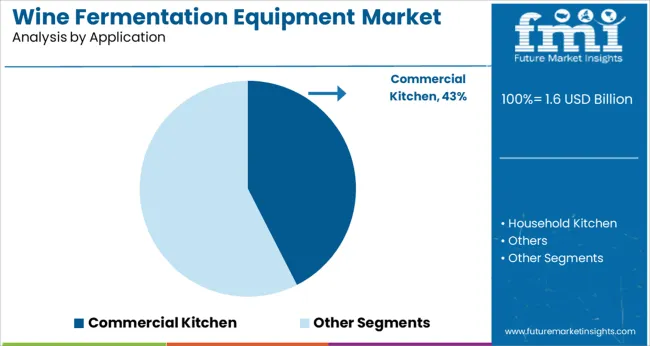
Based on application, the global wine fermentation equipment market is segregated into commercial kitchens, household kitchens, and others. Out of these, the commercial kitchen segment is projected to dominate the market throughout the forecast period.

Key market players are nowadays focusing on the development of new flavored fortified wines to meet the changing consumer preferences. Thus, they are installing unique wine fermentation equipment and other associated tools in their manufacturing facilities.

The trend for consuming marijuana-infused wines is anticipated to surge at a rapid pace across developed countries worldwide. In March 2021, for instance, Raphael De Pablo, a young entrepreneur, launched the first wine infused with a cannabis extract in France. He named it the Burdi W Brand.

Get the data you need at a Fraction of the cost

Personalize your report by choosing insights you need
and save 40%!

Competitive Landscape

The global wine fermentation equipment market is projected to witness the entry of a large number of newcomers. They are set to provide advanced equipment to the food service industry globally. International companies are currently focusing on meeting the high demand from end users by launching new flavors of wines with the help of advanced machinery.

For instance:

  • In November 2022, Foss, a winemaking instrument developer, introduced an instrument that allows winemakers to analyze their wines at the touch of a button in a minute. It is named OenoFoss 2 and it is an easier-to-use product, as compared to the original OenoFoss, which was launched back in 2008.
  • In September 2022, Aizawa Concrete, a Japan-based firm, announced its plans to mass-produce wine fermentation tanks made out of concrete. It will soon make test samples to reduce the use of traditional stainless-steel tanks in wineries across Hokkaido, Yamanashi, and Nagano.

Scope of the Wine Fermentation Equipment Market Report

Attribute Details
Estimated Market Size (2023) US$ 1,468.2 Million
Projected Market Valuation (2033) US$ 2,173.3 Million
Value-based CAGR (2023 to 2033) 4.0%
Forecast Period 2023 to 2033
Historical Data Available for 2018 to 2022
Market Analysis Value (US$ Million)
Key Regions Covered
  • North America
  • Latin America
  • Europe
  • Asia Pacific
  • Oceania
  • Middle East and Africa (MEA)
Key Countries Covered
  • USA
  • Canada
  • Mexico
  • Germany
  • UK
  • France
  • Italy
  • Spain
  • China
  • Japan
  • India
  • South Korea
  • Australia
  • Brazil
  • Argentina
  • South Africa
  • UAE
Key Segments Covered
  • Product
  • Application Application
  • Region
Key Companies Profiled
Report Coverage Market Forecast, Company Share Analysis, Competitive Landscape, Drivers, Restraints, Opportunities and Threats Analysis, Market Dynamics and Challenges, and Strategic Growth Initiatives

Wine Fermentation Equipment Market Outlook by Category

By Product:

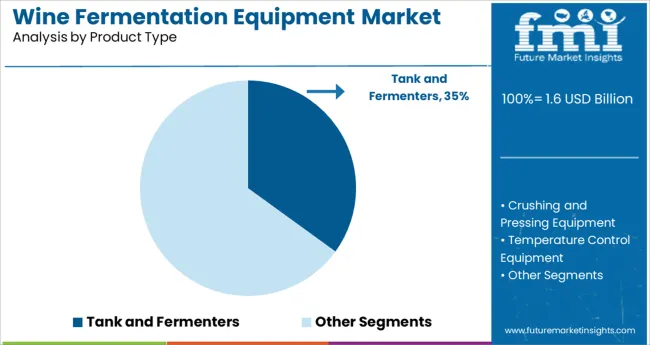
  • Tank and Fermenters
  • Crushing and Pressing Equipment
  • Temperature Control Equipment
  • Filtration Equipment

By Application:

  • Commercial Kitchen
  • Household Kitchen
  • Others

By Region:

  • North America
  • Latin America
  • Europe
  • East Asia
  • South Asia
  • Oceania
  • Middle East and Africa (MEA)

Frequently Asked Questions

How big is the wine fermentation equipment market?

The wine fermentation equipment market size is projected to reach US$ 1,468.2 Million by 2023.

At what rate is the wine fermentation equipment market expected to rise?

The wine fermentation equipment market is expected to rise at a CAGR of 4.0% in the forecast period.

What is the North America wine fermentation equipment market outlook?

The North America wine fermentation equipment market is expected to register a 38% CAGR between 2023 and 2033.

Which are the major countries driving demand for wine fermentation equipment?

The USA, China, Canada, Germany, and Mexico are the major countries driving demand for wine fermentation equipment.

At what rate will the demand for wine fermentation equipment grow in China?

The demand for wine fermentation equipment in China is projected to grow at a rate of 32% in the evaluation period.

At what rate will the demand for wine fermentation equipment Grow in Europe?

The demand for wine fermentation equipment in Europe is expected to grow at 40% CAGR between 2023 and 2033.

Who are the top 5 players providing high-quality wine fermentation equipment?

Cuica Pro, Euro dib, Philips, Lakeland and Atlas, and Imperia are the top 5 players providing high-quality wine fermentation equipment.

At what rate will the sales of wine fermentation equipment grow in Mexico?

Sales of wine fermentation equipment in Mexico are projected to grow at a CAGR of around 5.6% over the next ten years.

What is the demand outlook forecast for the wine fermentation equipment market?

The global wine fermentation equipment market is estimated to surpass US$ 780 Million by the end of 2033.

Table of Content

1. Executive Summary | Wine Fermentation Equipment

    1.1. Global Market Outlook

    1.2. Demand-side Trends

    1.3. Supply-side Trends

    1.4. Technology Roadmap Analysis

    1.5. Analysis and Recommendations

2. Market Overview

    2.1. Market Coverage / Taxonomy

    2.2. Market Definition / Scope / Limitations

3. Market Background

    3.1. Market Dynamics

        3.1.1. Drivers

        3.1.2. Restraints

        3.1.3. Opportunity

        3.1.4. Trends

    3.2. Scenario Forecast

        3.2.1. Demand in Optimistic Scenario

        3.2.2. Demand in Likely Scenario

        3.2.3. Demand in Conservative Scenario

    3.3. Product launches & Recent Developments

    3.4. Product Life Cycle Analysis

    3.5. Value Chain Analysis

        3.5.1. Supply Side Participants and their Roles

            3.5.1.1. Producers

            3.5.1.2. Mid-Level Participants (Traders/ Agents/ Brokers)

            3.5.1.3. Wholesalers and Distributors

        3.5.2. % of Operating Margin Analysis

        3.5.3. List of Raw Material Suppliers

        3.5.4. List of Existing and Potential Buyers

    3.6. Global MarketMarket - Pricing Analysis

        3.6.1. Price Point Assessment by Region

        3.6.2. Price Point Assessment by Product Type

        3.6.3. Price Forecast till 2033

        3.6.4. Factors affecting pricing

    3.7. Forecast Factors - Relevance & Impact

    3.8. PESTLE and Porter’s Analysis

    3.9. Regulatory Landscape

        3.9.1. Packaging & Labelling Regulations

        3.9.2. Certifications and Certifying Agency Overview

        3.9.3. Import/Export Policies

    3.10. Regional Parent Market Outlook

    3.11. Production and Consumption Statistics

    3.12. Import and Export Statistics

    3.13. Consumers Survey Analysis

    3.14. Macro-Economic Factors

    3.15. Product Claims & Nutritional Information scanned by Buyers

4. Global MarketAnalysis 2018 to 2022 and Forecast, 2023 to 2033

    4.1. Historical Market Size Value (US$ Million) & Volume (MT) Analysis, 2018 to 2022

    4.2. Current and Future Market Size Value (US$ Million) & Volume (MT) Projections, 2023 to 2033

        4.2.1. Y-o-Y Growth Trend Analysis

        4.2.2. Absolute $ Opportunity Analysis

5. Global MarketAnalysis 2018 to 2022 and Forecast 2023 to 2033, By Product Type

    5.1. Introduction / Key Findings

    5.2. Historical Market Size Value (US$ Million) & Volume (MT) Analysis By Product Type, 2018 to 2022

    5.3. Current and Future Market Size Value (US$ Million) & Volume (MT) Analysis and Forecast By Product Type, 2023 to 2033

        5.3.1. Tank and Fermenters

        5.3.2. Crushing and Pressing Equipment Market

        5.3.3. Temperature Control Equipment Market

        5.3.4. Filtration Equipment Market

    5.4. Y-o-Y Growth Trend Analysis By Product Type, 2018 to 2022

    5.5. Absolute $ Opportunity Analysis By Product Type, 2023 to 2033

6. Global MarketAnalysis 2018 to 2022 and Forecast 2023 to 2033, By Application

    6.1. Introduction / Key Findings

    6.2. Historical Market Size Value (US$ Million) & Volume (MT) Analysis By Application, 2018 to 2022

    6.3. Current and Future Market Size Value (US$ Million) & Volume (MT) Analysis and Forecast By Application, 2023 to 2033

        6.3.1. Commercial Kitchen

        6.3.2. Household kitchen

        6.3.3. others

    6.4. Y-o-Y Growth Trend Analysis By Application, 2018 to 2022

    6.5. Absolute $ Opportunity Analysis By Application, 2023 to 2033

7. Global MarketAnalysis 2018 to 2022 and Forecast 2023 to 2033, By Region

    7.1. Introduction

    7.2. Historical Market Size Value (US$ Million) & Volume (MT) Analysis By Region, 2018 to 2022

    7.3. Current Market Size Value (US$ Million) & Volume (MT) Analysis and Forecast By Region, 2023 to 2033

        7.3.1. North America

        7.3.2. Latin America

        7.3.3. Europe

        7.3.4. East Asia

        7.3.5. South Asia

        7.3.6. Oceania

        7.3.7. Middle East and Africa (MEA)

    7.4. Market Attractiveness Analysis By Region

8. North America MarketAnalysis 2018 to 2022 and Forecast 2023 to 2033, By Country

    8.1. Historical Market Size Value (US$ Million) & Volume (MT) Trend Analysis By Market Taxonomy, 2018 to 2022

    8.2. Market Size Value (US$ Million) & Volume (MT) Forecast By Market Taxonomy, 2023 to 2033

        8.2.1. By Country

            8.2.1.1. United States of America

            8.2.1.2. Canada

        8.2.2. By Product Type

        8.2.3. By Application

    8.3. Market Attractiveness Analysis

        8.3.1. By Country

        8.3.2. By Product Type

        8.3.3. By Application

    8.4. Key Takeaways

9. Latin America MarketAnalysis 2018 to 2022 and Forecast 2023 to 2033, By Country

    9.1. Historical Market Size Value (US$ Million) & Volume (MT) Trend Analysis By Market Taxonomy, 2018 to 2022

    9.2. Market Size Value (US$ Million) & Volume (MT) Forecast By Market Taxonomy, 2023 to 2033

        9.2.1. By Country

            9.2.1.1. Brazil

            9.2.1.2. Mexico

            9.2.1.3. Argentina

            9.2.1.4. Chile

            9.2.1.5. Peru

            9.2.1.6. Rest of Latin America

        9.2.2. By Product Type

        9.2.3. By Application

    9.3. Market Attractiveness Analysis

        9.3.1. By Country

        9.3.2. By Product Type

        9.3.3. By Application

    9.4. Key Takeaways

10. Europe Market Analysis 2018 to 2022 and Forecast 2023 to 2033, By Country

    10.1. Historical Market Size Value (US$ Million) & Volume (MT) Trend Analysis By Market Taxonomy, 2018 to 2022

    10.2. Market Size Value (US$ Million) & Volume (MT) Forecast By Market Taxonomy, 2023 to 2033

        10.2.1. By Country

            10.2.1.1. Germany

            10.2.1.2. Italy

            10.2.1.3. France

            10.2.1.4. United Kingdom

            10.2.1.5. Spain

            10.2.1.6. Russia

            10.2.1.7. BENELUX

            10.2.1.8. Poland

            10.2.1.9. Nordic Countries

            10.2.1.10. Rest of Europe

        10.2.2. By Product Type

        10.2.3. By Application

    10.3. Market Attractiveness Analysis

        10.3.1. By Country

        10.3.2. By Product Type

        10.3.3. By Application

    10.4. Key Takeaways

11. East Asia Market Analysis 2018 to 2022 and Forecast 2023 to 2033, By Country

    11.1. Historical Market Size Value (US$ Million) & Volume (MT) Trend Analysis By Market Taxonomy, 2018 to 2022

    11.2. Market Size Value (US$ Million) & Volume (MT) Forecast By Market Taxonomy, 2023 to 2033

        11.2.1. By Country

            11.2.1.1. China

            11.2.1.2. Japan

            11.2.1.3. South Korea

        11.2.2. By Product Type

        11.2.3. By Application

    11.3. Market Attractiveness Analysis

        11.3.1. By Country

        11.3.2. By Product Type

        11.3.3. By Application

    11.4. Key Takeaways

12. South Asia Market Analysis 2018 to 2022 and Forecast 2023 to 2033, By Country

    12.1. Historical Market Size Value (US$ Million) & Volume (MT) Trend Analysis By Market Taxonomy, 2018 to 2022

    12.2. Market Size Value (US$ Million) & Volume (MT) Forecast By Market Taxonomy, 2023 to 2033

        12.2.1. By Country

            12.2.1.1. India

            12.2.1.2. Thailand

            12.2.1.3. Malaysia

            12.2.1.4. Indonesia

            12.2.1.5. Singapore

            12.2.1.6. Rest of South Asia

        12.2.2. By Product Type

        12.2.3. By Application

    12.3. Market Attractiveness Analysis

        12.3.1. By Country

        12.3.2. By Product Type

        12.3.3. By Application

    12.4. Key Takeaways

13. Oceania Market Analysis 2018 to 2022 and Forecast 2023 to 2033, By Country

    13.1. Historical Market Size Value (US$ Million) & Volume (MT) Trend Analysis By Market Taxonomy, 2018 to 2022

    13.2. Market Size Value (US$ Million) & Volume (MT) Forecast By Market Taxonomy, 2023 to 2033

        13.2.1. By Country

            13.2.1.1. Australia

            13.2.1.2. New Zealand

        13.2.2. By Product Type

        13.2.3. By Application

    13.3. Market Attractiveness Analysis

        13.3.1. By Country

        13.3.2. By Product Type

        13.3.3. By Application

    13.4. Key Takeaways

14. MEA Market Analysis 2018 to 2022 and Forecast 2023 to 2033, By Country

    14.1. Historical Market Size Value (US$ Million) & Volume (MT) Trend Analysis By Market Taxonomy, 2018 to 2022

    14.2. Market Size Value (US$ Million) & Volume (MT) Forecast By Market Taxonomy, 2023 to 2033

        14.2.1. By Country

            14.2.1.1. GCC Countries

            14.2.1.2. South Africa

            14.2.1.3. Central Africa

            14.2.1.4. North Africa

        14.2.2. By Product Type

        14.2.3. By Application

    14.3. Market Attractiveness Analysis

        14.3.1. By Country

        14.3.2. By Product Type

        14.3.3. By Application

    14.4. Key Takeaways

15. Key Countries Market Analysis

    15.1. United States of America

        15.1.1. Pricing Analysis

        15.1.2. Market Share Analysis, 2022

            15.1.2.1. By Product Type

            15.1.2.2. By Application

    15.2. Canada

        15.2.1. Pricing Analysis

        15.2.2. Market Share Analysis, 2022

            15.2.2.1. By Product Type

            15.2.2.2. By Application

    15.3. Brazil

        15.3.1. Pricing Analysis

        15.3.2. Market Share Analysis, 2022

            15.3.2.1. By Product Type

            15.3.2.2. By Application

    15.4. Mexico

        15.4.1. Pricing Analysis

        15.4.2. Market Share Analysis, 2022

            15.4.2.1. By Product Type

            15.4.2.2. By Application

    15.5. Argentina

        15.5.1. Pricing Analysis

        15.5.2. Market Share Analysis, 2022

            15.5.2.1. By Product Type

            15.5.2.2. By Application

    15.6. Chile

        15.6.1. Pricing Analysis

        15.6.2. Market Share Analysis, 2022

            15.6.2.1. By Product Type

            15.6.2.2. By Application

    15.7. Peru

        15.7.1. Pricing Analysis

        15.7.2. Market Share Analysis, 2022

            15.7.2.1. By Product Type

            15.7.2.2. By Application

    15.8. Germany

        15.8.1. Pricing Analysis

        15.8.2. Market Share Analysis, 2022

            15.8.2.1. By Product Type

            15.8.2.2. By Application

    15.9. Italy

        15.9.1. Pricing Analysis

        15.9.2. Market Share Analysis, 2022

            15.9.2.1. By Product Type

            15.9.2.2. By Application

    15.10. France

        15.10.1. Pricing Analysis

        15.10.2. Market Share Analysis, 2022

            15.10.2.1. By Product Type

            15.10.2.2. By Application

    15.11. Spain

        15.11.1. Pricing Analysis

        15.11.2. Market Share Analysis, 2022

            15.11.2.1. By Product Type

            15.11.2.2. By Application

    15.12. United Kingdom

        15.12.1. Pricing Analysis

        15.12.2. Market Share Analysis, 2022

            15.12.2.1. By Product Type

            15.12.2.2. By Application

    15.13. Russia

        15.13.1. Pricing Analysis

        15.13.2. Market Share Analysis, 2022

            15.13.2.1. By Product Type

            15.13.2.2. By Application

    15.14. Poland

        15.14.1. Pricing Analysis

        15.14.2. Market Share Analysis, 2022

            15.14.2.1. By Product Type

            15.14.2.2. By Application

    15.15. BENELUX

        15.15.1. Pricing Analysis

        15.15.2. Market Share Analysis, 2022

            15.15.2.1. By Product Type

            15.15.2.2. By Application

    15.16. Nordic Countries

        15.16.1. Pricing Analysis

        15.16.2. Market Share Analysis, 2022

            15.16.2.1. By Product Type

            15.16.2.2. By Application

    15.17. China

        15.17.1. Pricing Analysis

        15.17.2. Market Share Analysis, 2022

            15.17.2.1. By Product Type

            15.17.2.2. By Application

    15.18. Japan

        15.18.1. Pricing Analysis

        15.18.2. Market Share Analysis, 2022

            15.18.2.1. By Product Type

            15.18.2.2. By Application

    15.19. South Korea

        15.19.1. Pricing Analysis

        15.19.2. Market Share Analysis, 2022

            15.19.2.1. By Product Type

            15.19.2.2. By Application

    15.20. India

        15.20.1. Pricing Analysis

        15.20.2. Market Share Analysis, 2022

            15.20.2.1. By Product Type

            15.20.2.2. By Application

    15.21. Thailand

        15.21.1. Pricing Analysis

        15.21.2. Market Share Analysis, 2022

            15.21.2.1. By Product Type

            15.21.2.2. By Application

    15.22. Indonesia

        15.22.1. Pricing Analysis

        15.22.2. Market Share Analysis, 2022

            15.22.2.1. By Product Type

            15.22.2.2. By Application

    15.23. Malaysia

        15.23.1. Pricing Analysis

        15.23.2. Market Share Analysis, 2022

            15.23.2.1. By Product Type

            15.23.2.2. By Application

    15.24. Singapore

        15.24.1. Pricing Analysis

        15.24.2. Market Share Analysis, 2022

            15.24.2.1. By Product Type

            15.24.2.2. By Application

    15.25. Australia

        15.25.1. Pricing Analysis

        15.25.2. Market Share Analysis, 2022

            15.25.2.1. By Product Type

            15.25.2.2. By Application

    15.26. New Zealand

        15.26.1. Pricing Analysis

        15.26.2. Market Share Analysis, 2022

            15.26.2.1. By Product Type

            15.26.2.2. By Application

    15.27. GCC Countries

        15.27.1. Pricing Analysis

        15.27.2. Market Share Analysis, 2022

            15.27.2.1. By Product Type

            15.27.2.2. By Application

    15.28. South Africa

        15.28.1. Pricing Analysis

        15.28.2. Market Share Analysis, 2022

            15.28.2.1. By Product Type

            15.28.2.2. By Application

    15.29. North Africa

        15.29.1. Pricing Analysis

        15.29.2. Market Share Analysis, 2022

            15.29.2.1. By Product Type

            15.29.2.2. By Application

    15.30. Central Africa

        15.30.1. Pricing Analysis

        15.30.2. Market Share Analysis, 2022

            15.30.2.1. By Product Type

            15.30.2.2. By Application

16. Market Structure Analysis

    16.1. Competition Dashboard

    16.2. Competition Benchmarking

    16.3. Market Share Analysis of Top Players

        16.3.1. By Regional

        16.3.2. By Product Type

        16.3.3. By Application

17. Competition Analysis

    17.1. Competition Deep Dive

        17.1.1. Adamark air knife system

            17.1.1.1. Overview

            17.1.1.2. Product Portfolio

            17.1.1.3. Profitability by Market Segments (Product/Age /Sales Channel/Region)

            17.1.1.4. Sales Footprint

            17.1.1.5. Strategy Overview

                17.1.1.5.1. Marketing Strategy

                17.1.1.5.2. Product Strategy

                17.1.1.5.3. Channel Strategy

        17.1.2. Agrovin

            17.1.2.1. Overview

            17.1.2.2. Product Portfolio

            17.1.2.3. Profitability by Market Segments (Product/Age /Sales Channel/Region)

            17.1.2.4. Sales Footprint

            17.1.2.5. Strategy Overview

                17.1.2.5.1. Marketing Strategy

                17.1.2.5.2. Product Strategy

                17.1.2.5.3. Channel Strategy

        17.1.3. Criveller group

            17.1.3.1. Overview

            17.1.3.2. Product Portfolio

            17.1.3.3. Profitability by Market Segments (Product/Age /Sales Channel/Region)

            17.1.3.4. Sales Footprint

            17.1.3.5. Strategy Overview

                17.1.3.5.1. Marketing Strategy

                17.1.3.5.2. Product Strategy

                17.1.3.5.3. Channel Strategy

        17.1.4. DT pacific LTD.

            17.1.4.1. Overview

            17.1.4.2. Product Portfolio

            17.1.4.3. Profitability by Market Segments (Product/Age /Sales Channel/Region)

            17.1.4.4. Sales Footprint

            17.1.4.5. Strategy Overview

                17.1.4.5.1. Marketing Strategy

                17.1.4.5.2. Product Strategy

                17.1.4.5.3. Channel Strategy

        17.1.5. G.W.kentinc.

            17.1.5.1. Overview

            17.1.5.2. Product Portfolio

            17.1.5.3. Profitability by Market Segments (Product/Age /Sales Channel/Region)

            17.1.5.4. Sales Footprint

            17.1.5.5. Strategy Overview

                17.1.5.5.1. Marketing Strategy

                17.1.5.5.2. Product Strategy

                17.1.5.5.3. Channel Strategy

        17.1.6. LoeMueller Company Inc

            17.1.6.1. Overview

            17.1.6.2. Product Portfolio

            17.1.6.3. Profitability by Market Segments (Product/Age /Sales Channel/Region)

            17.1.6.4. Sales Footprint

            17.1.6.5. Strategy Overview

                17.1.6.5.1. Marketing Strategy

                17.1.6.5.2. Product Strategy

                17.1.6.5.3. Channel Strategy

        17.1.7. Grapeworksptyltd

            17.1.7.1. Overview

            17.1.7.2. Product Portfolio

            17.1.7.3. Profitability by Market Segments (Product/Age /Sales Channel/Region)

            17.1.7.4. Sales Footprint

            17.1.7.5. Strategy Overview

                17.1.7.5.1. Marketing Strategy

                17.1.7.5.2. Product Strategy

                17.1.7.5.3. Channel Strategy

        17.1.8. Vitikit Ltd

            17.1.8.1. Overview

            17.1.8.2. Product Portfolio

            17.1.8.3. Profitability by Market Segments (Product/Age /Sales Channel/Region)

            17.1.8.4. Sales Footprint

            17.1.8.5. Strategy Overview

                17.1.8.5.1. Marketing Strategy

                17.1.8.5.2. Product Strategy

                17.1.8.5.3. Channel Strategy

18. Assumptions & Acronyms Used

19. Research Methodology

Don't pay for what you don't need

Customize your report by selecting specific countries or regions and save 30%!

List of Tables

Table 1: Global Market Value (US$ Million) Forecast by Region, 2018 to 2033

Table 2: Global Market Volume (MT) Forecast by Region, 2018 to 2033

Table 3: Global Market Value (US$ Million) Forecast by Product Type, 2018 to 2033

Table 4: Global Market Volume (MT) Forecast by Product Type, 2018 to 2033

Table 5: Global Market Value (US$ Million) Forecast by Application, 2018 to 2033

Table 6: Global Market Volume (MT) Forecast by Application, 2018 to 2033

Table 7: North America Market Value (US$ Million) Forecast by Country, 2018 to 2033

Table 8: North America Market Volume (MT) Forecast by Country, 2018 to 2033

Table 9: North America Market Value (US$ Million) Forecast by Product Type, 2018 to 2033

Table 10: North America Market Volume (MT) Forecast by Product Type, 2018 to 2033

Table 11: North America Market Value (US$ Million) Forecast by Application, 2018 to 2033

Table 12: North America Market Volume (MT) Forecast by Application, 2018 to 2033

Table 13: Latin America Market Value (US$ Million) Forecast by Country, 2018 to 2033

Table 14: Latin America Market Volume (MT) Forecast by Country, 2018 to 2033

Table 15: Latin America Market Value (US$ Million) Forecast by Product Type, 2018 to 2033

Table 16: Latin America Market Volume (MT) Forecast by Product Type, 2018 to 2033

Table 17: Latin America Market Value (US$ Million) Forecast by Application, 2018 to 2033

Table 18: Latin America Market Volume (MT) Forecast by Application, 2018 to 2033

Table 19: Europe Market Value (US$ Million) Forecast by Country, 2018 to 2033

Table 20: Europe Market Volume (MT) Forecast by Country, 2018 to 2033

Table 21: Europe Market Value (US$ Million) Forecast by Product Type, 2018 to 2033

Table 22: Europe Market Volume (MT) Forecast by Product Type, 2018 to 2033

Table 23: Europe Market Value (US$ Million) Forecast by Application, 2018 to 2033

Table 24: Europe Market Volume (MT) Forecast by Application, 2018 to 2033

Table 25: East Asia Market Value (US$ Million) Forecast by Country, 2018 to 2033

Table 26: East Asia Market Volume (MT) Forecast by Country, 2018 to 2033

Table 27: East Asia Market Value (US$ Million) Forecast by Product Type, 2018 to 2033

Table 28: East Asia Market Volume (MT) Forecast by Product Type, 2018 to 2033

Table 29: East Asia Market Value (US$ Million) Forecast by Application, 2018 to 2033

Table 30: East Asia Market Volume (MT) Forecast by Application, 2018 to 2033

Table 31: South Asia Market Value (US$ Million) Forecast by Country, 2018 to 2033

Table 32: South Asia Market Volume (MT) Forecast by Country, 2018 to 2033

Table 33: South Asia Market Value (US$ Million) Forecast by Product Type, 2018 to 2033

Table 34: South Asia Market Volume (MT) Forecast by Product Type, 2018 to 2033

Table 35: South Asia Market Value (US$ Million) Forecast by Application, 2018 to 2033

Table 36: South Asia Market Volume (MT) Forecast by Application, 2018 to 2033

Table 37: Oceania Market Value (US$ Million) Forecast by Country, 2018 to 2033

Table 38: Oceania Market Volume (MT) Forecast by Country, 2018 to 2033

Table 39: Oceania Market Value (US$ Million) Forecast by Product Type, 2018 to 2033

Table 40: Oceania Market Volume (MT) Forecast by Product Type, 2018 to 2033

Table 41: Oceania Market Value (US$ Million) Forecast by Application, 2018 to 2033

Table 42: Oceania Market Volume (MT) Forecast by Application, 2018 to 2033

Table 43: MEA Market Value (US$ Million) Forecast by Country, 2018 to 2033

Table 44: MEA Market Volume (MT) Forecast by Country, 2018 to 2033

Table 45: MEA Market Value (US$ Million) Forecast by Product Type, 2018 to 2033

Table 46: MEA Market Volume (MT) Forecast by Product Type, 2018 to 2033

Table 47: MEA Market Value (US$ Million) Forecast by Application, 2018 to 2033

Table 48: MEA Market Volume (MT) Forecast by Application, 2018 to 2033
Nandini Roy Choudhury

Principal Consultant

Talk to Analyst

Find your sweet spots for generating winning opportunities in this market.

List of Charts

Figure 1: Global Market Value (US$ Million) by Product Type, 2023 to 2033

Figure 2: Global Market Value (US$ Million) by Application, 2023 to 2033

Figure 3: Global Market Value (US$ Million) by Region, 2023 to 2033

Figure 4: Global Market Value (US$ Million) Analysis by Region, 2018 to 2033

Figure 5: Global Market Volume (MT) Analysis by Region, 2018 to 2033

Figure 6: Global Market Value Share (%) and BPS Analysis by Region, 2023 to 2033

Figure 7: Global Market Y-o-Y Growth (%) Projections by Region, 2023 to 2033

Figure 8: Global Market Value (US$ Million) Analysis by Product Type, 2018 to 2033

Figure 9: Global Market Volume (MT) Analysis by Product Type, 2018 to 2033

Figure 10: Global Market Value Share (%) and BPS Analysis by Product Type, 2023 to 2033

Figure 11: Global Market Y-o-Y Growth (%) Projections by Product Type, 2023 to 2033

Figure 12: Global Market Value (US$ Million) Analysis by Application, 2018 to 2033

Figure 13: Global Market Volume (MT) Analysis by Application, 2018 to 2033

Figure 14: Global Market Value Share (%) and BPS Analysis by Application, 2023 to 2033

Figure 15: Global Market Y-o-Y Growth (%) Projections by Application, 2023 to 2033

Figure 16: Global Market Attractiveness by Product Type, 2023 to 2033

Figure 17: Global Market Attractiveness by Application, 2023 to 2033

Figure 18: Global Market Attractiveness by Region, 2023 to 2033

Figure 19: North America Market Value (US$ Million) by Product Type, 2023 to 2033

Figure 20: North America Market Value (US$ Million) by Application, 2023 to 2033

Figure 21: North America Market Value (US$ Million) by Country, 2023 to 2033

Figure 22: North America Market Value (US$ Million) Analysis by Country, 2018 to 2033

Figure 23: North America Market Volume (MT) Analysis by Country, 2018 to 2033

Figure 24: North America Market Value Share (%) and BPS Analysis by Country, 2023 to 2033

Figure 25: North America Market Y-o-Y Growth (%) Projections by Country, 2023 to 2033

Figure 26: North America Market Value (US$ Million) Analysis by Product Type, 2018 to 2033

Figure 27: North America Market Volume (MT) Analysis by Product Type, 2018 to 2033

Figure 28: North America Market Value Share (%) and BPS Analysis by Product Type, 2023 to 2033

Figure 29: North America Market Y-o-Y Growth (%) Projections by Product Type, 2023 to 2033

Figure 30: North America Market Value (US$ Million) Analysis by Application, 2018 to 2033

Figure 31: North America Market Volume (MT) Analysis by Application, 2018 to 2033

Figure 32: North America Market Value Share (%) and BPS Analysis by Application, 2023 to 2033

Figure 33: North America Market Y-o-Y Growth (%) Projections by Application, 2023 to 2033

Figure 34: North America Market Attractiveness by Product Type, 2023 to 2033

Figure 35: North America Market Attractiveness by Application, 2023 to 2033

Figure 36: North America Market Attractiveness by Country, 2023 to 2033

Figure 37: Latin America Market Value (US$ Million) by Product Type, 2023 to 2033

Figure 38: Latin America Market Value (US$ Million) by Application, 2023 to 2033

Figure 39: Latin America Market Value (US$ Million) by Country, 2023 to 2033

Figure 40: Latin America Market Value (US$ Million) Analysis by Country, 2018 to 2033

Figure 41: Latin America Market Volume (MT) Analysis by Country, 2018 to 2033

Figure 42: Latin America Market Value Share (%) and BPS Analysis by Country, 2023 to 2033

Figure 43: Latin America Market Y-o-Y Growth (%) Projections by Country, 2023 to 2033

Figure 44: Latin America Market Value (US$ Million) Analysis by Product Type, 2018 to 2033

Figure 45: Latin America Market Volume (MT) Analysis by Product Type, 2018 to 2033

Figure 46: Latin America Market Value Share (%) and BPS Analysis by Product Type, 2023 to 2033

Figure 47: Latin America Market Y-o-Y Growth (%) Projections by Product Type, 2023 to 2033

Figure 48: Latin America Market Value (US$ Million) Analysis by Application, 2018 to 2033

Figure 49: Latin America Market Volume (MT) Analysis by Application, 2018 to 2033

Figure 50: Latin America Market Value Share (%) and BPS Analysis by Application, 2023 to 2033

Figure 51: Latin America Market Y-o-Y Growth (%) Projections by Application, 2023 to 2033

Figure 52: Latin America Market Attractiveness by Product Type, 2023 to 2033

Figure 53: Latin America Market Attractiveness by Application, 2023 to 2033

Figure 54: Latin America Market Attractiveness by Country, 2023 to 2033

Figure 55: Europe Market Value (US$ Million) by Product Type, 2023 to 2033

Figure 56: Europe Market Value (US$ Million) by Application, 2023 to 2033

Figure 57: Europe Market Value (US$ Million) by Country, 2023 to 2033

Figure 58: Europe Market Value (US$ Million) Analysis by Country, 2018 to 2033

Figure 59: Europe Market Volume (MT) Analysis by Country, 2018 to 2033

Figure 60: Europe Market Value Share (%) and BPS Analysis by Country, 2023 to 2033

Figure 61: Europe Market Y-o-Y Growth (%) Projections by Country, 2023 to 2033

Figure 62: Europe Market Value (US$ Million) Analysis by Product Type, 2018 to 2033

Figure 63: Europe Market Volume (MT) Analysis by Product Type, 2018 to 2033

Figure 64: Europe Market Value Share (%) and BPS Analysis by Product Type, 2023 to 2033

Figure 65: Europe Market Y-o-Y Growth (%) Projections by Product Type, 2023 to 2033

Figure 66: Europe Market Value (US$ Million) Analysis by Application, 2018 to 2033

Figure 67: Europe Market Volume (MT) Analysis by Application, 2018 to 2033

Figure 68: Europe Market Value Share (%) and BPS Analysis by Application, 2023 to 2033

Figure 69: Europe Market Y-o-Y Growth (%) Projections by Application, 2023 to 2033

Figure 70: Europe Market Attractiveness by Product Type, 2023 to 2033

Figure 71: Europe Market Attractiveness by Application, 2023 to 2033

Figure 72: Europe Market Attractiveness by Country, 2023 to 2033

Figure 73: East Asia Market Value (US$ Million) by Product Type, 2023 to 2033

Figure 74: East Asia Market Value (US$ Million) by Application, 2023 to 2033

Figure 75: East Asia Market Value (US$ Million) by Country, 2023 to 2033

Figure 76: East Asia Market Value (US$ Million) Analysis by Country, 2018 to 2033

Figure 77: East Asia Market Volume (MT) Analysis by Country, 2018 to 2033

Figure 78: East Asia Market Value Share (%) and BPS Analysis by Country, 2023 to 2033

Figure 79: East Asia Market Y-o-Y Growth (%) Projections by Country, 2023 to 2033

Figure 80: East Asia Market Value (US$ Million) Analysis by Product Type, 2018 to 2033

Figure 81: East Asia Market Volume (MT) Analysis by Product Type, 2018 to 2033

Figure 82: East Asia Market Value Share (%) and BPS Analysis by Product Type, 2023 to 2033

Figure 83: East Asia Market Y-o-Y Growth (%) Projections by Product Type, 2023 to 2033

Figure 84: East Asia Market Value (US$ Million) Analysis by Application, 2018 to 2033

Figure 85: East Asia Market Volume (MT) Analysis by Application, 2018 to 2033

Figure 86: East Asia Market Value Share (%) and BPS Analysis by Application, 2023 to 2033

Figure 87: East Asia Market Y-o-Y Growth (%) Projections by Application, 2023 to 2033

Figure 88: East Asia Market Attractiveness by Product Type, 2023 to 2033

Figure 89: East Asia Market Attractiveness by Application, 2023 to 2033

Figure 90: East Asia Market Attractiveness by Country, 2023 to 2033

Figure 91: South Asia Market Value (US$ Million) by Product Type, 2023 to 2033

Figure 92: South Asia Market Value (US$ Million) by Application, 2023 to 2033

Figure 93: South Asia Market Value (US$ Million) by Country, 2023 to 2033

Figure 94: South Asia Market Value (US$ Million) Analysis by Country, 2018 to 2033

Figure 95: South Asia Market Volume (MT) Analysis by Country, 2018 to 2033

Figure 96: South Asia Market Value Share (%) and BPS Analysis by Country, 2023 to 2033

Figure 97: South Asia Market Y-o-Y Growth (%) Projections by Country, 2023 to 2033

Figure 98: South Asia Market Value (US$ Million) Analysis by Product Type, 2018 to 2033

Figure 99: South Asia Market Volume (MT) Analysis by Product Type, 2018 to 2033

Figure 100: South Asia Market Value Share (%) and BPS Analysis by Product Type, 2023 to 2033

Figure 101: South Asia Market Y-o-Y Growth (%) Projections by Product Type, 2023 to 2033

Figure 102: South Asia Market Value (US$ Million) Analysis by Application, 2018 to 2033

Figure 103: South Asia Market Volume (MT) Analysis by Application, 2018 to 2033

Figure 104: South Asia Market Value Share (%) and BPS Analysis by Application, 2023 to 2033

Figure 105: South Asia Market Y-o-Y Growth (%) Projections by Application, 2023 to 2033

Figure 106: South Asia Market Attractiveness by Product Type, 2023 to 2033

Figure 107: South Asia Market Attractiveness by Application, 2023 to 2033

Figure 108: South Asia Market Attractiveness by Country, 2023 to 2033

Figure 109: Oceania Market Value (US$ Million) by Product Type, 2023 to 2033

Figure 110: Oceania Market Value (US$ Million) by Application, 2023 to 2033

Figure 111: Oceania Market Value (US$ Million) by Country, 2023 to 2033

Figure 112: Oceania Market Value (US$ Million) Analysis by Country, 2018 to 2033

Figure 113: Oceania Market Volume (MT) Analysis by Country, 2018 to 2033

Figure 114: Oceania Market Value Share (%) and BPS Analysis by Country, 2023 to 2033

Figure 115: Oceania Market Y-o-Y Growth (%) Projections by Country, 2023 to 2033

Figure 116: Oceania Market Value (US$ Million) Analysis by Product Type, 2018 to 2033

Figure 117: Oceania Market Volume (MT) Analysis by Product Type, 2018 to 2033

Figure 118: Oceania Market Value Share (%) and BPS Analysis by Product Type, 2023 to 2033

Figure 119: Oceania Market Y-o-Y Growth (%) Projections by Product Type, 2023 to 2033

Figure 120: Oceania Market Value (US$ Million) Analysis by Application, 2018 to 2033

Figure 121: Oceania Market Volume (MT) Analysis by Application, 2018 to 2033

Figure 122: Oceania Market Value Share (%) and BPS Analysis by Application, 2023 to 2033

Figure 123: Oceania Market Y-o-Y Growth (%) Projections by Application, 2023 to 2033

Figure 124: Oceania Market Attractiveness by Product Type, 2023 to 2033

Figure 125: Oceania Market Attractiveness by Application, 2023 to 2033

Figure 126: Oceania Market Attractiveness by Country, 2023 to 2033

Figure 127: MEA Market Value (US$ Million) by Product Type, 2023 to 2033

Figure 128: MEA Market Value (US$ Million) by Application, 2023 to 2033

Figure 129: MEA Market Value (US$ Million) by Country, 2023 to 2033

Figure 130: MEA Market Value (US$ Million) Analysis by Country, 2018 to 2033

Figure 131: MEA Market Volume (MT) Analysis by Country, 2018 to 2033

Figure 132: MEA Market Value Share (%) and BPS Analysis by Country, 2023 to 2033

Figure 133: MEA Market Y-o-Y Growth (%) Projections by Country, 2023 to 2033

Figure 134: MEA Market Value (US$ Million) Analysis by Product Type, 2018 to 2033

Figure 135: MEA Market Volume (MT) Analysis by Product Type, 2018 to 2033

Figure 136: MEA Market Value Share (%) and BPS Analysis by Product Type, 2023 to 2033

Figure 137: MEA Market Y-o-Y Growth (%) Projections by Product Type, 2023 to 2033

Figure 138: MEA Market Value (US$ Million) Analysis by Application, 2018 to 2033

Figure 139: MEA Market Volume (MT) Analysis by Application, 2018 to 2033

Figure 140: MEA Market Value Share (%) and BPS Analysis by Application, 2023 to 2033

Figure 141: MEA Market Y-o-Y Growth (%) Projections by Application, 2023 to 2033

Figure 142: MEA Market Attractiveness by Product Type, 2023 to 2033

Figure 143: MEA Market Attractiveness by Application, 2023 to 2033

Figure 144: MEA Market Attractiveness by Country, 2023 to 2033

Explore Process Automation Insights

View Reports

Wine Fermentation Equipment Market