The wine barrel market is valued at USD 1.2 billion in 2025 and is projected to reach USD 2.1 billion by 2035, advancing at a CAGR of 5.8%. Growth is driven by rising global demand for premium and ultra-premium wines, increasing adoption of traditional barrel-aging techniques, and expanding vineyard development across both established and emerging wine-producing regions. Barrels remain essential for imparting flavor complexity, supporting controlled oxidation, and shaping tannin integration, qualities that stainless steel or alternative aging formats cannot replicate. Winemakers across Europe, North America, South America, and parts of Asia are increasing their investment in cooperage programs to enhance vintage consistency, strengthen sensory profiles, and support brand differentiation in competitive export-oriented markets.
Oak barrels, holding a dominant 68% share, remain the preferred material due to their superior flavor contribution, predictable aging performance, and established acceptance in red wine and white wine maturation. Wineries and vineyards, representing 74% of total demand, form the largest end-use segment as they rely heavily on multi-vintage barrel inventories and bespoke toast specifications to achieve target flavor structures. Regionally, Europe and North America remain the largest markets due to strong premium wine sectors, while China, Australia, and Chile drive faster growth through expanding vineyard acreage and rising premiumization trends. Competition remains traditional and moderately consolidated, led by renowned cooperages such as Tonnellerie François Frères, Seguin Moreau, Tonnellerie Radoux, Demptos, Nadalie, and World Cooperage, who strengthen market positioning through advanced toast profiling, traceable forest sourcing, extended wood seasoning, and customized barrel programs aligned with premium wine producers’ needs.
A major dynamic influencing market expansion is the growing preference for premium and ultra-premium wines. Consumers increasingly seek wines with distinct flavor profiles, refined mouthfeel, and structured aging potential, attributes strongly associated with barrel-aged products. Oak barrels remain essential in shaping these sensory characteristics by enabling micro-oxygenation and controlled extraction of wood-derived compounds. As premium wine consumption rises across the U.S., Europe, China, Australia, and South America, wineries are investing in higher volumes of quality barrels to support differentiated product lines and expanded cellar programs.
The expansion of global vineyard acreage and increasing new winery establishments also reinforce market growth. Regions such as Chile, Argentina, South Africa, New Zealand, and Eastern Europe are gaining international recognition for exports, leading to heightened demand for barrels in both fermentation and finishing stages. Micro-wineries, craft wine labels, and estate-driven production further contribute to rising consumption of small-format barrels, specialty toasts, and custom cooperage solutions tailored to varietal requirements.
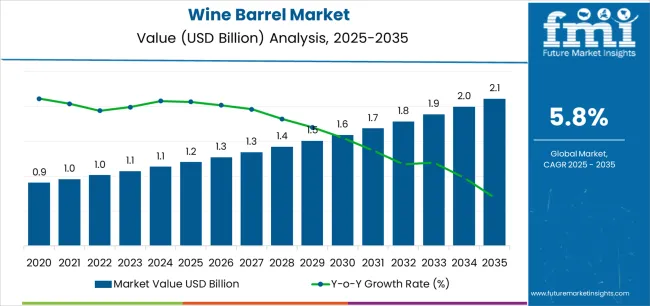
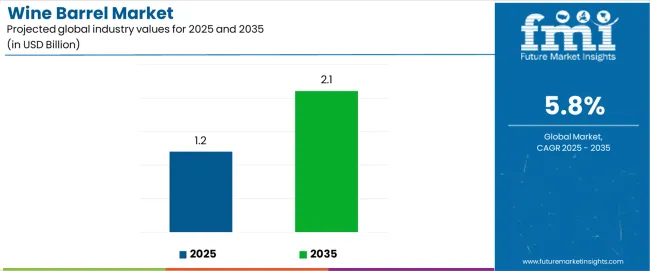
| Metric | Value |
|---|---|
| Estimated Value in (2025E) | USD 1.2 billion |
| Forecast Value in (2035F) | USD 2.1 billion |
| Forecast CAGR (2025 to 2035) | 5.8% |
Market expansion is being supported by the increasing global demand for premium wine categories and the corresponding need for aging vessels that can provide superior flavor integration, tannin management, and micro-oxygenation while enabling distinctive regional expression and varietal character development across various wine styles and production scales. Modern winemakers are increasingly focused on implementing barrel programs that can enhance wine complexity, support extended maturation requirements, and provide consistent quality outcomes throughout multi-vintage production cycles. Wine barrel's proven ability to deliver exceptional flavor contribution, enable controlled oxidation, and support brand differentiation make them essential tools for contemporary premium wine production and quality-driven winemaking operations.
The growing emphasis on wine quality elevation and consumer preference for complex flavor profiles is driving demand for barrels that can support extended aging requirements, improve wine structure, and enable distinctive taste characteristics. Winemakers' preference for cooperage that combines traditional craftsmanship with processing consistency and sourcing transparency is creating opportunities for innovative barrel implementations. The rising influence of new wine regions and boutique winery development is also contributing to increased demand for barrels that can provide flavor precision, vintage consistency, and stylistic expression capabilities.
The wine barrel market is poised for steady growth and transformation. As wineries across premium wine regions, emerging markets, boutique producers, and quality-focused estates seek aging vessels that deliver exceptional flavor contribution, structural enhancement, and production differentiation, wine barrels are gaining prominence not just as traditional cooperage but as strategic enablers of quality positioning and sensory profile optimization.
Rising wine consumption in Asia-Pacific and expanding premium wine production globally amplify demand, while cooperages are leveraging innovations in toast customization, wood sourcing protocols, and seasoning technologies.
Pathways like precision toast profiling, origin-specific oak selection, and application-specific barrel design promise strong margin uplift, especially in high-value segments. Geographic expansion and vertical integration will capture volume, particularly where local cooperage capabilities and supply chain proximity are critical. Quality standards around flavor contribution consistency, barrel lifespan optimization, wine safety requirements, and terroir expression give structural support.
The market is segmented by material type, capacity, toast level, end-use application, distribution channel, and region. By material type, the market is divided into oak barrels (French oak, American oak, European oak), chestnut barrels, and others. By capacity, it covers small barrels (below 200 liters), medium barrels (200-300 liters), and large barrels (above 300 liters). By toast level, the market is segmented into light toast, medium toast, and heavy toast. The end-use application includes wineries & vineyards, wine aging facilities, commercial wine producers, and craft wine operations. By distribution channel, the market includes direct sales, cooperage distributors, and wine supply specialists. Regionally, the market is divided into North America, Europe, East Asia, South Asia & Pacific, Latin America, and the Middle East & Africa.
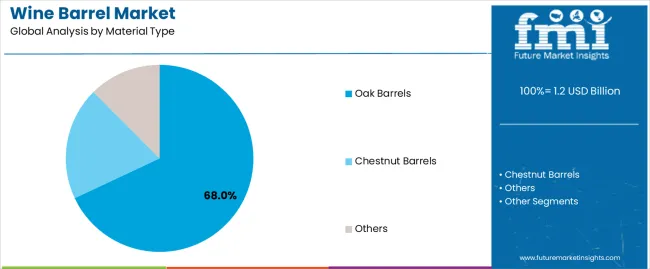
The oak barrels segment is projected to account for 68% of the wine barrel market in 2025, reaffirming its position as the leading material category. Winemakers increasingly utilize oak barrels for their superior flavor contribution including vanilla, spice, and toast characteristics, excellent tannin integration capabilities, and proven performance in applications ranging from premium red wine aging to white wine fermentation and maturation. Oak barrel technology's established reputation and consistent quality delivery directly address the winemaking requirements for reliable flavor development and controlled micro-oxygenation in high-value wine production environments.
This material segment forms the foundation of modern premium winemaking operations, as it represents the barrel type with the greatest tradition and established market demand across multiple wine styles and production philosophies. Winemaker investments in diversified oak sourcing and customized toast specifications continue to strengthen adoption among quality-focused wine producers. With wineries prioritizing flavor complexity and structural refinement, oak barrels align with both sensory development requirements and premium positioning objectives, making them the central component of comprehensive wine aging strategies.
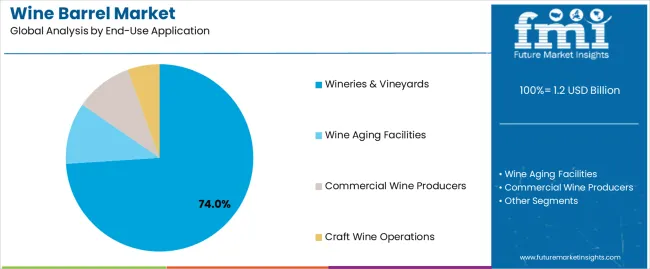
Wineries & vineyards applications are projected to represent 74% of wine barrel demand in 2025, underscoring their critical role as the primary industrial consumers of cooperage products for wine production, aging, and quality development across diverse wine categories and production scales. Winemakers prefer barrels for their exceptional flavor integration capabilities, controlled oxidation properties, and ability to enhance wine complexity while supporting extended maturation protocols. Positioned as essential production tools for modern wine quality programs, wine barrels offer both sensory enhancement advantages and vintage consistency benefits.
The segment is supported by continuous innovation in toast profiling technologies and the growing availability of specialized cooperage services that enable customized barrel programs with enhanced flavor precision and vintage-specific adjustments. Additionally, wineries are investing in barrel inventory management to support multi-vintage aging strategies and quality assurance. As premium wine segment demand becomes more prevalent and consumer expectations for wine complexity increase, wineries & vineyards applications will continue to dominate the end-use market while supporting advanced cooperage technology utilization and quality-driven production strategies.
The wine barrel market is advancing steadily due to increasing demand for premium and ultra-premium wine categories and growing adoption of traditional aging methods that provide superior flavor complexity, tannin integration, and structural development while enabling distinctive regional expression across diverse wine styles and production approaches. However, the market faces challenges, including oak supply constraints, extended seasoning requirements for quality cooperage, and the need for specialized craftsmanship and precision manufacturing capabilities. Innovation in toast customization and traceable sourcing continues to influence product development and market expansion patterns.
The growing adoption of computer-controlled toasting systems, infrared heat profiling, and customized char specifications is enabling cooperages to produce premium barrels with precise flavor contribution characteristics, enhanced aromatic complexity, and specialized sensory attributes tailored to specific wine styles. Advanced toast technologies provide improved flavor consistency while allowing more efficient production and predictable outcomes across various barrel formats and wood origins. Cooperages are increasingly recognizing the competitive advantages of sophisticated toast capabilities for product differentiation and premium market positioning.
Modern barrel producers are incorporating forest origin documentation, verified seasoning protocols, and quality assurance certifications to enhance product transparency, enable regulatory compliance, and deliver value-added solutions to quality-focused winemakers and premium wine brands. These capabilities improve consumer confidence while enabling new market segments, including certified organic wine production, biodynamic winemaking operations, and transparent supply chain initiatives. Advanced traceability integration also allows cooperages to support premium product positioning and quality storytelling beyond traditional barrel supply relationships.
| Country | CAGR (2025-2035) |
|---|---|
| France | 4.8% |
| USA | 6.2% |
| Italy | 5.1% |
| Australia | 6.75 |
| Spain | 5.3% |
| Chile | 7.2% |
| China | 8.1% |
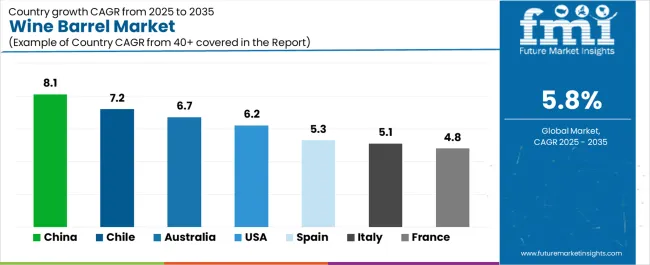
The wine barrel market is experiencing steady growth globally, with China leading at an 8.1% CAGR through 2035, driven by the expanding domestic wine industry, growing premium wine production, and significant investment in vineyard development infrastructure. Chile follows at 7.2%, supported by robust wine export growth, increasing quality wine production, and growing international market positioning. Australia shows growth at 6.7%, emphasizing premium wine development and boutique winery expansion. The USA records 6.2%, focusing on craft wine production and premium wine category growth. Spain demonstrates 5.3% growth, prioritizing traditional winemaking methods and denomination of origin expansion. Italy exhibits 5.1% growth, emphasizing quality wine production and regional denomination excellence. France shows 4.8% growth, supported by established premium wine heritage and traditional cooperage relationships.
The report covers an in-depth analysis of 40+ countries top-performing countries are highlighted below.
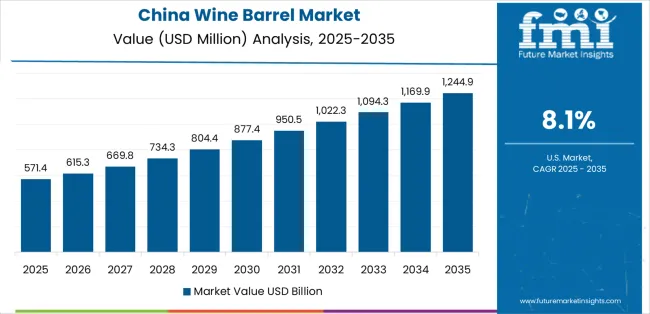
Revenue from wine barrels in China is projected to exhibit exceptional growth with a CAGR of 8.1% through 2035, driven by expanding domestic wine production capacity and rapidly growing premium wine segment supported by government initiatives promoting viticulture development. The country's strong position in emerging wine markets and increasing investment in quality winemaking infrastructure are creating substantial demand for traditional oak barrel solutions. Major wine producers and boutique wineries are establishing comprehensive barrel aging programs to serve both domestic premium markets and quality positioning strategies.
Revenue from wine barrels in Chile is expanding at a CAGR of 7.2%, supported by the country's established wine export sector, expanding premium wine production, and increasing adoption of traditional aging methods. The country's favorable climate conditions and growing international wine market recognition are driving requirements for sophisticated cooperage capabilities. International cooperages and domestic barrel suppliers are establishing extensive distribution capabilities to address the growing demand for quality barrel products.
Revenue from wine barrels in Australia is expanding at a CAGR of 6.7%, supported by the country's diverse wine regions, strong emphasis on boutique wine production, and robust demand for quality cooperage in premium and ultra-premium wine categories. The nation's established wine industry and quality-focused production philosophy are driving sophisticated barrel program implementation throughout wine-producing regions. Leading wineries and cooperage suppliers are investing extensively in customized barrel specifications and origin-specific oak sourcing to serve both domestic and export markets.
Revenue from wine barrels in the USA is growing at a CAGR of 6.2%, driven by the country's vibrant craft wine movement, expanding premium wine production, and growing investment in boutique winery development. The USA's diverse wine regions and commitment to quality winemaking are supporting demand for varied barrel solutions across multiple production scales. Cooperages are establishing comprehensive supply capabilities to serve the large domestic market and diverse winemaker requirements.
Revenue from wine barrels in Spain is expanding at a CAGR of 5.3%, supported by the country's rich winemaking heritage, established denomination of origin systems, and strategic focus on traditional aging protocols. Spain's extensive barrel aging traditions and quality wine regulations are driving demand for cooperage in Rioja, Ribera del Duero, and other premium wine regions. Cooperages are investing in comprehensive quality management capabilities to serve both domestic wine producers and traditional aging requirement specifications.
Revenue from wine barrels in Italy is growing at a CAGR of 5.1%, driven by the country's established quality wine sectors, emphasis on regional denomination systems, and strong position in premium wine categories. Italy's winemaking traditions and commitment to quality cooperage are supporting investment in advanced barrel programs throughout major production regions. Industry leaders are establishing comprehensive barrel management systems to serve denomination requirements and premium wine positioning.
Revenue from wine barrels in France is expanding at a CAGR of 4.8%, supported by the country's world-leading cooperage industry, established premium wine production, and strategic position in global quality wine supply chains. France's prestigious forest resources and integrated cooperage ecosystem are driving demand for exceptional barrels in Bordeaux, Burgundy, Rhône Valley, and other renowned wine regions. Leading cooperages are investing in specialized capabilities to serve the stringent requirements of premium wine châteaux and quality-focused wine estates.
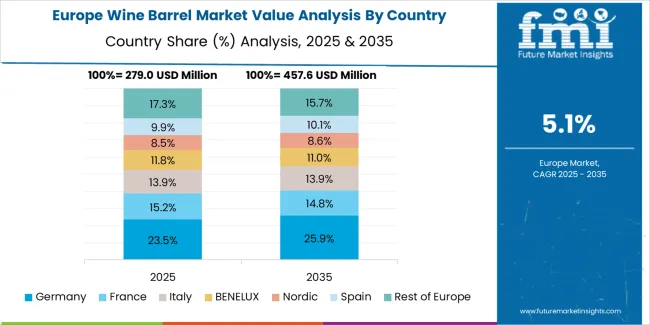
The wine barrel market in Europe is projected to grow from USD 520 million in 2025 to USD 950 million by 2035, registering a CAGR of 6.2% over the forecast period. France is expected to maintain its leadership position with a 35.0% market share in 2025, declining slightly to 34.0% by 2035, supported by its world-renowned cooperage industry, prestigious oak forests, and comprehensive premium wine sector serving diverse barrel applications across Europe.
Italy follows with a 28.0% share in 2025, projected to reach 28.5% by 2035, driven by robust demand for barrels in traditional wine aging, denomination production protocols, and quality wine development, combined with established cooperage capabilities and large-format barrel expertise. Spain holds a 20.0% share in 2025, expected to reach 20.5% by 2035, supported by strong traditional wine production and extensive barrel aging requirements. Germany commands a 7.0% share in 2025, projected to reach 7.2% by 2035, while Portugal accounts for 4.5% in 2025, expected to reach 4.6% by 2035. Austria maintains a 2.0% share in 2025, growing to 2.1% by 2035. The Rest of Europe region, including Eastern European wine countries, Greece, Switzerland, and emerging wine regions, is anticipated to maintain its collective share from 3.5% to 3.1% by 2035, attributed to growing wine production in Eastern Europe and expanding quality wine programs in emerging markets implementing barrel aging initiatives.
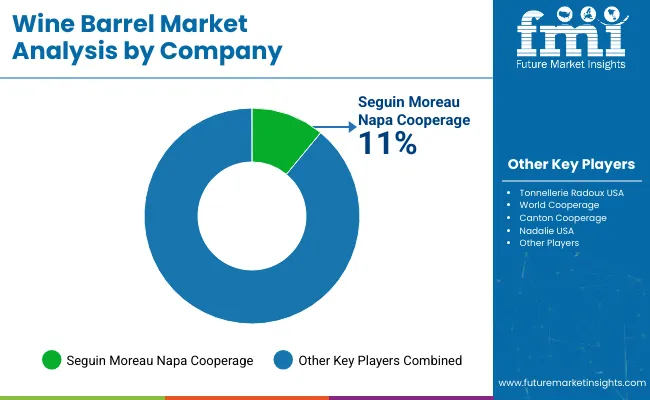
The wine barrel market is characterized by competition among traditional cooperages, specialized barrel manufacturers, and integrated wood products suppliers. Companies are investing in forest sourcing relationships, toast profiling technology, seasoning facility development, and comprehensive barrel portfolios to deliver consistent, high-performance, and application-specific cooperage solutions. Innovation in customized toast programs, traceable wood sourcing, and quality assurance systems is central to strengthening market position and competitive advantage.
Tonnellerie François Frères leads the market with a strong market share, offering premium French oak barrels with a focus on Burgundy and Bordeaux wine styles. Seguin Moreau provides comprehensive cooperage capabilities with emphasis on custom toast profiling and global distribution. Tonnellerie Radoux delivers innovative barrel products with a focus on precision manufacturing and consistent quality. Demptos specializes in American oak and French oak barrels for diverse wine applications. Nadalie focuses on traditional cooperage methods and premium oak sourcing. World Cooperage offers versatile barrel solutions with emphasis on value positioning and production efficiency.
| Items | Values |
|---|---|
| Quantitative Units (2025) | USD 1.2 billion |
| Material Type | Oak Barrels (French Oak, American Oak, European Oak), Chestnut Barrels, Others |
| Capacity | Small Barrels (Below 200 Liters), Medium Barrels (200-300 Liters), Large Barrels (Above 300 Liters) |
| Toast Level | Light Toast, Medium Toast, Heavy Toast |
| End-Use Application | Wineries & Vineyards, Wine Aging Facilities, Commercial Wine Producers, Craft Wine Operations |
| Distribution Channel | Direct Sales, Cooperage Distributors, Wine Supply Specialists |
| Regions Covered | North America, Europe, East Asia, South Asia & Pacific, Latin America, Middle East & Africa |
| Countries Covered | United States, Canada, France, Italy, Spain, Germany, Portugal, China, Australia, Chile, Argentina and 40+ countries |
| Key Companies Profiled | Tonnellerie François Frères, Seguin Moreau, Tonnellerie Radoux, Demptos, Nadalie, and World Cooperage |
| Additional Attributes | Dollar sales by material type and end-use application, regional demand trends, competitive landscape, technological advancements in toast profiling, wood seasoning protocols, traceability systems, and supply chain integration |
The global wine barrel market is estimated to be valued at USD 1.2 billion in 2025.
The market size for the wine barrel market is projected to reach USD 2.1 billion by 2035.
The wine barrel market is expected to grow at a 5.8% CAGR between 2025 and 2035.
The key product types in wine barrel market are oak barrels , chestnut barrels and others.
In terms of end-use application, wineries & vineyards segment to command 74.0% share in the wine barrel market in 2025.


Our Research Products

The "Full Research Suite" delivers actionable market intel, deep dives on markets or technologies, so clients act faster, cut risk, and unlock growth.

The Leaderboard benchmarks and ranks top vendors, classifying them as Established Leaders, Leading Challengers, or Disruptors & Challengers.

Locates where complements amplify value and substitutes erode it, forecasting net impact by horizon

We deliver granular, decision-grade intel: market sizing, 5-year forecasts, pricing, adoption, usage, revenue, and operational KPIs—plus competitor tracking, regulation, and value chains—across 60 countries broadly.

Spot the shifts before they hit your P&L. We track inflection points, adoption curves, pricing moves, and ecosystem plays to show where demand is heading, why it is changing, and what to do next across high-growth markets and disruptive tech

Real-time reads of user behavior. We track shifting priorities, perceptions of today’s and next-gen services, and provider experience, then pace how fast tech moves from trial to adoption, blending buyer, consumer, and channel inputs with social signals (#WhySwitch, #UX).

Partner with our analyst team to build a custom report designed around your business priorities. From analysing market trends to assessing competitors or crafting bespoke datasets, we tailor insights to your needs.
Supplier Intelligence
Discovery & Profiling
Capacity & Footprint
Performance & Risk
Compliance & Governance
Commercial Readiness
Who Supplies Whom
Scorecards & Shortlists
Playbooks & Docs
Category Intelligence
Definition & Scope
Demand & Use Cases
Cost Drivers
Market Structure
Supply Chain Map
Trade & Policy
Operating Norms
Deliverables
Buyer Intelligence
Account Basics
Spend & Scope
Procurement Model
Vendor Requirements
Terms & Policies
Entry Strategy
Pain Points & Triggers
Outputs
Pricing Analysis
Benchmarks
Trends
Should-Cost
Indexation
Landed Cost
Commercial Terms
Deliverables
Brand Analysis
Positioning & Value Prop
Share & Presence
Customer Evidence
Go-to-Market
Digital & Reputation
Compliance & Trust
KPIs & Gaps
Outputs
Full Research Suite comprises of:
Market outlook & trends analysis
Interviews & case studies
Strategic recommendations
Vendor profiles & capabilities analysis
5-year forecasts
8 regions and 60+ country-level data splits
Market segment data splits
12 months of continuous data updates
DELIVERED AS:
PDF EXCEL ONLINE
Wine, Scotch, and Whiskey Barrels Market Size and Share Forecast Outlook 2025 to 2035
Wine Packaging Market Size and Share Forecast Outlook 2025 to 2035
Wine Bag Market Forecast and Outlook 2025 to 2035
Wine Cork Market Size and Share Forecast Outlook 2025 to 2035
Wine Cellar Market Size and Share Forecast Outlook 2025 to 2035
Wine Enzymes Market Analysis Size Share and Forecast Outlook 2025 to 2035
Wine Box Market Size and Share Forecast Outlook 2025 to 2035
Wine Fining Agent Market Size and Share Forecast Outlook 2025 to 2035
Wine Totes Packaging Market Size and Share Forecast Outlook 2025 to 2035
Wine Fermentation Equipment Market Size and Share Forecast Outlook 2025 to 2035
Wine Processing Equipment Market Size and Share Forecast Outlook 2025 to 2035
Wine Racks Market Size and Share Forecast Outlook 2025 to 2035
Wine Filling Machine Market Size and Share Forecast Outlook 2025 to 2035
Wine Bottle Sterilizer Market Size and Share Forecast Outlook 2025 to 2035
Wine Extract Market Size and Share Forecast Outlook 2025 to 2035
Wine Market Analysis - Size, Share, and Forecast Outlook 2025 to 2035
Wine Tourism Market Analysis - Size, Share, and Forecast Outlook 2025 to 2035
Wine Destemmer Market - Growth & Demand 2025 to 2035
Wine Crusher Market Growth - Winemaking Equipment & Industry Trends 2025 to 2035
Wine Filtering Machine Market Expansion - Filtration & Winemaking Technology 2025 to 2035

Thank you!
You will receive an email from our Business Development Manager. Please be sure to check your SPAM/JUNK folder too.
Chat With
MaRIA