The Wine Extract Market is estimated to be valued at USD 50.8 million in 2025 and is projected to reach USD 84.3 million by 2035, registering a compound annual growth rate (CAGR) of 5.2% over the forecast period.
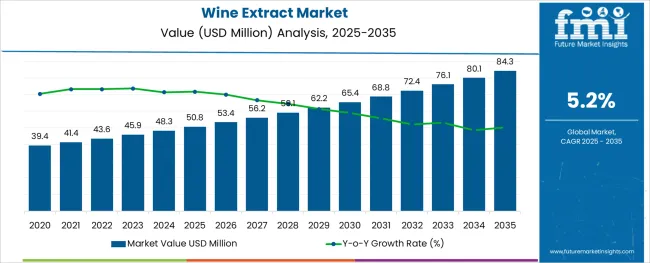
The wine extract market is witnessing consistent growth as industries across food, cosmetics, and nutraceuticals integrate antioxidant-rich ingredients into formulations to meet rising wellness-driven consumption patterns. Wine extracts, particularly those derived from grape skins and seeds, are being incorporated due to their polyphenol content, offering functional benefits such as anti-aging, cardiovascular support, and skin protection.
Manufacturers are innovating with extraction techniques that preserve bioactivity while enhancing solubility and shelf stability. Regulatory approvals across major markets are also expanding the permissible use of wine extracts in fortified foods, beverages, and supplements.
As product developers pursue clean-label alternatives, wine extracts have emerged as a natural additive offering both nutritional and marketing appeal. Future opportunities are expected in personalized nutrition, cosmeceuticals, and functional beverages, with demand being shaped by urban health trends, sustainability in sourcing, and scientific validation of health claims.
The market is segmented by Form and Application and region. By Form, the market is divided into Powder, Capsule, and Liquid. In terms of Application, the market is classified into Food & Beverages, Pharmaceuticals, Cosmetic & Personal Care Products, Dietary Supplements, and Others. Regionally, the market is classified into North America, Latin America, Western Europe, Eastern Europe, Balkan & Baltic Countries, Russia & Belarus, Central Asia, East Asia, South Asia & Pacific, and the Middle East & Africa.
The market is segmented by Form and Application and region. By Form, the market is divided into Powder, Capsule, and Liquid. In terms of Application, the market is classified into Food & Beverages, Pharmaceuticals, Cosmetic & Personal Care Products, Dietary Supplements, and Others. Regionally, the market is classified into North America, Latin America, Western Europe, Eastern Europe, Balkan & Baltic Countries, Russia & Belarus, Central Asia, East Asia, South Asia & Pacific, and the Middle East & Africa.
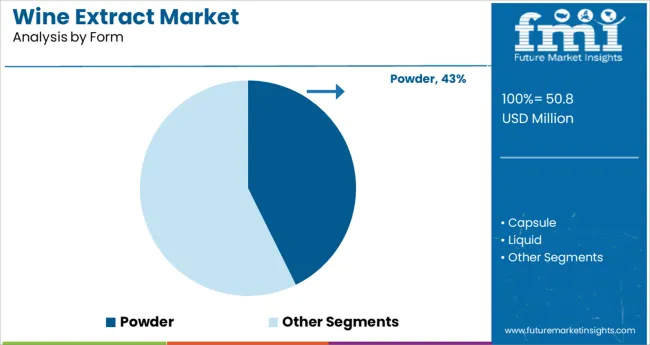
The powder form segment is projected to account for 42.7% of total revenue in the wine extract market by 2025, positioning it as the leading form. This dominance has been driven by the superior versatility, solubility, and shelf stability offered by powdered extracts across a range of applications.
Powdered wine extract allows for easy integration into dry formulations such as capsules, tablets, baking mixes, and health powders without compromising potency. Additionally, it supports precise dosing and is favored in manufacturing processes that require controlled moisture levels.
The convenience of transport and storage, along with better compatibility with encapsulation and spray-drying technologies, has further reinforced its widespread adoption. Producers are also benefiting from cost-effective logistics and extended product shelf life, making the powdered form the most commercially viable format for wine extract deployment across industries.
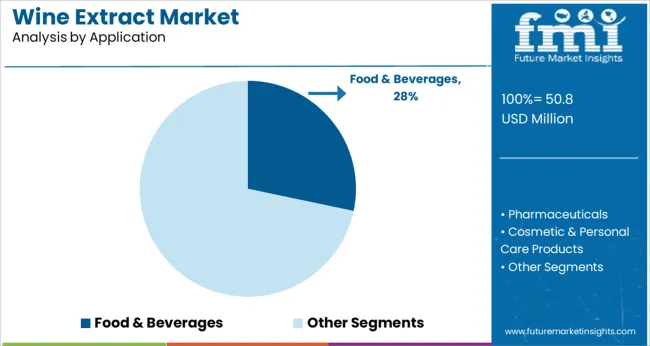
The food and beverages application segment is expected to hold 28.3% of the overall wine extract market revenue in 2025, emerging as the leading end-use category. This position is attributed to the increasing incorporation of wine-derived polyphenols into functional foods, health drinks, and premium culinary products.
Wine extracts are being valued not only for their nutritional profile but also for their natural coloring, flavor-enhancing, and preservative properties. Health-conscious consumers are influencing product innovation in categories such as fortified juices, energy bars, dairy alternatives, and ready-to-drink beverages where clean-label and antioxidant-rich ingredients are in demand.
The segment’s growth is further supported by wineries and food manufacturers pursuing by-product valorization, transforming grape residues into high-value functional ingredients. With expanding consumer interest in functional nutrition and natural fortification, the food and beverages segment is expected to remain a critical driver of wine extract market expansion.
The cosmetic industry is experiencing strong demand and growth and is anticipated to boom in the future. This is because of rising awareness of skincare amongst the population. The application of wine extract in the cosmetic industry is projected to promote the global wine extract market during the forecast period. Several key market players introduced their new and latest skincare products that contain wine extract as an active ingredient.
The growing adoption of anti-aging creams owing to more population being conscious about their skincare is driving the demand for wine extract market across the globe. It has been concluded that wine extract is a rich source of resveratrol. It also portrays some exclusive properties like it stimulates eNOS activity, preventing the oxidation of LDL cholesterol, preventing blood clotting, and decreasing the risk of Alzheimer’s disease.
Besides slowing the rate of aging, wine extracts also assist with managing obesity. Wine extracts have versatile properties and are, therefore, likely to attract applications in the pharmaceutical segment as well. This is likely to promote the growth of the wine extract market rebelliously. Additionally, the market is boosted by the rising awareness amongst consumers about the health benefits linked with the wine extract.
The growing popularity of wine extract, along with increasing alcohol consumption, and the rising need for wine extract from the pharmaceutical industry, are two crucial drivers of the global wine extract market. The growing health-conscious population is one market trend supporting the demand for wine extracts. Growing disposable income in developing countries and the alarming use of wine extract in anti-aging creams is opening new opportunities for the market players in this segment.
Based on the form of wine extract, in 2024, the powder segment attributed for the biggest market share in the global wine extract market, and it is likely to maintain its market position during the forecast period. In the application segment, powdered wine extract is used as an active ingredient in several medicines, cosmetic products, anti-aging supplements, and several other applications. Nevertheless, liquid wine extract is anticipated to be the swiftest growing segment in terms of value sales over the forecast period.
Even though wine extracts have anti-cancer benefits, a few researchers have claimed that these extracts could promote breast cancer in extreme cases. Also, wine extract acts as an anti-coagulant, meaning that if an individual who is already on blood thinner medication consumes wine extracts, he/she could suffer from excessive bleeding in case of an injury. All these factors combined are likely to hinder the lucrative growth of the wine extract market. Also, one of the key market-challenging factors is the lack of awareness regarding the use of wine extracts among consumers.
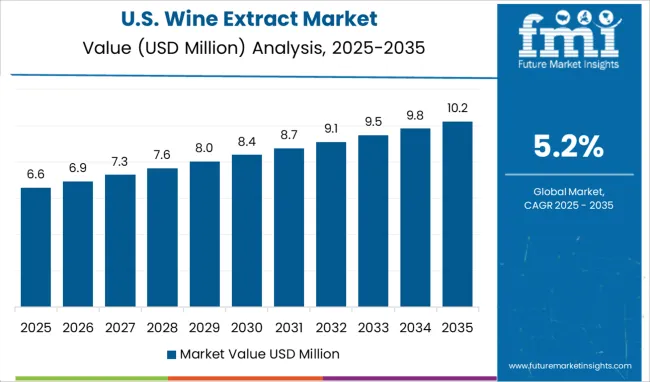
North America is expected to have the major market share globally, as it is the largest producer and consumer of wine extract. This region is accountable for 35.60% market share globally. North America leads in the consumption of wine extracts owing to the growing availability in the form of supplements amongst consumers. This can be attributed to factors such as the growing prevalence of diseases like coronary heart disease, high cholesterol, high blood pressure, congestive heart failure, and atherosclerosis.
In North America, leading consumers of wine extracts in the form of resveratrol are in the United States. There is growing demand for dietary supplements in this country is driving the growth of the wine extracts market in this region. Moreover, the existence of some of the key market players is assisting in the extension of the market in the United States. Additionally, the growth strategies that these market players are adopting are said to help with the overall expansion.
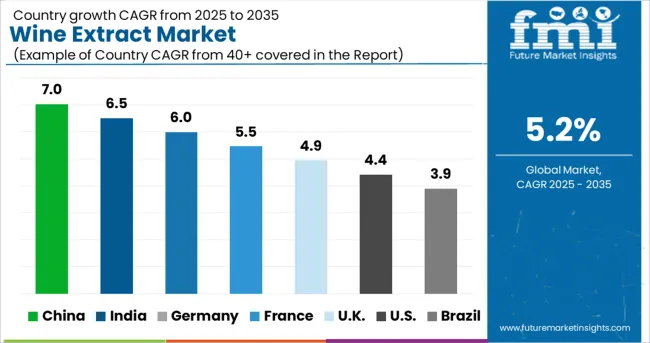
The Europe region is the second-largest wine extract market after North America in the global wine extract market. Europe is accountable for 28.40% of the global market share. This is owing to the presence of several key market players and their strategic mergers and acquisitions to broaden its product portfolio with wine extract-infused products.
The growing demand for dietary supplements in countries like Germany is anticipated to propel the demand for wine extract in the Europe region. Furthermore, excessive spending of consumers on dietary supplements is anticipated to escalate the demand for wine extracts in the future.
With time business models evolve, sometimes because of changes in the market and many a time due to the invention of new technology. This leads to the emergence of new and exciting trends. FMI closely monitors the start-up ecosystem from around the globe and presents multiple interesting new pieces of information which gain popularity.
A start-up ecosystem becomes the backbone of a country’s economy and has massive support and contributions to promote a country’s economic condition. The production of jobs and ample employment opportunities has played a substantial role in the start-up ecosystem in a particular country.
In April 2024, the Beauty Co., a skincare and grooming brand, introduced its latest collection D’Wine. The collection has been formulated with an exclusive and rare combination of wine extracts and goodness berries. Their products are thoroughly crafted and thoughtfully made with love and dedication to suit every woman’s needs.
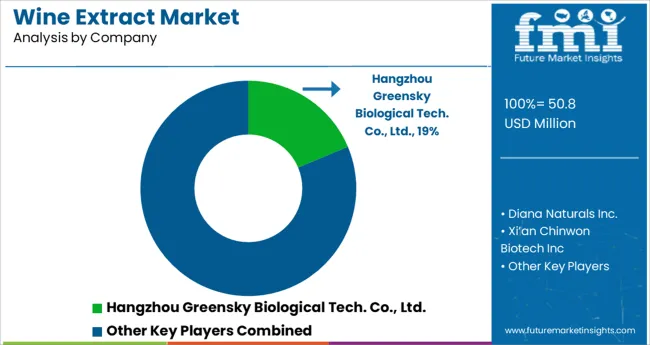
Some of the key players in the wine extract market are SEPPIC Inc. and Hangzhou Greensky Biological Tech. Co., Ltd., Diana Naturals Inc., Xi'an Chinwon Biotech Inc., GRAP'SUD, Diana Naturals Inc, Ethical Naturals, Inc., VDF/FutureCeuticals, Inc., and others.
Some Companies are focusing on innovations and advancements in wine extract to exploit maximum revenue potential in the global wine extract market. Market players have adopted strategies such as product approvals, product launches, market initiatives, and mergers and acquisitions.
In April 2025, Symrise announced the Diana food™ portfolio brand of natural health activities. Symrise has bolstered the company's position in the consumer health market. It has transposed the Diana food™ legacy health activities as a portfolio brand for consumer health products. The Diana food™ portfolio brand consists of a broad range of trusted and sustainable natural health ingredients.
| Report Attribute | Details |
|---|---|
| Growth Rate | CAGR of 5.20% from 2025 to 2035 |
| Base Year for Estimation | 2024 |
| Historical Data | 2020 to 2024 |
| Forecast Period | 2025 to 2035 |
| Quantitative Units | Revenue in USD Million and CAGR from 2025 to 2035 |
| Report Coverage | Revenue Forecast, Volume Forecast, Company Ranking, Competitive Landscape, Growth Factors, Trends, and Pricing Analysis |
| Segments Covered | Form, Application, Region |
| Regions Covered | North America; Latin America; Europe; East Asia; South Asia; Oceania; Middle East and Africa |
| Key Countries Profiled | United States of America, Canada, Brazil, Argentina, Germany, United Kingdom, France, Spain, Italy, Nordics, BENELUX, Australia & New Zealand, China, India, ASIAN, GCC Countries, South Africa |
| Key Companies Profiled | SEPPIC Inc.; Hangzhou Greensky Biological Tech. Co., Ltd.; Diana Naturals Inc.; Xi’an Chinwon Biotech Inc.; GRAP'SUD; Diana Naturals Inc; Ethical Naturals, Inc.; VDF/FutureCeuticals, Inc. |
| Customization | Available Upon Request |
The global wine extract market is estimated to be valued at USD 50.8 USD million in 2025.
It is projected to reach USD 84.3 USD million by 2035.
The market is expected to grow at a 5.2% CAGR between 2025 and 2035.
The key product types are powder, capsule and liquid.
food & beverages segment is expected to dominate with a 28.3% industry share in 2025.


Full Research Suite comprises of:
Market outlook & trends analysis
Interviews & case studies
Strategic recommendations
Vendor profiles & capabilities analysis
5-year forecasts
8 regions and 60+ country-level data splits
Market segment data splits
12 months of continuous data updates
DELIVERED AS:
PDF EXCEL ONLINE
Wine Packaging Market Size and Share Forecast Outlook 2025 to 2035
Wine Bag Market Forecast and Outlook 2025 to 2035
Wine Cork Market Size and Share Forecast Outlook 2025 to 2035
Wine Barrel Market Size and Share Forecast Outlook 2025 to 2035
Wine Cellar Market Size and Share Forecast Outlook 2025 to 2035
Wine Enzymes Market Analysis Size Share and Forecast Outlook 2025 to 2035
Wine Box Market Size and Share Forecast Outlook 2025 to 2035
Wine Fining Agent Market Size and Share Forecast Outlook 2025 to 2035
Wine, Scotch, and Whiskey Barrels Market Size and Share Forecast Outlook 2025 to 2035
Wine Totes Packaging Market Size and Share Forecast Outlook 2025 to 2035
Wine Fermentation Equipment Market Size and Share Forecast Outlook 2025 to 2035
Wine Processing Equipment Market Size and Share Forecast Outlook 2025 to 2035
Wine Racks Market Size and Share Forecast Outlook 2025 to 2035
Wine Filling Machine Market Size and Share Forecast Outlook 2025 to 2035
Wine Bottle Sterilizer Market Size and Share Forecast Outlook 2025 to 2035
Wine Market Analysis - Size, Share, and Forecast Outlook 2025 to 2035
Wine Tourism Market Analysis - Size, Share, and Forecast Outlook 2025 to 2035
Wine Destemmer Market - Growth & Demand 2025 to 2035
Wine Filtering Machine Market Expansion - Filtration & Winemaking Technology 2025 to 2035
Wine Crusher Market Growth - Winemaking Equipment & Industry Trends 2025 to 2035

Thank you!
You will receive an email from our Business Development Manager. Please be sure to check your SPAM/JUNK folder too.
Chat With
MaRIA