Micro Winery Equipment Market Analysis - Size, Share, and Forecast 2023 to 2033

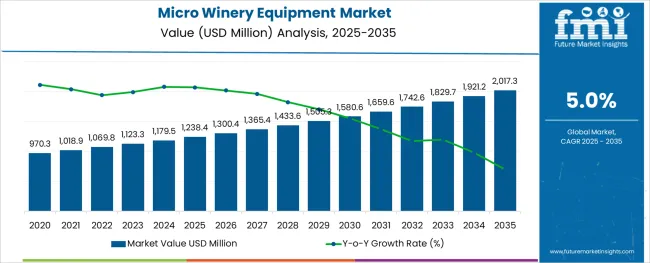
According to research by Future Market Insights, The micro-winery equipment market is anticipated to expand at a CAGR of 5.0% during the forecasted period. According to Forecasts, the market would be worth USD 1,829.7 million by 2033, up from USD 1,123.3 million in 2023.

Attribute Details
The market size value in 2023 USD 1,123.3 million
Market forecast value in 2033 USD 1,829.7 million
Forecast period 2023 to 2033
Global growth rate (CAGR) 5.0%
Share of Germany in Micro winery equipment Market 21.5%

The constant need for wine and advanced technology adding new fermentation of wine fuels the demand for micro wine equipment. The temperature control equipment along with wine arrangements has been increased lately. The winemakers mix the yeast with grape juice where the yeast cells eat up the glucose while also rearranging them into carbon dioxide and alcohol through the advanced fermentation process.

The factors such as the growing popularity of micro-wineries and the trend of consumers wanting smaller production wines fuel the demand for micro-winery equipment. Other factors that are driving the growth of this market include the need for less capital investment and lower operating costs.

The restoration of the FMCG industry along with the tourism resettlement has fueled the demand for wine and wine equipment. Wine enthusiasts play with the ingredients, making it exclusive for everyone’s demand. New restaurants and bars are opening in Asia along with Europe experimenting with wine projects as it is the birthland of wine.

Wine-making machines adopt wine equipment that further enhances the taste of the wine while making it available in their homes. The unlimited supply of wine is what attracts the end users to adopt these technologies that help them in retaining the wine proportion.

Wine with native flavors that suit the best local cuisines is also pushing vendors to design these new wine experiences for wine enthusiasts along with the adjustment in micro-winery equipment.

2018 to 2022 Global Micro Winery Equipment Sales Outlook Compared to Forecast for 2023 to 2033

The advanced wineries with home-grown grape wines along with the health awareness around it have pushed the demand for a home-based wine production solution.

According to Future Market Insights, the Micro winery equipment market was growing at a CAGR of 5.2% to reach USD 1,069.8 million in 2022 from USD 873.5 million in 2018.

The rising popularity of wine among millennials and the growing number of women drinkers are some of the key factors driving the market growth. In addition, the increasing demand for premium and organic wines is also boosting the market demand. However, the high cost of micro-winery equipment and the stringent regulations regarding alcohol production are some of the major challenges faced by manufacturers in this market. Nonetheless, the growing popularity of home-based wineries is expected to create lucrative opportunities for micro-winery equipment manufacturers in the coming years.

According to research by Future Market Insights, The Micro winery equipment market is anticipated to expand at a CAGR of 5.0% during the forecasted period.

Micro Winery Equipment Industry Analysis by Equipment Type, Capacity, and Application

How is the food and beverage Industry Supporting the Growth of the Micro Winery Equipment Market?

The food and beverage industry is a major contributor to the growth of the micro winery equipment market. The industry provides a wide range of products and services that are essential for the production of wine. In addition, the industry has a significant impact on the economy and job market.

The food and beverage industry is an important part of the economy. The industry employs millions of people and generates billions of dollars in revenue each year. In addition, the industry is a major consumer of natural resources.

The food and beverage industry is also a major contributor to the growth of the micro winery equipment market. The industry provides a wide range of products and services that are essential for the production of wine. In addition, the industry has a significant impact on the economy and job market.

By Application, which Category will experience Maximum Micro Winery Equipment growth?

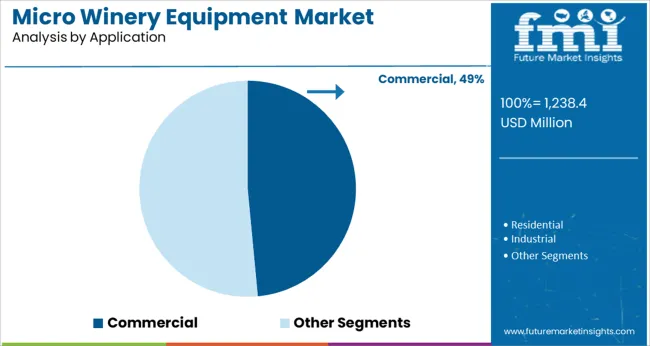
The commercial sector is expected to experience the maximum micro winery equipment growth in the coming years. This is attributed to the increasing demand for wine in the market and the need for efficient and cost-effective production of wine. In addition, the growing popularity of microbreweries and home winemaking is also anticipated to drive the growth of micro winery equipment market.
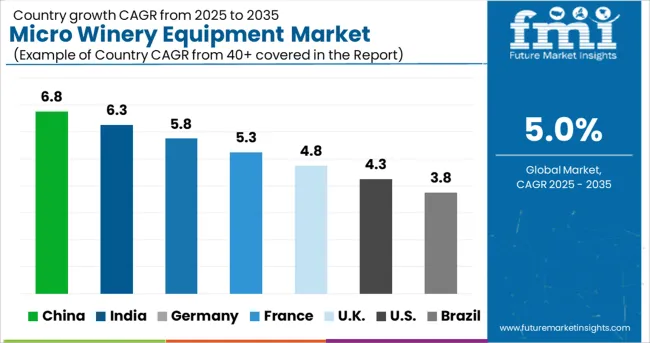
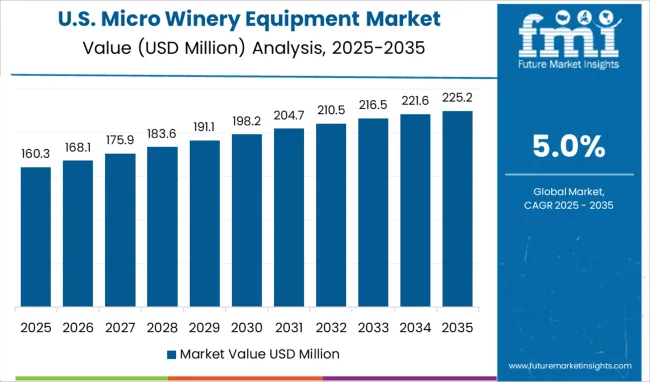
Top Countries Expanding Adoption of Micro Winery Equipment

The USA market for micro-winery equipment is thriving as restaurants and bars are adopting new wine and beer equipment.

The United States holds the biggest share in the global micro-winery equipment market. The USA has become the biggest region because of the craze for wine consumption, more beverage-based startups, and proliferating number of bars and restaurants that offers native wine in their gardens.

Other than this, the increased awareness around micro wineries, benefitting, is also flourishing the demand for them. The number of small-scale wineries in North America has grown exponentially in recent years. This expansion can be attributed to the growing popularity of wine as well as the numerous advantages of owning a micro-winery. The low cost of entry is one of the primary reasons that North America has the largest market share in the micro-winery equipment market. When compared to traditional wineries, the initial investment for establishing a small-scale winery is relatively low, making it an appealing option for many entrepreneurs.

Allowance and restoration of the FMCG sector along with restaurants and bars opening up strengthens the micro winery equipment market.

The United Kingdom, with the latest home-based bars opening, is consuming the most from the micro-winery equipment market. It is due to advanced technology and rising demand for native wine that complements the other cuisines. The local food markets have started applying this equipment to produce wine so that they do not run out of wine. The long-range of wine types present in the United Kingdom, along with experimentation liberty, has limited the demand for micro-winery equipment. Another factor that makes Europe an attractive market for micro-winery equipment is the high level of quality that European consumers expect from their wines. This quality can be achieved with the use of high-quality micro-winery equipment.

The constantly evolving economy of China coupled with the higher wine consumption fuels the micro-winery equipment market.

Chinese wine has its special space in the global wine market due to its processing time and way. The demand for wine in China spikes as people get more aware of the benefits of wine drinking. Furthermore, the rising geriatric population indulges in drinking activities at a higher rate, ends up entities, bars, and other beverage-serving outlets have started adopting micro-winery equipment that ferments the grapes and produces fresh wine. Asia Pacific market for micro-winery equipment is growing at the highest CAGR, followed by Europe and North America. The fueling demand for exotic beverages is attributed to the higher demand for rich wine that further flourishes the micro-winery equipment market in the region.
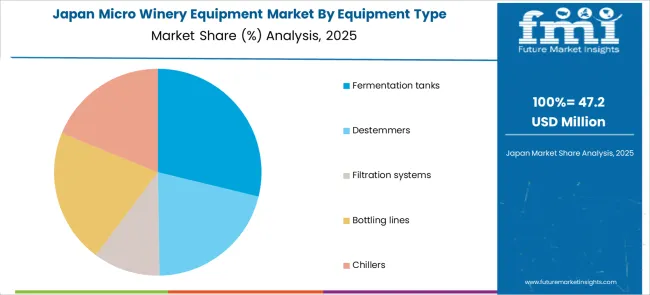
Expanding the Japanese wine industry along with the higher wine equipment exports in the region has led to market growth.

The new and advanced technology in the FMCG sector enhances the beverage intake experience along with higher restaurant and bar penetration. The rising demand for fresh red wine in the urban region, with the rising awareness around the benefits of each type of win fuel, has fueled the demand for micro-winery equipment. The advent of advanced micro winery technology that produces wine efficiently is pushing spaces and even individuals to adopt micro-winery equipment.

The higher alcohol consumption along with softened government restrictions over wine production has led to the rising growth of the micro winery equipment market.

The changing consumer preferences towards wine and the growing disposable income are some of the other factors driving the growth of this market. Moreover, various government initiatives, such as setting up special economic zones (SEZs) and tax rebates, are attracting foreign investments in this region, which is further boosting the growth of this market.

Innovative Start-ups Transforming the Micro Winery Equipment Sector

The craze for wine has continued and the enthusiasts have started their small wineries with the idea of producing the best wine amongst the wine community. The business starts by producing the equipment that helps these wine enthusiasts in the best possible way. The easy fermentation process, smooth dilution, and precise bottling are what is expected out of one good micro winery equipment.
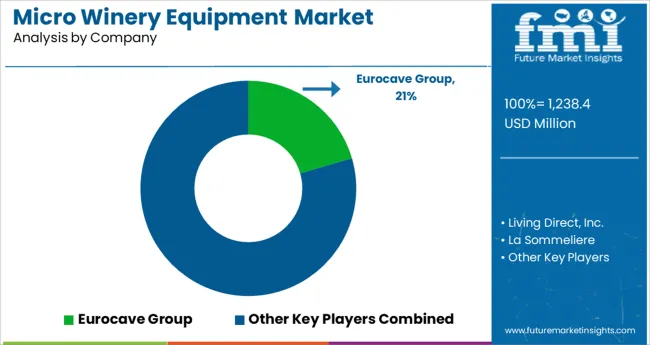
Leading Competitors in the Global Micro Winery Equipment Market

The micro winery equipment market is a highly competitive landscape. There are a large number of manufacturers offering a wide range of products. The competition is intense, and companies are constantly trying to gain market share.

The micro winery equipment market is growing rapidly. This is due to the increasing popularity of wine and the need for smaller, more efficient equipment. The market is expected to continue to grow in the future.

There are a few key players in the micro winery equipment market. These companies have a strong presence in the market and offer a variety of products. They are also able to offer competitive prices.

Recent Market Developments

  • La Sommeliere has introduced its new micro wine machine that works on a faster wine processing mechanism. Along with that, the company has introduced a big Sommelier SLS106, a single-zone cellar that holds 106 bottles.
  • Apart from producing wine cabinets, The Liebherr Group has introduced its own micro winery products that manufacture case-like wine.

Top Companies Driving the Micro Winery Equipment Market Landscape

  • Living Direct, Inc.
  • La Sommeliere
  • The Liebherr Group
  • Climadi
  • Viking Range Corporation
  • Sunpentown Inc.
  • Avintage, Climadiff S.A.
  • Dometic Group
  • Electrolux AB
  • Haier
  • BSH Home Appliances Group
  • Avanti Products.
  • Allavino
  • Eurocave Group
  • Shenzhen VRBON Electrical Appliance Co. LTD
  • Donlert Electrical Co. Ltd
  • LG Electronics
  • Siemens AG

Scope of the Micro Winery Equipment Industry Report

Attribute Details
Forecast period 2023 to 2033
Historical data available for 2018 to 2022
Market analysis USD million in value
Key Regions Covered North America; Eastern Europe; Western Europe; Japan; South America; Asian Pacific; Middle East and Africa
Key Countries Covered USA, Germany, France, Italy, Canada, United Kingdom, Spain, China, India, Australia
Key SegmentsCovered Equipment type, Mode of operation, Application, Distribution channel, Region
Key Companies Profiled Living Direct, Inc.; La Sommeliere; The Liebherr Group; Climadi; Viking Range Corporation; Sunpentown Inc.; Avintage, Climadiff S.A.; Dometic Group; Electrolux AB; Haier; BSH Home Appliances Group; Avanti Products.; Allavino; Eurocave Group; Shenzhen VRBON Electrical Appliance Co. LTD; Donlert Electrical Co. Ltd; LG Electronics; Siemens AG
Report Coverage Market Forecast, Company Share Analysis, DROT Analysis, Market Dynamics, Competitive Landscape, Challenges, Strategic Growth Initiatives
Customization and Pricing

Available upon request

Top Investment Segments in the Micro Winery Equipment Market

By Equipment Type:

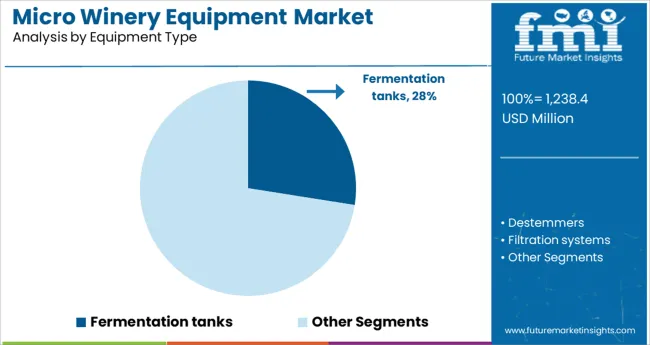
  • Fermentation tanks
  • Destemmers
  • Filtration systems
  • Bottling lines
  • Chillers

By Mode of Operation:

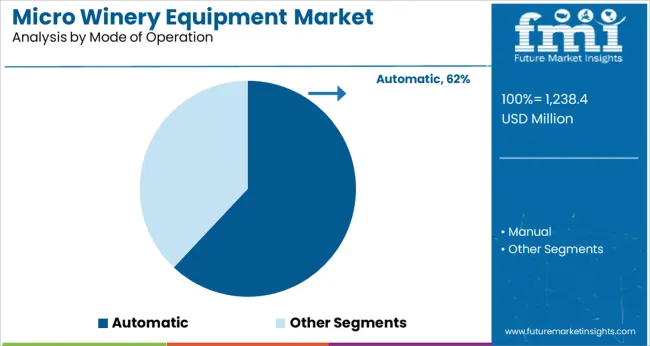
  • Automatic
  • Manual

By Application:

  • Commercial
  • Residential
  • Industrial

By Distribution Channel:

  • Online
  • Offline

By Region:

  • North America
  • Latin America
  • Asia Pacific
  • Eastern Europe
  • Western Europe
  • Japan

Table of Content

  • 1. Executive Summary
  • 2. Market Overview
  • 3. Market Background
  • 4. Global Analysis 2018 to 2022 and Forecast, 2023 to 2033
  • 5. Global Analysis 2018 to 2022 and Forecast 2023 to 2033, By Equipment Type
    • 5.1. Fermentation Tanks
    • 5.2. Destemmers
    • 5.3. Filtration Systems
    • 5.4. Bottling Lines
    • 5.5. Chillers
  • 6. Global Analysis 2018 to 2022 and Forecast 2023 to 2033, By Application
    • 6.1. Commercial
    • 6.2. Residential
    • 6.3. Industrial
  • 7. Global Analysis 2018 to 2022 and Forecast 2023 to 2033, By Mode of Operation
    • 7.1. Automatic
    • 7.2. Manual
  • 8. Global Analysis 2018 to 2022 and Forecast 2023 to 2033, By Region
    • 8.1. North America
    • 8.2. Latin America
    • 8.3. Europe
    • 8.4. East Asia
    • 8.5. South Asia
    • 8.6. Oceania
    • 8.7. Middle East and Africa (MEA)
  • 9. North America Analysis 2018 to 2022 and Forecast 2023 to 2033, By Country
  • 10. Latin America Analysis 2018 to 2022 and Forecast 2023 to 2033, By Country
  • 11. Europe Analysis 2018 to 2022 and Forecast 2023 to 2033, By Country
  • 12. East Asia Analysis 2018 to 2022 and Forecast 2023 to 2033, By Country
  • 13. South Asia Analysis 2018 to 2022 and Forecast 2023 to 2033, By Country
  • 14. Oceania Analysis 2018 to 2022 and Forecast 2023 to 2033, By Country
  • 15. MEA Analysis 2018 to 2022 and Forecast 2023 to 2033, By Country
  • 16. Key Countries Analysis
  • 17. Market Structure Analysis
  • 18. Competition Analysis
    • 18.1. Living Direct, Inc.
    • 18.2. La Sommeliere
    • 18.3. The Liebherr Group
    • 18.4. Climadi
    • 18.5. Viking Range Corporation
    • 18.6. Sunpentown Inc.
    • 18.7. Avintage, Climadiff S.A.
    • 18.8. Dometic Group
    • 18.9. Electrolux AB
    • 18.10. Haier
    • 18.11. BSH Home Appliances Group
    • 18.12. Avanti Products
    • 18.13. Allavino
    • 18.14. Eurocave Group
    • 18.15. Shenzhen VRBON Electrical Appliance Co. LTD
    • 18.16. Donlert Electrical Co. Ltd
  • 19. Assumptions & Acronyms Used
  • 20. Research Methodology

List of Tables

Table 1: Global Value (US$ million) Forecast by Region, 2018 to 2033

Table 2: Global Volume (MT) Forecast by Region, 2018 to 2033

Table 3: Global Value (US$ million) Forecast by Equipment type, 2018 to 2033

Table 4: Global Volume (MT) Forecast by Equipment type, 2018 to 2033

Table 5: Global Value (US$ million) Forecast by Application, 2018 to 2033

Table 6: Global Volume (MT) Forecast by Application, 2018 to 2033

Table 7: Global Value (US$ million) Forecast by Mode of operation, 2018 to 2033

Table 8: Global Volume (MT) Forecast by Mode of operation, 2018 to 2033

Table 9: North America Value (US$ million) Forecast by Country, 2018 to 2033

Table 10: North America Volume (MT) Forecast by Country, 2018 to 2033

Table 11: North America Value (US$ million) Forecast by Equipment type, 2018 to 2033

Table 12: North America Volume (MT) Forecast by Equipment type, 2018 to 2033

Table 13: North America Value (US$ million) Forecast by Application, 2018 to 2033

Table 14: North America Volume (MT) Forecast by Application, 2018 to 2033

Table 15: North America Value (US$ million) Forecast by Mode of operation, 2018 to 2033

Table 16: North America Volume (MT) Forecast by Mode of operation, 2018 to 2033

Table 17: Latin America Value (US$ million) Forecast by Country, 2018 to 2033

Table 18: Latin America Volume (MT) Forecast by Country, 2018 to 2033

Table 19: Latin America Value (US$ million) Forecast by Equipment type, 2018 to 2033

Table 20: Latin America Volume (MT) Forecast by Equipment type, 2018 to 2033

Table 21: Latin America Value (US$ million) Forecast by Application, 2018 to 2033

Table 22: Latin America Volume (MT) Forecast by Application, 2018 to 2033

Table 23: Latin America Value (US$ million) Forecast by Mode of operation, 2018 to 2033

Table 24: Latin America Volume (MT) Forecast by Mode of operation, 2018 to 2033

Table 25: Europe Value (US$ million) Forecast by Country, 2018 to 2033

Table 26: Europe Volume (MT) Forecast by Country, 2018 to 2033

Table 27: Europe Value (US$ million) Forecast by Equipment type, 2018 to 2033

Table 28: Europe Volume (MT) Forecast by Equipment type, 2018 to 2033

Table 29: Europe Value (US$ million) Forecast by Application, 2018 to 2033

Table 30: Europe Volume (MT) Forecast by Application, 2018 to 2033

Table 31: Europe Value (US$ million) Forecast by Mode of operation, 2018 to 2033

Table 32: Europe Volume (MT) Forecast by Mode of operation, 2018 to 2033

Table 33: East Asia Value (US$ million) Forecast by Country, 2018 to 2033

Table 34: East Asia Volume (MT) Forecast by Country, 2018 to 2033

Table 35: East Asia Value (US$ million) Forecast by Equipment type, 2018 to 2033

Table 36: East Asia Volume (MT) Forecast by Equipment type, 2018 to 2033

Table 37: East Asia Value (US$ million) Forecast by Application, 2018 to 2033

Table 38: East Asia Volume (MT) Forecast by Application, 2018 to 2033

Table 39: East Asia Value (US$ million) Forecast by Mode of operation, 2018 to 2033

Table 40: East Asia Volume (MT) Forecast by Mode of operation, 2018 to 2033

Table 41: South Asia Value (US$ million) Forecast by Country, 2018 to 2033

Table 42: South Asia Volume (MT) Forecast by Country, 2018 to 2033

Table 43: South Asia Value (US$ million) Forecast by Equipment type, 2018 to 2033

Table 44: South Asia Volume (MT) Forecast by Equipment type, 2018 to 2033

Table 45: South Asia Value (US$ million) Forecast by Application, 2018 to 2033

Table 46: South Asia Volume (MT) Forecast by Application, 2018 to 2033

Table 47: South Asia Value (US$ million) Forecast by Mode of operation, 2018 to 2033

Table 48: South Asia Volume (MT) Forecast by Mode of operation, 2018 to 2033

Table 49: Oceania Value (US$ million) Forecast by Country, 2018 to 2033

Table 50: Oceania Volume (MT) Forecast by Country, 2018 to 2033

Table 51: Oceania Value (US$ million) Forecast by Equipment type, 2018 to 2033

Table 52: Oceania Volume (MT) Forecast by Equipment type, 2018 to 2033

Table 53: Oceania Value (US$ million) Forecast by Application, 2018 to 2033

Table 54: Oceania Volume (MT) Forecast by Application, 2018 to 2033

Table 55: Oceania Value (US$ million) Forecast by Mode of operation, 2018 to 2033

Table 56: Oceania Volume (MT) Forecast by Mode of operation, 2018 to 2033

Table 57: MEA Value (US$ million) Forecast by Country, 2018 to 2033

Table 58: MEA Volume (MT) Forecast by Country, 2018 to 2033

Table 59: MEA Value (US$ million) Forecast by Equipment type, 2018 to 2033

Table 60: MEA Volume (MT) Forecast by Equipment type, 2018 to 2033

Table 61: MEA Value (US$ million) Forecast by Application, 2018 to 2033

Table 62: MEA Volume (MT) Forecast by Application, 2018 to 2033

Table 63: MEA Value (US$ million) Forecast by Mode of operation, 2018 to 2033

Table 64: MEA Volume (MT) Forecast by Mode of operation, 2018 to 2033

List of Figures

Figure 1: Global Value (US$ million) by Equipment Type, 2023 to 2033

Figure 2: Global Value (US$ million) by Application, 2023 to 2033

Figure 3: Global Value (US$ million) by Mode of Operation, 2023 to 2033

Figure 4: Global Value (US$ million) by Region, 2023 to 2033

Figure 5: Global Value (US$ million) Analysis by Region, 2018 to 2033

Figure 6: Global Volume (MT) Analysis by Region, 2018 to 2033

Figure 7: Global Value Share (%) and BPS Analysis by Region, 2023 to 2033

Figure 8: Global Y-o-Y Growth (%) Projections by Region, 2023 to 2033

Figure 9: Global Value (US$ million) Analysis by Equipment Type, 2018 to 2033

Figure 10: Global Volume (MT) Analysis by Equipment Type, 2018 to 2033

Figure 11: Global Value Share (%) and BPS Analysis by Equipment Type, 2023 to 2033

Figure 12: Global Y-o-Y Growth (%) Projections by Equipment Type, 2023 to 2033

Figure 13: Global Value (US$ million) Analysis by Application, 2018 to 2033

Figure 14: Global Volume (MT) Analysis by Application, 2018 to 2033

Figure 15: Global Value Share (%) and BPS Analysis by Application, 2023 to 2033

Figure 16: Global Y-o-Y Growth (%) Projections by Application, 2023 to 2033

Figure 17: Global Value (US$ million) Analysis by Mode of Operation, 2018 to 2033

Figure 18: Global Volume (MT) Analysis by Mode of Operation, 2018 to 2033

Figure 19: Global Value Share (%) and BPS Analysis by Mode of Operation, 2023 to 2033

Figure 20: Global Y-o-Y Growth (%) Projections by Mode of Operation, 2023 to 2033

Figure 21: Global Attractiveness by Equipment Type, 2023 to 2033

Figure 22: Global Attractiveness by Application, 2023 to 2033

Figure 23: Global Attractiveness by Mode of Operation, 2023 to 2033

Figure 24: Global Attractiveness by Region, 2023 to 2033

Figure 25: North America Value (US$ million) by Equipment Type, 2023 to 2033

Figure 26: North America Value (US$ million) by Application, 2023 to 2033

Figure 27: North America Value (US$ million) by Mode of Operation, 2023 to 2033

Figure 28: North America Value (US$ million) by Country, 2023 to 2033

Figure 29: North America Value (US$ million) Analysis by Country, 2018 to 2033

Figure 30: North America Volume (MT) Analysis by Country, 2018 to 2033

Figure 31: North America Value Share (%) and BPS Analysis by Country, 2023 to 2033

Figure 32: North America Y-o-Y Growth (%) Projections by Country, 2023 to 2033

Figure 33: North America Value (US$ million) Analysis by Equipment Type, 2018 to 2033

Figure 34: North America Volume (MT) Analysis by Equipment Type, 2018 to 2033

Figure 35: North America Value Share (%) and BPS Analysis by Equipment Type, 2023 to 2033

Figure 36: North America Y-o-Y Growth (%) Projections by Equipment Type, 2023 to 2033

Figure 37: North America Value (US$ million) Analysis by Application, 2018 to 2033

Figure 38: North America Volume (MT) Analysis by Application, 2018 to 2033

Figure 39: North America Value Share (%) and BPS Analysis by Application, 2023 to 2033

Figure 40: North America Y-o-Y Growth (%) Projections by Application, 2023 to 2033

Figure 41: North America Value (US$ million) Analysis by Mode of Operation, 2018 to 2033

Figure 42: North America Volume (MT) Analysis by Mode of Operation, 2018 to 2033

Figure 43: North America Value Share (%) and BPS Analysis by Mode of Operation, 2023 to 2033

Figure 44: North America Y-o-Y Growth (%) Projections by Mode of Operation, 2023 to 2033

Figure 45: North America Attractiveness by Equipment Type, 2023 to 2033

Figure 46: North America Attractiveness by Application, 2023 to 2033

Figure 47: North America Attractiveness by Mode of Operation, 2023 to 2033

Figure 48: North America Attractiveness by Country, 2023 to 2033

Figure 49: Latin America Value (US$ million) by Equipment Type, 2023 to 2033

Figure 50: Latin America Value (US$ million) by Application, 2023 to 2033

Figure 51: Latin America Value (US$ million) by Mode of Operation, 2023 to 2033

Figure 52: Latin America Value (US$ million) by Country, 2023 to 2033

Figure 53: Latin America Value (US$ million) Analysis by Country, 2018 to 2033

Figure 54: Latin America Volume (MT) Analysis by Country, 2018 to 2033

Figure 55: Latin America Value Share (%) and BPS Analysis by Country, 2023 to 2033

Figure 56: Latin America Y-o-Y Growth (%) Projections by Country, 2023 to 2033

Figure 57: Latin America Value (US$ million) Analysis by Equipment Type, 2018 to 2033

Figure 58: Latin America Volume (MT) Analysis by Equipment Type, 2018 to 2033

Figure 59: Latin America Value Share (%) and BPS Analysis by Equipment Type, 2023 to 2033

Figure 60: Latin America Y-o-Y Growth (%) Projections by Equipment Type, 2023 to 2033

Figure 61: Latin America Value (US$ million) Analysis by Application, 2018 to 2033

Figure 62: Latin America Volume (MT) Analysis by Application, 2018 to 2033

Figure 63: Latin America Value Share (%) and BPS Analysis by Application, 2023 to 2033

Figure 64: Latin America Y-o-Y Growth (%) Projections by Application, 2023 to 2033

Figure 65: Latin America Value (US$ million) Analysis by Mode of Operation, 2018 to 2033

Figure 66: Latin America Volume (MT) Analysis by Mode of Operation, 2018 to 2033

Figure 67: Latin America Value Share (%) and BPS Analysis by Mode of Operation, 2023 to 2033

Figure 68: Latin America Y-o-Y Growth (%) Projections by Mode of Operation, 2023 to 2033

Figure 69: Latin America Attractiveness by Equipment Type, 2023 to 2033

Figure 70: Latin America Attractiveness by Application, 2023 to 2033

Figure 71: Latin America Attractiveness by Mode of Operation, 2023 to 2033

Figure 72: Latin America Attractiveness by Country, 2023 to 2033

Figure 73: Europe Value (US$ million) by Equipment Type, 2023 to 2033

Figure 74: Europe Value (US$ million) by Application, 2023 to 2033

Figure 75: Europe Value (US$ million) by Mode of Operation, 2023 to 2033

Figure 76: Europe Value (US$ million) by Country, 2023 to 2033

Figure 77: Europe Value (US$ million) Analysis by Country, 2018 to 2033

Figure 78: Europe Volume (MT) Analysis by Country, 2018 to 2033

Figure 79: Europe Value Share (%) and BPS Analysis by Country, 2023 to 2033

Figure 80: Europe Y-o-Y Growth (%) Projections by Country, 2023 to 2033

Figure 81: Europe Value (US$ million) Analysis by Equipment Type, 2018 to 2033

Figure 82: Europe Volume (MT) Analysis by Equipment Type, 2018 to 2033

Figure 83: Europe Value Share (%) and BPS Analysis by Equipment Type, 2023 to 2033

Figure 84: Europe Y-o-Y Growth (%) Projections by Equipment Type, 2023 to 2033

Figure 85: Europe Value (US$ million) Analysis by Application, 2018 to 2033

Figure 86: Europe Volume (MT) Analysis by Application, 2018 to 2033

Figure 87: Europe Value Share (%) and BPS Analysis by Application, 2023 to 2033

Figure 88: Europe Y-o-Y Growth (%) Projections by Application, 2023 to 2033

Figure 89: Europe Value (US$ million) Analysis by Mode of Operation, 2018 to 2033

Figure 90: Europe Volume (MT) Analysis by Mode of Operation, 2018 to 2033

Figure 91: Europe Value Share (%) and BPS Analysis by Mode of Operation, 2023 to 2033

Figure 92: Europe Y-o-Y Growth (%) Projections by Mode of Operation, 2023 to 2033

Figure 93: Europe Attractiveness by Equipment Type, 2023 to 2033

Figure 94: Europe Attractiveness by Application, 2023 to 2033

Figure 95: Europe Attractiveness by Mode of Operation, 2023 to 2033

Figure 96: Europe Attractiveness by Country, 2023 to 2033

Figure 97: East Asia Value (US$ million) by Equipment Type, 2023 to 2033

Figure 98: East Asia Value (US$ million) by Application, 2023 to 2033

Figure 99: East Asia Value (US$ million) by Mode of Operation, 2023 to 2033

Figure 100: East Asia Value (US$ million) by Country, 2023 to 2033

Figure 101: East Asia Value (US$ million) Analysis by Country, 2018 to 2033

Figure 102: East Asia Volume (MT) Analysis by Country, 2018 to 2033

Figure 103: East Asia Value Share (%) and BPS Analysis by Country, 2023 to 2033

Figure 104: East Asia Y-o-Y Growth (%) Projections by Country, 2023 to 2033

Figure 105: East Asia Value (US$ million) Analysis by Equipment Type, 2018 to 2033

Figure 106: East Asia Volume (MT) Analysis by Equipment Type, 2018 to 2033

Figure 107: East Asia Value Share (%) and BPS Analysis by Equipment Type, 2023 to 2033

Figure 108: East Asia Y-o-Y Growth (%) Projections by Equipment Type, 2023 to 2033

Figure 109: East Asia Value (US$ million) Analysis by Application, 2018 to 2033

Figure 110: East Asia Volume (MT) Analysis by Application, 2018 to 2033

Figure 111: East Asia Value Share (%) and BPS Analysis by Application, 2023 to 2033

Figure 112: East Asia Y-o-Y Growth (%) Projections by Application, 2023 to 2033

Figure 113: East Asia Value (US$ million) Analysis by Mode of Operation, 2018 to 2033

Figure 114: East Asia Volume (MT) Analysis by Mode of Operation, 2018 to 2033

Figure 115: East Asia Value Share (%) and BPS Analysis by Mode of Operation, 2023 to 2033

Figure 116: East Asia Y-o-Y Growth (%) Projections by Mode of Operation, 2023 to 2033

Figure 117: East Asia Attractiveness by Equipment Type, 2023 to 2033

Figure 118: East Asia Attractiveness by Application, 2023 to 2033

Figure 119: East Asia Attractiveness by Mode of Operation, 2023 to 2033

Figure 120: East Asia Attractiveness by Country, 2023 to 2033

Figure 121: South Asia Value (US$ million) by Equipment Type, 2023 to 2033

Figure 122: South Asia Value (US$ million) by Application, 2023 to 2033

Figure 123: South Asia Value (US$ million) by Mode of Operation, 2023 to 2033

Figure 124: South Asia Value (US$ million) by Country, 2023 to 2033

Figure 125: South Asia Value (US$ million) Analysis by Country, 2018 to 2033

Figure 126: South Asia Volume (MT) Analysis by Country, 2018 to 2033

Figure 127: South Asia Value Share (%) and BPS Analysis by Country, 2023 to 2033

Figure 128: South Asia Y-o-Y Growth (%) Projections by Country, 2023 to 2033

Figure 129: South Asia Value (US$ million) Analysis by Equipment Type, 2018 to 2033

Figure 130: South Asia Volume (MT) Analysis by Equipment Type, 2018 to 2033

Figure 131: South Asia Value Share (%) and BPS Analysis by Equipment Type, 2023 to 2033

Figure 132: South Asia Y-o-Y Growth (%) Projections by Equipment Type, 2023 to 2033

Figure 133: South Asia Value (US$ million) Analysis by Application, 2018 to 2033

Figure 134: South Asia Volume (MT) Analysis by Application, 2018 to 2033

Figure 135: South Asia Value Share (%) and BPS Analysis by Application, 2023 to 2033

Figure 136: South Asia Y-o-Y Growth (%) Projections by Application, 2023 to 2033

Figure 137: South Asia Value (US$ million) Analysis by Mode of Operation, 2018 to 2033

Figure 138: South Asia Volume (MT) Analysis by Mode of Operation, 2018 to 2033

Figure 139: South Asia Value Share (%) and BPS Analysis by Mode of Operation, 2023 to 2033

Figure 140: South Asia Y-o-Y Growth (%) Projections by Mode of Operation, 2023 to 2033

Figure 141: South Asia Attractiveness by Equipment Type, 2023 to 2033

Figure 142: South Asia Attractiveness by Application, 2023 to 2033

Figure 143: South Asia Attractiveness by Mode of Operation, 2023 to 2033

Figure 144: South Asia Attractiveness by Country, 2023 to 2033

Figure 145: Oceania Value (US$ million) by Equipment Type, 2023 to 2033

Figure 146: Oceania Value (US$ million) by Application, 2023 to 2033

Figure 147: Oceania Value (US$ million) by Mode of Operation, 2023 to 2033

Figure 148: Oceania Value (US$ million) by Country, 2023 to 2033

Figure 149: Oceania Value (US$ million) Analysis by Country, 2018 to 2033

Figure 150: Oceania Volume (MT) Analysis by Country, 2018 to 2033

Figure 151: Oceania Value Share (%) and BPS Analysis by Country, 2023 to 2033

Figure 152: Oceania Y-o-Y Growth (%) Projections by Country, 2023 to 2033

Figure 153: Oceania Value (US$ million) Analysis by Equipment Type, 2018 to 2033

Figure 154: Oceania Volume (MT) Analysis by Equipment Type, 2018 to 2033

Figure 155: Oceania Value Share (%) and BPS Analysis by Equipment Type, 2023 to 2033

Figure 156: Oceania Y-o-Y Growth (%) Projections by Equipment Type, 2023 to 2033

Figure 157: Oceania Value (US$ million) Analysis by Application, 2018 to 2033

Figure 158: Oceania Volume (MT) Analysis by Application, 2018 to 2033

Figure 159: Oceania Value Share (%) and BPS Analysis by Application, 2023 to 2033

Figure 160: Oceania Y-o-Y Growth (%) Projections by Application, 2023 to 2033

Figure 161: Oceania Value (US$ million) Analysis by Mode of Operation, 2018 to 2033

Figure 162: Oceania Volume (MT) Analysis by Mode of Operation, 2018 to 2033

Figure 163: Oceania Value Share (%) and BPS Analysis by Mode of Operation, 2023 to 2033

Figure 164: Oceania Y-o-Y Growth (%) Projections by Mode of Operation, 2023 to 2033

Figure 165: Oceania Attractiveness by Equipment Type, 2023 to 2033

Figure 166: Oceania Attractiveness by Application, 2023 to 2033

Figure 167: Oceania Attractiveness by Mode of Operation, 2023 to 2033

Figure 168: Oceania Attractiveness by Country, 2023 to 2033

Figure 169: MEA Value (US$ million) by Equipment Type, 2023 to 2033

Figure 170: MEA Value (US$ million) by Application, 2023 to 2033

Figure 171: MEA Value (US$ million) by Mode of Operation, 2023 to 2033

Figure 172: MEA Value (US$ million) by Country, 2023 to 2033

Figure 173: MEA Value (US$ million) Analysis by Country, 2018 to 2033

Figure 174: MEA Volume (MT) Analysis by Country, 2018 to 2033

Figure 175: MEA Value Share (%) and BPS Analysis by Country, 2023 to 2033

Figure 176: MEA Y-o-Y Growth (%) Projections by Country, 2023 to 2033

Figure 177: MEA Value (US$ million) Analysis by Equipment Type, 2018 to 2033

Figure 178: MEA Volume (MT) Analysis by Equipment Type, 2018 to 2033

Figure 179: MEA Value Share (%) and BPS Analysis by Equipment Type, 2023 to 2033

Figure 180: MEA Y-o-Y Growth (%) Projections by Equipment Type, 2023 to 2033

Figure 181: MEA Value (US$ million) Analysis by Application, 2018 to 2033

Figure 182: MEA Volume (MT) Analysis by Application, 2018 to 2033

Figure 183: MEA Value Share (%) and BPS Analysis by Application, 2023 to 2033

Figure 184: MEA Y-o-Y Growth (%) Projections by Application, 2023 to 2033

Figure 185: MEA Value (US$ million) Analysis by Mode of Operation, 2018 to 2033

Figure 186: MEA Volume (MT) Analysis by Mode of Operation, 2018 to 2033

Figure 187: MEA Value Share (%) and BPS Analysis by Mode of Operation, 2023 to 2033

Figure 188: MEA Y-o-Y Growth (%) Projections by Mode of Operation, 2023 to 2033

Figure 189: MEA Attractiveness by Equipment Type, 2023 to 2033

Figure 190: MEA Attractiveness by Application, 2023 to 2033

Figure 191: MEA Attractiveness by Mode of Operation, 2023 to 2033

Figure 192: MEA Attractiveness by Country, 2023 to 2033

Frequently Asked Questions

How big is the Micro winery equipment market?

The Micro winery equipment market size is assessed to USD 1,123.3 Million in 2023.

At What Rate is Micro winery equipment market expected to rise?

The Micro winery equipment market is expected to rise at a CAGR of 5.0%.

Which are the major countries driving demand for Micro winery equipment market?

USA, China, Canada, Germany, China, India, United Kingdom, and Australia are the major countries driving demand for the Micro winery equipment market.

At what rate will the China Micro winery equipment market grow?

China Micro winery equipment market is projected to grow at a CAGR of around 5.9% over the next ten years.

What is the market share of Germany Micro winery equipment market?

Market share of Germany in Micro winery equipment market is about 21.5% of the global market.

Who are the top 5 players operating in the market?

Living Direct, Inc., La Sommeliere, The Liebherr Group, Climadi, Viking Range Corporation, Sunpentown Inc., Avintage, Climadiff S.A., Dometic Group, Electrolux AB are expected to be the top players driving the market growth.

What is the demand outlook forecast for the Micro winery equipment market?

The global Micro winery equipment market is forecasted to surpass USD 1,829.7 million by the end of 2033.

Explore Similar Insights

Future Market Insights

Micro Winery Equipment Market