Micro Perforated Films Packaging Market Size, Share, and Forecast 2025 to 2035

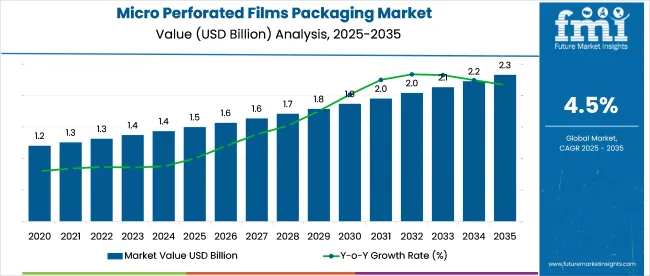
The micro perforated films packaging market is likely to grow from USD 1.58 billion in 2025 to USD 2.45 billion by 2035, at a CAGR of 4.5%. Demand has been driven by the need for breathable packaging that preserves freshness, especially for perishable and ready-to-eat products. Widely used in fruits, vegetables, and bakery packaging, micro perforated films have been adopted to extend shelf life and maintain product integrity.

Quick Stats of Micro Perforated Films Packaging Market

  • Market Value (2025): USD 1.58 billion
  • Forecast Value (2035): USD 2.45 billion
  • Market CAGR: 4.5%
  • Leading Segment in 2025: Bags & Pouches (43.2% market share)
  • Top Product Type: Polyethylene (PE) (42.6% market share)
  • Key Growth Region: India (fastest-growing market with 5.5% CAGR)
  • Key Players: Amcor Limited, UFlex Limited, Mondi Group

Micro Perforated Films Packaging Market

Key Micro Perforated Films Packaging Market Highlights

The micro perforated films packaging market is projected to grow at a CAGR of 4.5% from 2025 to 2035. Bags and pouches are expected to lead, capturing 43.2% market share by 2025, driven by fresh produce, bakery, and snack packaging demand.

Polyethylene (PE) will dominate product types with a 42.6% share, known for its flexibility and cost-efficiency. India is projected as the fastest-growing market, with a CAGR of 5.5%, fueled by rising packaged food demand. Companies like Amcor and Mondi are driving innovation in the sector, focusing on compostable and recyclable packaging solutions.

The micro perforated films packaging market holds varying shares across its parent markets, primarily driven by demand in food packaging and breathable solutions. It accounts for approximately 4.7% of the global flexible packaging market, 3.8% of the plastic films market, and 6.2% of the food packaging market, where its ability to balance gas exchange is crucial.

Within the breathable packaging segment, it represents a significant 8.5%, reflecting its strong adoption in fresh produce and bakery applications. In the modified atmosphere packaging (MAP) market, it contributes roughly 5.1%, offering cost-effective perforation solutions for short-shelf-life items. These figures highlight how micro perforated films serve as a niche yet essential sub-segment across multiple packaging domains focused on food safety, freshness, and quality.

Jim Kelly, Co-owner and Executive Vice President of Emerald Packaging, emphasized the evolution of the company’s innovation focus, stating that the initial challenge was to engineer packaging that could breathe in harmony with the respiration rate of the produce-an essential factor in maintaining freshness across supply chains.

Reflecting on the industry’s shift, he noted that post-consumer recycled (PCR) materials now represent the next frontier. According to Kelly, PCR is not only central to Emerald Packaging’s future but also pivotal for the entire packaging sector, as it offers a practical solution that addresses environmental concerns while ensuring the freshness and longevity required by the produce industry.

Analyzing Micro Perforated Films Packaging Market by Top Investment Segments

The micro perforated films packaging market is being shaped by rising demand for moisture-regulating and breathable packaging across perishable and fast-moving consumer goods. Innovation in materials, speed-efficient technologies, and food-grade compliance is driving segment-wise investments.

Flexible Pouch Formats Take the Lead in Modern Packaging

Bags and pouches are projected to account for 43.2% of the total material format share by 2025.

  • Rising demand across fresh produce, bakery, and snack segments has been a key factor behind the growing preference for micro perforated packaging formats.
  • Improved air exchange through micro perforations in pouches has enabled better product integrity while preserving structural strength across the supply chain.
  • Roll-fed film compatibility and lightweight design formats are being integrated into high-speed, automated packaging operations to increase throughput.
  • Perforation density is being tailored by manufacturers to suit individual product respiration profiles, minimizing spoilage while maximizing shelf life.

Micro Perforated Films Packaging Market Analysis By Modern Packaging

Polyethylene Films Dominate Due to Versatility and Performance

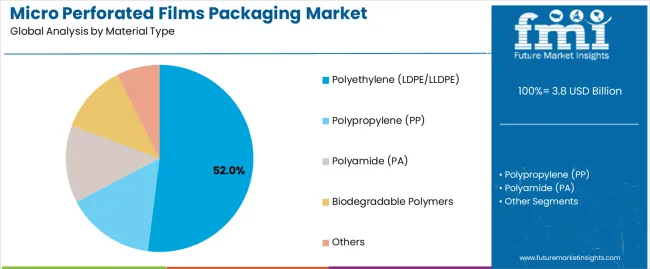
Polyethylene is projected to capture 42.6% of the product-type segment by 2025, positioning it as the most utilized material in micro perforated films packaging.

  • Variants including LDPE, HDPE, and LLDPE are being selected for their superior flexibility, tensile strength, and cost-efficient performance across packaging operations.
  • These polyethylene films are supporting both food and industrial applications where a balance between seal integrity and breathability is essential.
  • A broad sealing temperature range of polyethylene is allowing compatibility with diverse machinery setups while enhancing overall process reliability.
  • Modified polyethylene films featuring anti-fog and UV protection layers are being integrated to maintain clarity in chilled environments and fresh produce displays.

Micro Perforated Films Packaging Market Analysis By Versatility And Performance

Mechanical Perforation Emerges as Cost-Effective Technology Champion

Mechanical perforation is expected to dominate the technology segment with a projected market share of 56.1% by 2025.

  • Mechanical perforation is being favored for its low setup costs, inline integration capabilities, and efficiency across diverse polymer films at high production speeds.
  • Pin roller and rotary drum technologies are being implemented on extrusion and converting lines to enable precise control over hole size and spacing.
  • Moisture regulation for packaged foods is being optimized through adjustable perforation patterns suited to specific category requirements.
  • Low energy consumption and minimal maintenance needs are driving adoption in both developed markets and cost-sensitive emerging regions.

Micro Perforated Films Packaging Market Analysis By Technology

Food Sector Drives Bulk of Packaging Film Demand

The food industry is projected to hold 68.4% of the end-use segment share in 2025, making it the dominant consumer of micro perforated films.

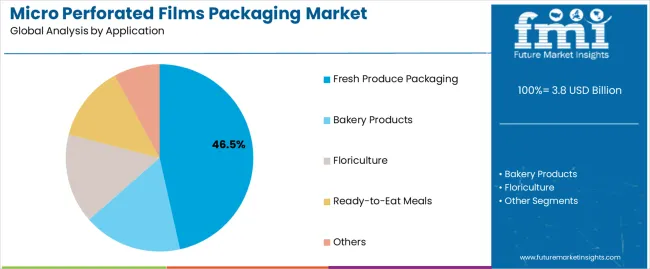
  • Intensified adoption in fruit, vegetable, and bakery packaging is being observed as retailers focus on maintaining freshness, visibility, and extended shelf appeal.
  • Perforated films are enabling ambient respiration in products like salads, herbs, and berries while effectively mitigating condensation-related quality issues.
  • In bakery and snack segments, airflow control through perforation is supporting texture retention and reducing the risk of mold and microbial contamination.
  • Regional food safety regulations are being met through the use of traceable materials and additives compliant with direct food contact standards.

Micro Perforated Films Packaging Market Analysis By End Use

Top Micro Perforated Films Packaging Market Dynamics

The market is driven by the need for extended shelf life and moisture control in food packaging, with innovations in perforation technologies, compostable films, and integration with smart packaging driving momentum globally.

Recent innovations and trends reshape the micro perforated films market

  • Laser micro-perforation technology is being adopted to achieve precise breathability in fresh produce packaging.
  • Biodegradable and compostable perforated films are gaining traction in bakery and organic food segments.
  • Companies like Amcor and Mondi are introducing recyclable micro-perforated films for retail pouches.
  • Intelligent packaging solutions integrating humidity sensors with perforated layers are being piloted.
  • Multi-layer PE/PP films with customized hole patterns are replacing traditional mono-materials for high-performance applications.

Rising production costs and film compatibility pose market challenges

  • Fluctuations in polymer prices affect cost-efficiency of multilayer films.
  • Compatibility issues with automated sealing and cutting equipment.
  • Limited recyclability of complex film structures with perforation zones.

Analyzing Top Countries Formulating, Distributing, and Supplying Micro Perforated Films Packaging

Country Wise Analysis Of Micro Perforated Films Packaging Market Cagr 2025 To 2035

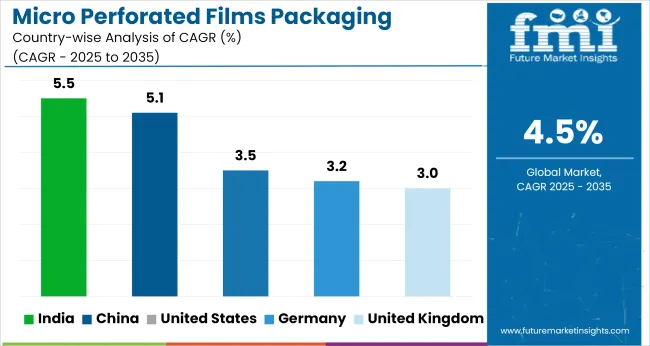
Countries Projected CAGR (2025 to 2035)
United States 3.5%
United Kingdom 3.0%
Germany 3.2%
China 5.1%
India 5.5%

The micro perforated films packaging market is poised for significant growth across key regions, particularly within ASEAN and OECD countries. Within the OECD, nations like the United States, Germany, and the United Kingdom are expected to witness moderate growth, with projected CAGRs of 3.5%, 3.2%, and 3.0%, respectively, from 2025 to 2035.

These countries continue to drive demand through advanced packaging technologies and growing food safety regulations. In contrast, the ASEAN region, including China and India, is experiencing more dynamic growth, with projected CAGRs of 5.1% and 5.5%, respectively.

This surge is attributed to increasing demand for fresh produce, urbanization, and a shift toward more sustainable and breathable packaging solutions. As micro perforated films continue to provide a cost-effective, environmentally-friendly option for food packaging, both OECD and ASEAN regions are set to contribute to the global expansion, catering to the evolving needs of the food and packaging industries.

An Overview of USA Micro Perforated Films Packaging Market Growth

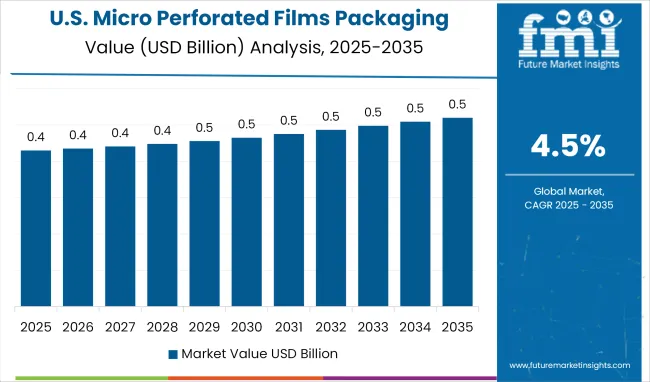
The United States micro perforated films packaging market, projected to grow at a CAGR of 3.5% between 2025 and 2035, is bolstered by strong demand in packaged bakery, produce, and convenience food segments.

  • Film breathability and environmental compliance have been prioritized by manufacturers to align with evolving packaging requirements and improve product performance.
  • Automated packaging lines and demand for materials that ensure product freshness while meeting regulations have accelerated micro perforated films market growth.
  • Strong logistics and cold chain infrastructure in the USA have supported widespread integration of micro perforated films, reinforcing the country’s global market influence.

UK Micro Perforated Films Packaging Market Analysis and Growth

The United Kingdom micro perforated films packaging market, expanding at a CAGR of 3.0%, is shaped by trends in clean-label food products and rising demand for fresh-cut produce packaging.

  • Perforated film technology has been extensively applied in fruits, vegetables, and bakery segments to retain moisture balance and enhance visual presentation.
  • Regulatory changes promoting eco-friendly packaging and waste reduction have encouraged investment in recyclable and compostable film alternatives.
  • Laser perforation techniques have been adopted by domestic packaging converters in the UK to ensure precision, supporting retailer demand for shelf-ready packaging with longer shelf life and minimized spoilage.

In-Depth Analysis of Germany Micro Perforated Films Packaging Market

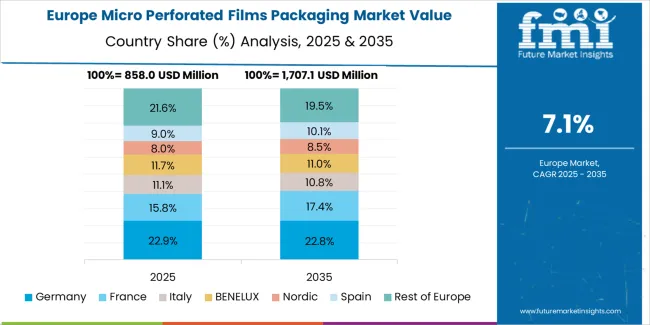
Germany’s micro perforated films packaging market is growing at a 3.2% CAGR, driven by consumer demand for fresh food solutions and government emphasis on sustainability.

  • Engineering excellence in the country has enabled high-precision micro perforation, ensuring efficient gas exchange and preservation of product quality.
  • Applications in meat, cheese, and pre-cut produce have expanded rapidly, especially within urban retail distribution models.
  • German packaging companies have prioritized eco-design and recyclable materials to align with EU environmental regulations, strengthening the role of micro perforated films in premium, safety-oriented food packaging solutions.

China Micro Perforated Films Packaging Market Growth Analysis

China's micro perforated films packaging market, with a robust 5.1% CAGR, reflects the country's expanding food processing industry and urban consumption trends.

  • Sharp growth in packaged fruits, vegetables, and bakery items has been driven by shifting dietary preferences and widespread retail modernization across urban regions.
  • Local manufacturers have invested in high-speed perforation systems and barrier-enhanced films to improve shelf life and packaging performance.
  • Bio-based micro perforated alternatives have been developed under Healthy China 2030 incentives, while e-commerce grocery platforms and industrial-scale logistics have strengthened China’s global market position.

India Micro Perforated Films Packaging Market Analysis and Growth

India’s micro perforated films packaging market leads global growth with a 5.5% CAGR, driven by rapid developments in agriculture-based packaging and rising urban food consumption.

  • Demand for packaged fruits, vegetables, and bakery items is driving the expansion of production, with a focus on affordable, biodegradable film options.
  • Government initiatives aimed at modernizing food logistics and enhancing cold chain infrastructure are broadening the market’s reach.
  • India’s growing retail sector and rising demand for hygienic, visually appealing packaging contribute significantly to market growth.
  • Investment in cost-effective micro perforation technologies by local firms is increasing domestic consumption and boosting export opportunities in fresh food packaging.

Leading Micro Perforated Films Packaging Suppliers

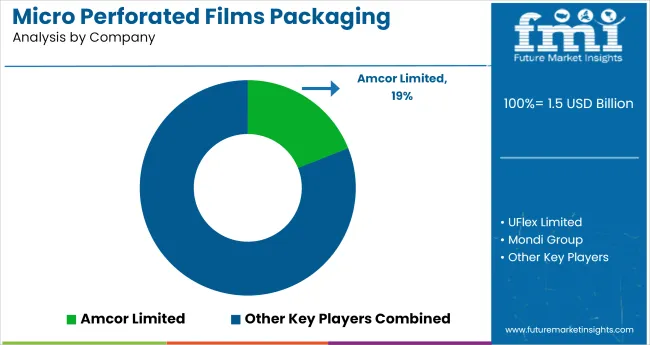
The micro perforated films packaging market features a mix of consolidated and fragmented players. Companies like Amcor Limited and Berry Global dominate the global landscape, leveraging advanced R&D, wide distribution networks, and proprietary laser perforation technologies.

Amcor’s recent launch of ultra-fine perforation films optimized for bakery and produce packaging reflects its innovation focus, while Berry Global has enhanced its product lines through acquisition-driven expansion. UFlex Limited and Mondi Group are also investing in bio-based films and recyclable materials to meet changing regulatory standards and customer preferences.

Emerging players such as KOROZO and Darnel Group are increasingly making headway through regional supply advantages and specialized offerings, especially in Latin America and Eastern Europe. The market entry barriers remain moderately high due to technology investment needs and compliance with food safety and environmental regulations.

However, niche suppliers like Coveris and Bollore Group are capturing market share through flexible production capabilities and focus on perishable food applications. The competitive environment is being shaped by innovation, material science, and strategic partnerships across the value chain.

Recent Micro Perforated Films Packaging Industry News

Amcor finalized its acquisition of Berry Global in April 2025, creating one of the largest packaging conglomerates globally with enhanced R&D capacity and expanded geographic reach. The merger is expected to streamline operations and improve innovation in micro perforated film technologies.

Report Scope Table - Micro Perforated Films Packaging Market

Report Attributes Details
Market Size (2024) USD 1.51 billion
Current Total Market Size (2025) USD 1.58 billion
Projected Market Size (2035) USD 2.45 billion
CAGR (2025 to 2035) 4.5%
Base Year for Estimation 2024
Historical Period 2020 to 2024
Projections Period 2025 to 2035
Quantitative Units USD million for value and thousand tons for volume
Materials Analyzed (Segment 1) Bags and Pouches, Wraps, Lidding Film, Shrink Film, Liners
Product Types Analyzed (Segment 2) Polyethylene (PE: LDPE, HDPE, LLDPE), Polypropylene (PP), Polyvinyl Chloride (PVC), Polystyrene, Polyethylene Terephthalate (PET), Polylactic Acid (PLA)
Technologies Analyzed (Segment 3) Mechanical Perforation, Laser Perforation
End Uses Analyzed (Segment 4) Food (Meat, Poultry & Seafood, Fruits & Vegetables, Bakery & Confectionary, Baby Food, Pet Food, Ready to Eat, Snacks, Other Food Products), Non-Food (Medical & Pharmaceutical, Agriculture, Textile, Other Industrial)
Regions Covered North America; Latin America; Western Europe; Eastern Europe; South Asia and Pacific; East Asia; Middle East & Africa
Countries Covered United States, Canada, Mexico, Brazil, Argentina, Germany, France, United Kingdom, Italy, Spain, Netherlands, China, India, Japan, South Korea, ANZ, GCC Countries, South Africa
Key Players influencing the Micro Perforated Films Packaging Market Amcor Limited, UFlex Limited, Mondi Group, Sealed Air Corporation, Berry Global, Coveris, Bollore Group, KOROZO, Darnel Group, Coveris Holdings SA, Flextrus, Innovia Films
Additional Attributes Sales by food application (fruits & vegetables, bakery, RTE), Performance of laser vs mechanical perforation technology, Adoption of compostable PLA variants, Sustainability trends driving demand for PE & PET perforated films, Packaging innovations for breathable, shelf-life-extending films

Leading Players

  • Amcor Limited
  • UFlex Limited
  • Mondi Group
  • Sealed Air Corporation
  • Berry Global
  • Coveris
  • Bollore Group
  • KOROZO
  • Darnel Group
  • Coveris Holdings SA

Micro Perforated Films Packaging Market Analyzed by Key Investment Segments

By Material:

In terms of material type, the micro perforated films packaging market is divided into bags and pouches, wraps, lidding film, shrink film, and liners.

By Product:

In terms of product type, the micro perforated films packaging market is segmented into polyethylene (PE), polypropylene (PP), polyvinyl chloride (PVC), polystyrene, polyethylene terephthalate (PET), and polylactic acid (PLA). Polyethylene is further categorized into Low-Density Polyethylene (LDPE), High-Density Polyethylene (HDPE), and Linear Low-Density Polyethylene (LLDPE).

By Technology:

In terms of technology, the micro perforated films packaging market is classified into mechanical perforation and laser perforation.

By End Use:

The major end users of micro perforated films packaging include both food and non-food sectors. The food segment is further divided into meat, poultry & seafood, fruits & vegetables, bakery & confectionery, baby food, pet food, ready-to-eat meals, snacks, and other food products. The non-food segment includes medical & pharmaceutical, agriculture, textile, and other industrial applications.

By Region:

Key regions covered include North America, Latin America, East Asia, South Asia & Pacific, Western Europe, Eastern Europe, and the Middle East & Africa.

Table of Content

  1. Executive Summary
    • Global Market Outlook
    • Demand-side Trends
    • Supply-side Trends
    • Technology Roadmap Analysis
    • Analysis and Recommendations
  2. Market Overview
    • Market Coverage / Taxonomy
    • Market Definition / Scope / Limitations
  3. Market Background
    • Market Dynamics
      • Drivers
      • Restraints
      • Opportunity
      • Trends
    • Scenario Forecast
      • Demand in Optimistic Scenario
      • Demand in Likely Scenario
      • Demand in Conservative Scenario
    • Opportunity Map Analysis
    • Product Life Cycle Analysis
    • Supply Chain Analysis
      • Supply Side Participants and their Roles
        • Producers
        • Mid-Level Participants (Traders/ Agents/ Brokers)
        • Wholesalers and Distributors
      • Value Added and Value Created at Node in the Supply Chain
      • List of Raw Material Suppliers
      • List of Existing and Potential Buyer’s
    • Investment Feasibility Matrix
    • Value Chain Analysis
      • Profit Margin Analysis
      • Wholesalers and Distributors
      • Retailers
    • PESTLE and Porter’s Analysis
    • Regulatory Landscape
      • By Key Regions
      • By Key Countries
    • Regional Parent Market Outlook
    • Production and Consumption Statistics
    • Import and Export Statistics
  4. Global Market Analysis 2020 to 2024 and Forecast, 2025 to 2035
    • Historical Market Size Value (USD Billion) & Metric Ton (MT) Analysis, 2020 to 2024
    • Current and Future Market Size Value (USD Billion) & Metric Ton (MT) Projections, 2025 to 2035
      • Y-o-Y Growth Trend Analysis
      • Absolute $ Opportunity Analysis
  5. Global Market Pricing Analysis 2020 to 2024 and Forecast 2025 to 2035
  6. Global Market Analysis 2020 to 2024 and Forecast 2025 to 2035, By Material
    • Introduction / Key Findings
    • Historical Market Size Value (USD Billion) & Metric Ton (MT) Analysis By Material, 2020 to 2024
    • Current and Future Market Size Value (USD Billion) & Metric Ton (MT) Analysis and Forecast By Material, 2025 to 2035
      • Bags and pouches
      • Wraps
      • Lidding film
      • Shrink film
      • Liners
    • Y-o-Y Growth Trend Analysis By Material, 2020 to 2024
    • Absolute $ Opportunity Analysis By Material, 2025 to 2035
  7. Global Market Analysis 2020 to 2024 and Forecast 2025 to 2035, By Product
    • Introduction / Key Findings
    • Historical Market Size Value (USD Billion) & Metric Ton (MT) Analysis By Product, 2020 to 2024
    • Current and Future Market Size Value (USD Billion) & Metric Ton (MT) Analysis and Forecast By Product, 2025 to 2035
      • Polyethylene (PE)
        • Low-Density Polyethylene (LDPE)
        • High-Density Polyethylene (HDPE)
        • Linear Low-Density Polyethylene (LLDPE)
      • Polypropylene (PP)
      • Polyvinyl Chloride (PVC)
      • Polystyrene
      • Polyethylene Terephthalate (PET)
      • Polylactic Acid (PLA)
    • Y-o-Y Growth Trend Analysis By Product, 2020 to 2024
    • Absolute $ Opportunity Analysis By Product, 2025 to 2035
  8. Global Market Analysis 2020 to 2024 and Forecast 2025 to 2035, By End-use Industry
    • Introduction / Key Findings
    • Historical Market Size Value (USD Billion) & Metric Ton (MT) Analysis By End-use Industry, 2020 to 2024
    • Current and Future Market Size Value (USD Billion) & Metric Ton (MT) Analysis and Forecast By End-use Industry, 2025 to 2035
      • Aerospace & Defense
      • Automotive
      • Construction
      • Electronics
      • Energy & Power
      • Others
    • Y-o-Y Growth Trend Analysis By End-use Industry, 2020 to 2024
    • Absolute $ Opportunity Analysis By End-use Industry, 2025 to 2035
  9. Global Market Analysis 2020 to 2024 and Forecast 2025 to 2035, By Technology
    • Introduction / Key Findings
    • Historical Market Size Value (USD Billion) & Metric Ton (MT) Analysis By Technology, 2020 to 2024
    • Current and Future Market Size Value (USD Billion) & Metric Ton (MT) Analysis and Forecast By Technology, 2025 to 2035
      • Mechanical perforation
      • Laser perforation
    • Y-o-Y Growth Trend Analysis By Technology, 2020 to 2024
    • Absolute $ Opportunity Analysis By Technology, 2025 to 2035
  10. Global Market Analysis 2020 to 2024 and Forecast 2025 to 2035, By End Use
    • Introduction / Key Findings
    • Historical Market Size Value (USD Billion) & Metric Ton (MT) Analysis By End Use, 2020 to 2024
    • Current and Future Market Size Value (USD Billion) & Metric Ton (MT) Analysis and Forecast By End Use, 2025 to 2035
      • Food Sector
        • Meat, poultry & seafood
        • Fruits & vegetables
        • Bakery & confectionery
        • Baby food
        • Pet food
        • Ready-to-eat meals
        • Snacks
        • Other food products
      • Non-Food Sector
        • Medical & pharmaceutical
        • Agriculture
        • Textile
        • Other industrial applications
    • Y-o-Y Growth Trend Analysis By End Use, 2020 to 2024
    • Absolute $ Opportunity Analysis By End Use, 2025 to 2035
  11. Global Market Analysis 2020 to 2024 and Forecast 2025 to 2035, By Region
    • Introduction
    • Historical Market Size Value (USD Billion) & Metric Ton (MT) Analysis By Region, 2020 to 2024
    • Current Market Size Value (USD Billion) & Metric Ton (MT) Analysis and Forecast By Region, 2025 to 2035
      • North America
      • Latin America
      • Western Europe
      • Eastern Europe
      • East Asia
      • South Asia & Pacific
      • Middle East and Africa
    • Market Attractiveness Analysis By Region
  12. North America Market Analysis 2020 to 2024 and Forecast 2025 to 2035, By Country
    • Historical Market Size Value (USD Billion) & Metric Ton (MT) Trend Analysis By Market Taxonomy, 2020 to 2024
    • Market Size Value (USD Billion) & Metric Ton (MT) Forecast By Market Taxonomy, 2025 to 2035
      • By Country
        • USA
        • Canada
        • Mexico
      • By Material
      • By Product
      • By End-use Industry
      • By Technology
      • By End Use
    • Market Attractiveness Analysis
      • By Country
      • By Material
      • By Product
      • By End-use Industry
      • By Technology
      • By End Use
    • Key Takeaways
  13. Latin America Market Analysis 2020 to 2024 and Forecast 2025 to 2035, By Country
    • Historical Market Size Value (USD Billion) & Metric Ton (MT) Trend Analysis By Market Taxonomy, 2020 to 2024
    • Market Size Value (USD Billion) & Metric Ton (MT) Forecast By Market Taxonomy, 2025 to 2035
      • By Country
        • Brazil
        • Argentina
        • Rest of LATAM
      • By Material
      • By Product
      • By End-use Industry
      • By Technology
      • By End Use
    • Market Attractiveness Analysis
      • By Country
      • By Material
      • By Product
      • By End-use Industry
      • By Technology
      • By End Use
    • Key Takeaways
  14. Western Europe Market Analysis 2020 to 2024 and Forecast 2025 to 2035, By Country
    • Historical Market Size Value (USD Billion) & Metric Ton (MT) Trend Analysis By Market Taxonomy, 2020 to 2024
    • Market Size Value (USD Billion) & Metric Ton (MT) Forecast By Market Taxonomy, 2025 to 2035
      • By Country
        • Germany
        • Italy
        • France
        • UK
        • Spain
        • BENELUX
        • Nordic
        • Rest of W.Europe
      • By Material
      • By Product
      • By End-use Industry
      • By Technology
      • By End Use
    • Market Attractiveness Analysis
      • By Country
      • By Material
      • By Product
      • By End-use Industry
      • By Technology
      • By End Use
    • Key Takeaways
  15. Eastern Europe Market Analysis 2020 to 2024 and Forecast 2025 to 2035, By Country
    • Historical Market Size Value (USD Billion) & Metric Ton (MT) Trend Analysis By Market Taxonomy, 2020 to 2024
    • Market Size Value (USD Billion) & Metric Ton (MT) Forecast By Market Taxonomy, 2025 to 2035
      • By Country
        • Russia
        • Hungary
        • Poland
        • Balkan & Baltics
        • Rest of E. Europe
      • By Material
      • By Product
      • By End-use Industry
      • By Technology
      • By End Use
    • Market Attractiveness Analysis
      • By Country
      • By Material
      • By Product
      • By End-use Industry
      • By Technology
      • By End Use
    • Key Takeaways
  16. East Asia Market Analysis 2020 to 2024 and Forecast 2025 to 2035, By Country
    • Historical Market Size Value (USD Billion) & Metric Ton (MT) Trend Analysis By Market Taxonomy, 2020 to 2024
    • Market Size Value (USD Billion) & Metric Ton (MT) Forecast By Market Taxonomy, 2025 to 2035
      • By Country
        • China
        • Japan
        • South Korea
      • By Material
      • By Product
      • By End-use Industry
      • By Technology
      • By End Use
    • Market Attractiveness Analysis
      • By Country
      • By Material
      • By Product
      • By End-use Industry
      • By Technology
      • By End Use
    • Key Takeaways
  17. South Asia & Pacific Market Analysis 2020 to 2024 and Forecast 2025 to 2035, By Country
    • Historical Market Size Value (USD Billion) & Metric Ton (MT) Trend Analysis By Market Taxonomy, 2020 to 2024
    • Market Size Value (USD Billion) & Metric Ton (MT) Forecast By Market Taxonomy, 2025 to 2035
      • By Country
        • India
        • Australia & New Zealand
        • ASEAN
        • Rest of SAP
      • By Material
      • By Product
      • By End-use Industry
      • By Technology
      • By End Use
    • Market Attractiveness Analysis
      • By Country
      • By Material
      • By Product
      • By End-use Industry
      • By Technology
      • By End Use
    • Key Takeaways
  18. Middle East and Africa Market Analysis 2020 to 2024 and Forecast 2025 to 2035, By Country
    • Historical Market Size Value (USD Billion) & Metric Ton (MT) Trend Analysis By Market Taxonomy, 2020 to 2024
    • Market Size Value (USD Billion) & Metric Ton (MT) Forecast By Market Taxonomy, 2025 to 2035
      • By Country
        • GCC Countries
        • Northern Africa
        • South Africa
        • Turkiye
        • Rest of MEA
      • By Material
      • By Product
      • By End-use Industry
      • By Technology
      • By End Use
    • Market Attractiveness Analysis
      • By Country
      • By Material
      • By Product
      • By End-use Industry
      • By Technology
      • By End Use
    • Key Takeaways
  19. Key Countries Market Analysis
    • USA
      • Pricing Analysis
      • Market Share Analysis, 2024
        • By Material
        • By Product
        • By End-use Industry
        • By Technology
        • By End Use
    • Canada
      • Pricing Analysis
      • Market Share Analysis, 2024
        • By Material
        • By Product
        • By End-use Industry
        • By Technology
        • By End Use
    • Brazil
      • Pricing Analysis
      • Market Share Analysis, 2024
        • By Material
        • By Product
        • By End-use Industry
        • By Technology
        • By End Use
    • Mexico
      • Pricing Analysis
      • Market Share Analysis, 2024
        • By Material
        • By Product
        • By End-use Industry
        • By Technology
        • By End Use
    • Argentina
      • Pricing Analysis
      • Market Share Analysis, 2024
        • By Material
        • By Product
        • By End-use Industry
        • By Technology
        • By End Use
  20. Market Structure Analysis
    • Competition Dashboard
    • Competition Benchmarking
    • Market Share Analysis of Top Players
      • By Regional
      • By Material
      • By Product
      • By End-use Industry
      • By Technology
      • By End Use
  21. Competition Analysis
    • Competition Deep Dive
      • Stryker Corporation
        • Overview
        • Product Portfolio
        • Profitability by Market Segments (Product/Age /Sales Channel/Region)
        • Sales Footprint
        • Strategy Overview
          • Marketing Strategy
          • Product Strategy
          • Channel Strategy
      • Hill-Rom Holdings, Inc
        • Overview
        • Product Portfolio
        • Profitability by Market Segments (Product/Age /Sales Channel/Region)
        • Sales Footprint
        • Strategy Overview
          • Marketing Strategy
          • Product Strategy
          • Channel Strategy
      • Getinge AB
        • Overview
        • Product Portfolio
        • Profitability by Market Segments (Product/Age /Sales Channel/Region)
        • Sales Footprint
        • Strategy Overview
          • Marketing Strategy
          • Product Strategy
          • Channel Strategy
      • Invacare Corporation
        • Overview
        • Product Portfolio
        • Profitability by Market Segments (Product/Age /Sales Channel/Region)
        • Sales Footprint
        • Strategy Overview
          • Marketing Strategy
          • Product Strategy
          • Channel Strategy
      • Amico Corporation
        • Overview
        • Product Portfolio
        • Profitability by Market Segments (Product/Age /Sales Channel/Region)
        • Sales Footprint
        • Strategy Overview
          • Marketing Strategy
          • Product Strategy
          • Channel Strategy
  22. Assumptions & Acronyms Used
  23. Research Methodology

List of Tables

  • Table 1: Global Market Value (USD Billion) Forecast by Region, 2020 to 2035
  • Table 2: Global Market Metric Ton (MT) Forecast by Region, 2020 to 2035
  • Table 3: Global Market Value (USD Billion) Forecast by Material, 2020 to 2035
  • Table 4: Global Market Metric Ton (MT) Forecast by Material, 2020 to 2035
  • Table 5: Global Market Value (USD Billion) Forecast by Product, 2020 to 2035
  • Table 6: Global Market Metric Ton (MT) Forecast by Product, 2020 to 2035
  • Table 7: Global Market Value (USD Billion) Forecast by End-use Industry, 2020 to 2035
  • Table 8: Global Market Metric Ton (MT) Forecast by End-use Industry, 2020 to 2035
  • Table 9: Global Market Value (USD Billion) Forecast by Technology, 2020 to 2035
  • Table 10: Global Market Metric Ton (MT) Forecast by Technology, 2020 to 2035
  • Table 11: Global Market Value (USD Billion) Forecast by End Use, 2020 to 2035
  • Table 12: Global Market Metric Ton (MT) Forecast by End Use, 2020 to 2035
  • Table 13: North America Market Value (USD Billion) Forecast by Country, 2020 to 2035
  • Table 14: North America Market Metric Ton (MT) Forecast by Country, 2020 to 2035
  • Table 15: North America Market Value (USD Billion) Forecast by Material, 2020 to 2035
  • Table 16: North America Market Metric Ton (MT) Forecast by Material, 2020 to 2035
  • Table 17: North America Market Value (USD Billion) Forecast by Product, 2020 to 2035
  • Table 18: North America Market Metric Ton (MT) Forecast by Product, 2020 to 2035
  • Table 19: North America Market Value (USD Billion) Forecast by End-use Industry, 2020 to 2035
  • Table 20: North America Market Metric Ton (MT) Forecast by End-use Industry, 2020 to 2035
  • Table 21: North America Market Value (USD Billion) Forecast by Technology, 2020 to 2035
  • Table 22: North America Market Metric Ton (MT) Forecast by Technology, 2020 to 2035
  • Table 23: North America Market Value (USD Billion) Forecast by End Use, 2020 to 2035
  • Table 24: North America Market Metric Ton (MT) Forecast by End Use, 2020 to 2035
  • Table 25: Latin America Market Value (USD Billion) Forecast by Country, 2020 to 2035
  • Table 26: Latin America Market Metric Ton (MT) Forecast by Country, 2020 to 2035
  • Table 27: Latin America Market Value (USD Billion) Forecast by Material, 2020 to 2035
  • Table 28: Latin America Market Metric Ton (MT) Forecast by Material, 2020 to 2035
  • Table 29: Latin America Market Value (USD Billion) Forecast by Product, 2020 to 2035
  • Table 30: Latin America Market Metric Ton (MT) Forecast by Product, 2020 to 2035
  • Table 31: Latin America Market Value (USD Billion) Forecast by End-use Industry, 2020 to 2035
  • Table 32: Latin America Market Metric Ton (MT) Forecast by End-use Industry, 2020 to 2035
  • Table 33: Latin America Market Value (USD Billion) Forecast by Technology, 2020 to 2035
  • Table 34: Latin America Market Metric Ton (MT) Forecast by Technology, 2020 to 2035
  • Table 35: Latin America Market Value (USD Billion) Forecast by End Use, 2020 to 2035
  • Table 36: Latin America Market Metric Ton (MT) Forecast by End Use, 2020 to 2035
  • Table 37: Western Europe Market Value (USD Billion) Forecast by Country, 2020 to 2035
  • Table 38: Western Europe Market Metric Ton (MT) Forecast by Country, 2020 to 2035
  • Table 39: Western Europe Market Value (USD Billion) Forecast by Material, 2020 to 2035
  • Table 40: Western Europe Market Metric Ton (MT) Forecast by Material, 2020 to 2035
  • Table 41: Western Europe Market Value (USD Billion) Forecast by Product, 2020 to 2035
  • Table 42: Western Europe Market Metric Ton (MT) Forecast by Product, 2020 to 2035
  • Table 43: Western Europe Market Value (USD Billion) Forecast by End-use Industry, 2020 to 2035
  • Table 44: Western Europe Market Metric Ton (MT) Forecast by End-use Industry, 2020 to 2035
  • Table 45: Western Europe Market Value (USD Billion) Forecast by Technology, 2020 to 2035
  • Table 46: Western Europe Market Metric Ton (MT) Forecast by Technology, 2020 to 2035
  • Table 47: Western Europe Market Value (USD Billion) Forecast by End Use, 2020 to 2035
  • Table 48: Western Europe Market Metric Ton (MT) Forecast by End Use, 2020 to 2035
  • Table 49: Eastern Europe Market Value (USD Billion) Forecast by Country, 2020 to 2035
  • Table 50: Eastern Europe Market Metric Ton (MT) Forecast by Country, 2020 to 2035
  • Table 51: Eastern Europe Market Value (USD Billion) Forecast by Material, 2020 to 2035
  • Table 52: Eastern Europe Market Metric Ton (MT) Forecast by Material, 2020 to 2035
  • Table 53: Eastern Europe Market Value (USD Billion) Forecast by Product, 2020 to 2035
  • Table 54: Eastern Europe Market Metric Ton (MT) Forecast by Product, 2020 to 2035
  • Table 55: Eastern Europe Market Value (USD Billion) Forecast by End-use Industry, 2020 to 2035
  • Table 56: Eastern Europe Market Metric Ton (MT) Forecast by End-use Industry, 2020 to 2035
  • Table 57: Eastern Europe Market Value (USD Billion) Forecast by Technology, 2020 to 2035
  • Table 58: Eastern Europe Market Metric Ton (MT) Forecast by Technology, 2020 to 2035
  • Table 59: Eastern Europe Market Value (USD Billion) Forecast by End Use, 2020 to 2035
  • Table 60: Eastern Europe Market Metric Ton (MT) Forecast by End Use, 2020 to 2035
  • Table 61: East Asia Market Value (USD Billion) Forecast by Country, 2020 to 2035
  • Table 62: East Asia Market Metric Ton (MT) Forecast by Country, 2020 to 2035
  • Table 63: East Asia Market Value (USD Billion) Forecast by Material, 2020 to 2035
  • Table 64: East Asia Market Metric Ton (MT) Forecast by Material, 2020 to 2035
  • Table 65: East Asia Market Value (USD Billion) Forecast by Product, 2020 to 2035
  • Table 66: East Asia Market Metric Ton (MT) Forecast by Product, 2020 to 2035
  • Table 67: East Asia Market Value (USD Billion) Forecast by End-use Industry, 2020 to 2035
  • Table 68: East Asia Market Metric Ton (MT) Forecast by End-use Industry, 2020 to 2035
  • Table 69: East Asia Market Value (USD Billion) Forecast by Technology, 2020 to 2035
  • Table 70: East Asia Market Metric Ton (MT) Forecast by Technology, 2020 to 2035
  • Table 71: East Asia Market Value (USD Billion) Forecast by End Use, 2020 to 2035
  • Table 72: East Asia Market Metric Ton (MT) Forecast by End Use, 2020 to 2035
  • Table 73: South Asia & Pacific Market Value (USD Billion) Forecast by Country, 2020 to 2035
  • Table 74: South Asia & Pacific Market Metric Ton (MT) Forecast by Country, 2020 to 2035
  • Table 75: South Asia & Pacific Market Value (USD Billion) Forecast by Material, 2020 to 2035
  • Table 76: South Asia & Pacific Market Metric Ton (MT) Forecast by Material, 2020 to 2035
  • Table 77: South Asia & Pacific Market Value (USD Billion) Forecast by Product, 2020 to 2035
  • Table 78: South Asia & Pacific Market Metric Ton (MT) Forecast by Product, 2020 to 2035
  • Table 79: South Asia & Pacific Market Value (USD Billion) Forecast by End-use Industry, 2020 to 2035
  • Table 80: South Asia & Pacific Market Metric Ton (MT) Forecast by End-use Industry, 2020 to 2035
  • Table 81: South Asia & Pacific Market Value (USD Billion) Forecast by Technology, 2020 to 2035
  • Table 82: South Asia & Pacific Market Metric Ton (MT) Forecast by Technology, 2020 to 2035
  • Table 83: South Asia & Pacific Market Value (USD Billion) Forecast by End Use, 2020 to 2035
  • Table 84: South Asia & Pacific Market Metric Ton (MT) Forecast by End Use, 2020 to 2035
  • Table 85: Middle East and Africa Market Value (USD Billion) Forecast by Country, 2020 to 2035
  • Table 86: Middle East and Africa Market Metric Ton (MT) Forecast by Country, 2020 to 2035
  • Table 87: Middle East and Africa Market Value (USD Billion) Forecast by Material, 2020 to 2035
  • Table 88: Middle East and Africa Market Metric Ton (MT) Forecast by Material, 2020 to 2035
  • Table 89: Middle East and Africa Market Value (USD Billion) Forecast by Product, 2020 to 2035
  • Table 90: Middle East and Africa Market Metric Ton (MT) Forecast by Product, 2020 to 2035
  • Table 91: Middle East and Africa Market Value (USD Billion) Forecast by End-use Industry, 2020 to 2035
  • Table 92: Middle East and Africa Market Metric Ton (MT) Forecast by End-use Industry, 2020 to 2035
  • Table 93: Middle East and Africa Market Value (USD Billion) Forecast by Technology, 2020 to 2035
  • Table 94: Middle East and Africa Market Metric Ton (MT) Forecast by Technology, 2020 to 2035
  • Table 95: Middle East and Africa Market Value (USD Billion) Forecast by End Use, 2020 to 2035
  • Table 96: Middle East and Africa Market Metric Ton (MT) Forecast by End Use, 2020 to 2035

List of Figures

  • Figure 1: Global Market Metric Ton (MT) Forecast 2020 to 2035
  • Figure 2: Global Market Pricing Analysis
  • Figure 3: Global Market Value (USD Billion) Forecast 2020 to 2035
  • Figure 4: Global Market Value Share and BPS Analysis by Material, 2025 and 2035
  • Figure 5: Global Market Y-o-Y Growth Comparison by Material, 2025 to 2035
  • Figure 6: Global Market Attractiveness Analysis by Material
  • Figure 7: Global Market Value Share and BPS Analysis by Product, 2025 and 2035
  • Figure 8: Global Market Y-o-Y Growth Comparison by Product, 2025 to 2035
  • Figure 9: Global Market Attractiveness Analysis by Product
  • Figure 10: Global Market Value Share and BPS Analysis by End-use Industry, 2025 and 2035
  • Figure 11: Global Market Y-o-Y Growth Comparison by End-use Industry, 2025 to 2035
  • Figure 12: Global Market Attractiveness Analysis by End-use Industry
  • Figure 13: Global Market Value Share and BPS Analysis by Technology, 2025 and 2035
  • Figure 14: Global Market Y-o-Y Growth Comparison by Technology, 2025 to 2035
  • Figure 15: Global Market Attractiveness Analysis by Technology
  • Figure 16: Global Market Value Share and BPS Analysis by End Use, 2025 and 2035
  • Figure 17: Global Market Y-o-Y Growth Comparison by End Use, 2025 to 2035
  • Figure 18: Global Market Attractiveness Analysis by End Use
  • Figure 19: Global Market Value (USD Billion) Share and BPS Analysis by Region, 2025 and 2035
  • Figure 20: Global Market Y-o-Y Growth Comparison by Region, 2025 to 2035
  • Figure 21: Global Market Attractiveness Analysis by Region
  • Figure 22: North America Market Incremental $ Opportunity, 2025 to 2035
  • Figure 23: Latin America Market Incremental $ Opportunity, 2025 to 2035
  • Figure 24: Western Europe Market Incremental $ Opportunity, 2025 to 2035
  • Figure 25: Eastern Europe Market Incremental $ Opportunity, 2025 to 2035
  • Figure 26: East Asia Market Incremental $ Opportunity, 2025 to 2035
  • Figure 27: South Asia & Pacific Market Incremental $ Opportunity, 2025 to 2035
  • Figure 28: Middle East and Africa Market Incremental $ Opportunity, 2025 to 2035
  • Figure 29: North America Market Value Share and BPS Analysis by Country, 2025 and 2035
  • Figure 30: North America Market Value Share and BPS Analysis by Material, 2025 and 2035
  • Figure 31: North America Market Y-o-Y Growth Comparison by Material, 2025 to 2035
  • Figure 32: North America Market Attractiveness Analysis by Material
  • Figure 33: North America Market Value Share and BPS Analysis by Product, 2025 and 2035
  • Figure 34: North America Market Y-o-Y Growth Comparison by Product, 2025 to 2035
  • Figure 35: North America Market Attractiveness Analysis by Product
  • Figure 36: North America Market Value Share and BPS Analysis by End-use Industry, 2025 and 2035
  • Figure 37: North America Market Y-o-Y Growth Comparison by End-use Industry, 2025 to 2035
  • Figure 38: North America Market Attractiveness Analysis by End-use Industry
  • Figure 39: North America Market Value Share and BPS Analysis by Technology, 2025 and 2035
  • Figure 40: North America Market Y-o-Y Growth Comparison by Technology, 2025 to 2035
  • Figure 41: North America Market Attractiveness Analysis by Technology
  • Figure 42: North America Market Value Share and BPS Analysis by End Use, 2025 and 2035
  • Figure 43: North America Market Y-o-Y Growth Comparison by End Use, 2025 to 2035
  • Figure 44: North America Market Attractiveness Analysis by End Use
  • Figure 45: Latin America Market Value Share and BPS Analysis by Country, 2025 and 2035
  • Figure 46: Latin America Market Value Share and BPS Analysis by Material, 2025 and 2035
  • Figure 47: Latin America Market Y-o-Y Growth Comparison by Material, 2025 to 2035
  • Figure 48: Latin America Market Attractiveness Analysis by Material
  • Figure 49: Latin America Market Value Share and BPS Analysis by Product, 2025 and 2035
  • Figure 50: Latin America Market Y-o-Y Growth Comparison by Product, 2025 to 2035
  • Figure 51: Latin America Market Attractiveness Analysis by Product
  • Figure 52: Latin America Market Value Share and BPS Analysis by End-use Industry, 2025 and 2035
  • Figure 53: Latin America Market Y-o-Y Growth Comparison by End-use Industry, 2025 to 2035
  • Figure 54: Latin America Market Attractiveness Analysis by End-use Industry
  • Figure 55: Latin America Market Value Share and BPS Analysis by Technology, 2025 and 2035
  • Figure 56: Latin America Market Y-o-Y Growth Comparison by Technology, 2025 to 2035
  • Figure 57: Latin America Market Attractiveness Analysis by Technology
  • Figure 58: Latin America Market Value Share and BPS Analysis by End Use, 2025 and 2035
  • Figure 59: Latin America Market Y-o-Y Growth Comparison by End Use, 2025 to 2035
  • Figure 60: Latin America Market Attractiveness Analysis by End Use
  • Figure 61: Western Europe Market Value Share and BPS Analysis by Country, 2025 and 2035
  • Figure 62: Western Europe Market Value Share and BPS Analysis by Material, 2025 and 2035
  • Figure 63: Western Europe Market Y-o-Y Growth Comparison by Material, 2025 to 2035
  • Figure 64: Western Europe Market Attractiveness Analysis by Material
  • Figure 65: Western Europe Market Value Share and BPS Analysis by Product, 2025 and 2035
  • Figure 66: Western Europe Market Y-o-Y Growth Comparison by Product, 2025 to 2035
  • Figure 67: Western Europe Market Attractiveness Analysis by Product
  • Figure 68: Western Europe Market Value Share and BPS Analysis by End-use Industry, 2025 and 2035
  • Figure 69: Western Europe Market Y-o-Y Growth Comparison by End-use Industry, 2025 to 2035
  • Figure 70: Western Europe Market Attractiveness Analysis by End-use Industry
  • Figure 71: Western Europe Market Value Share and BPS Analysis by Technology, 2025 and 2035
  • Figure 72: Western Europe Market Y-o-Y Growth Comparison by Technology, 2025 to 2035
  • Figure 73: Western Europe Market Attractiveness Analysis by Technology
  • Figure 74: Western Europe Market Value Share and BPS Analysis by End Use, 2025 and 2035
  • Figure 75: Western Europe Market Y-o-Y Growth Comparison by End Use, 2025 to 2035
  • Figure 76: Western Europe Market Attractiveness Analysis by End Use
  • Figure 77: Eastern Europe Market Value Share and BPS Analysis by Country, 2025 and 2035
  • Figure 78: Eastern Europe Market Value Share and BPS Analysis by Material, 2025 and 2035
  • Figure 79: Eastern Europe Market Y-o-Y Growth Comparison by Material, 2025 to 2035
  • Figure 80: Eastern Europe Market Attractiveness Analysis by Material
  • Figure 81: Eastern Europe Market Value Share and BPS Analysis by Product, 2025 and 2035
  • Figure 82: Eastern Europe Market Y-o-Y Growth Comparison by Product, 2025 to 2035
  • Figure 83: Eastern Europe Market Attractiveness Analysis by Product
  • Figure 84: Eastern Europe Market Value Share and BPS Analysis by End-use Industry, 2025 and 2035
  • Figure 85: Eastern Europe Market Y-o-Y Growth Comparison by End-use Industry, 2025 to 2035
  • Figure 86: Eastern Europe Market Attractiveness Analysis by End-use Industry
  • Figure 87: Eastern Europe Market Value Share and BPS Analysis by Technology, 2025 and 2035
  • Figure 88: Eastern Europe Market Y-o-Y Growth Comparison by Technology, 2025 to 2035
  • Figure 89: Eastern Europe Market Attractiveness Analysis by Technology
  • Figure 90: Eastern Europe Market Value Share and BPS Analysis by End Use, 2025 and 2035
  • Figure 91: Eastern Europe Market Y-o-Y Growth Comparison by End Use, 2025 to 2035
  • Figure 92: Eastern Europe Market Attractiveness Analysis by End Use
  • Figure 93: East Asia Market Value Share and BPS Analysis by Country, 2025 and 2035
  • Figure 94: East Asia Market Value Share and BPS Analysis by Material, 2025 and 2035
  • Figure 95: East Asia Market Y-o-Y Growth Comparison by Material, 2025 to 2035
  • Figure 96: East Asia Market Attractiveness Analysis by Material
  • Figure 97: East Asia Market Value Share and BPS Analysis by Product, 2025 and 2035
  • Figure 98: East Asia Market Y-o-Y Growth Comparison by Product, 2025 to 2035
  • Figure 99: East Asia Market Attractiveness Analysis by Product
  • Figure 100: East Asia Market Value Share and BPS Analysis by End-use Industry, 2025 and 2035
  • Figure 101: East Asia Market Y-o-Y Growth Comparison by End-use Industry, 2025 to 2035
  • Figure 102: East Asia Market Attractiveness Analysis by End-use Industry
  • Figure 103: East Asia Market Value Share and BPS Analysis by Technology, 2025 and 2035
  • Figure 104: East Asia Market Y-o-Y Growth Comparison by Technology, 2025 to 2035
  • Figure 105: East Asia Market Attractiveness Analysis by Technology
  • Figure 106: East Asia Market Value Share and BPS Analysis by End Use, 2025 and 2035
  • Figure 107: East Asia Market Y-o-Y Growth Comparison by End Use, 2025 to 2035
  • Figure 108: East Asia Market Attractiveness Analysis by End Use
  • Figure 109: South Asia & Pacific Market Value Share and BPS Analysis by Country, 2025 and 2035
  • Figure 110: South Asia & Pacific Market Value Share and BPS Analysis by Material, 2025 and 2035
  • Figure 111: South Asia & Pacific Market Y-o-Y Growth Comparison by Material, 2025 to 2035
  • Figure 112: South Asia & Pacific Market Attractiveness Analysis by Material
  • Figure 113: South Asia & Pacific Market Value Share and BPS Analysis by Product, 2025 and 2035
  • Figure 114: South Asia & Pacific Market Y-o-Y Growth Comparison by Product, 2025 to 2035
  • Figure 115: South Asia & Pacific Market Attractiveness Analysis by Product
  • Figure 116: South Asia & Pacific Market Value Share and BPS Analysis by End-use Industry, 2025 and 2035
  • Figure 117: South Asia & Pacific Market Y-o-Y Growth Comparison by End-use Industry, 2025 to 2035
  • Figure 118: South Asia & Pacific Market Attractiveness Analysis by End-use Industry
  • Figure 119: South Asia & Pacific Market Value Share and BPS Analysis by Technology, 2025 and 2035
  • Figure 120: South Asia & Pacific Market Y-o-Y Growth Comparison by Technology, 2025 to 2035
  • Figure 121: South Asia & Pacific Market Attractiveness Analysis by Technology
  • Figure 122: South Asia & Pacific Market Value Share and BPS Analysis by End Use, 2025 and 2035
  • Figure 123: South Asia & Pacific Market Y-o-Y Growth Comparison by End Use, 2025 to 2035
  • Figure 124: South Asia & Pacific Market Attractiveness Analysis by End Use
  • Figure 125: Middle East and Africa Market Value Share and BPS Analysis by Country, 2025 and 2035
  • Figure 126: Middle East and Africa Market Value Share and BPS Analysis by Material, 2025 and 2035
  • Figure 127: Middle East and Africa Market Y-o-Y Growth Comparison by Material, 2025 to 2035
  • Figure 128: Middle East and Africa Market Attractiveness Analysis by Material
  • Figure 129: Middle East and Africa Market Value Share and BPS Analysis by Product, 2025 and 2035
  • Figure 130: Middle East and Africa Market Y-o-Y Growth Comparison by Product, 2025 to 2035
  • Figure 131: Middle East and Africa Market Attractiveness Analysis by Product
  • Figure 132: Middle East and Africa Market Value Share and BPS Analysis by End-use Industry, 2025 and 2035
  • Figure 133: Middle East and Africa Market Y-o-Y Growth Comparison by End-use Industry, 2025 to 2035
  • Figure 134: Middle East and Africa Market Attractiveness Analysis by End-use Industry
  • Figure 135: Middle East and Africa Market Value Share and BPS Analysis by Technology, 2025 and 2035
  • Figure 136: Middle East and Africa Market Y-o-Y Growth Comparison by Technology, 2025 to 2035
  • Figure 137: Middle East and Africa Market Attractiveness Analysis by Technology
  • Figure 138: Middle East and Africa Market Value Share and BPS Analysis by End Use, 2025 and 2035
  • Figure 139: Middle East and Africa Market Y-o-Y Growth Comparison by End Use, 2025 to 2035
  • Figure 140: Middle East and Africa Market Attractiveness Analysis by End Use
  • Figure 141: Global Market - Tier Structure Analysis
  • Figure 142: Global Market - Company Share Analysis

Frequently Asked Questions

What is the projected market size of the Micro Perforated Films Packaging Market in 2025 and 2035?

The market size is projected to be USD 1.58 billion in 2025 and USD 2.45 billion by 2035.

What is the expected CAGR for the Micro Perforated Films Packaging Market from 2025 to 2035?

The expected CAGR is 4.5% from 2025 to 2035.

Which material holds the largest market share in the Micro Perforated Films Packaging Market?

Bags and pouches are expected to hold 43.2% market share in 2025.

Which product type dominates the Micro Perforated Films Packaging Market?

Polyethylene (PE) is projected to dominate with a 42.6% share in 2025.

What is the market share of the leading company in the Micro Perforated Films Packaging Market?

The leading company, Amcor Limited, holds a market share of approximately 20%.

Explore Similar Insights

Future Market Insights

Micro Perforated Films Packaging Market