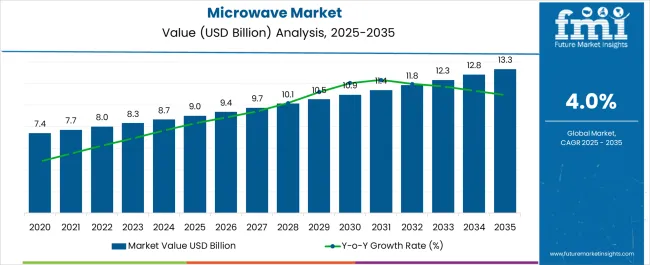
The Microwave Market is estimated to be valued at USD 9.0 billion in 2025 and is projected to reach USD 13.3 billion by 2035, registering a compound annual growth rate (CAGR) of 4.0% over the forecast period.
| Metric | Value |
|---|---|
| Microwave Market Estimated Value in (2025 E) | USD 9.0 billion |
| Microwave Market Forecast Value in (2035 F) | USD 13.3 billion |
| Forecast CAGR (2025 to 2035) | 4.0% |
The microwave market is witnessing consistent growth, driven by increased consumer focus on time-saving kitchen appliances, changing dietary habits, and the expansion of organized retail across urban and semi-urban centers. Technological advancements such as inverter technology, smart sensor cooking, and integration with home automation systems have broadened microwave utility across diverse consumer segments.
Energy efficiency improvements, enhanced design aesthetics, and multipurpose cooking capabilities are also contributing to wider product adoption. Demand is further being fueled by rising dual-income households, the surge in ready-to-eat meal consumption, and consumer preference for compact, user-friendly appliances.
Looking ahead, manufacturers are expected to leverage innovation in cooking modes, connectivity, and sustainable materials to differentiate offerings and respond to evolving kitchen trends.
The market is segmented by Product Type, Application, Structure, and Sales Channel and region. By Product Type, the market is divided into Convection, Grill, and Solo. In terms of Application, the market is classified into Household and Commercial. Based on Structure, the market is segmented into Countertop and Built-In. By Sales Channel, the market is divided into Hypermarkets/ Supermarkets, Wholesalers/Distributors, Specialty Stores, Multibrand Stores, Online Retailers, and Other Sales Channe. Regionally, the market is classified into North America, Latin America, Western Europe, Eastern Europe, Balkan & Baltic Countries, Russia & Belarus, Central Asia, East Asia, South Asia & Pacific, and the Middle East & Africa.
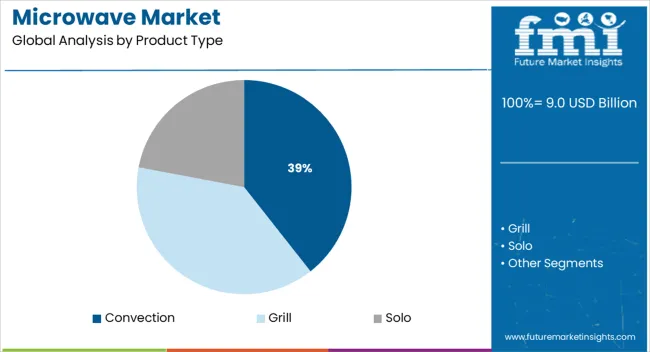
Convection microwaves are projected to account for 39.4% of total revenue in 2025, positioning them as the leading product type. Their dominance is supported by their multifunctional capabilities, combining traditional microwave heating with hot air circulation for baking and roasting.
This flexibility addresses growing consumer interest in cooking versatility within compact kitchen spaces. Enhanced energy efficiency and faster cooking times have made convection units more appealing for households seeking convenience without compromising cooking quality.
Additionally, manufacturers have introduced affordable models with pre-set cooking modes and digital controls, which has further broadened accessibility. As consumer preferences shift toward appliances that deliver diverse functionalities in a single unit, convection microwaves are expected to remain the preferred segment.
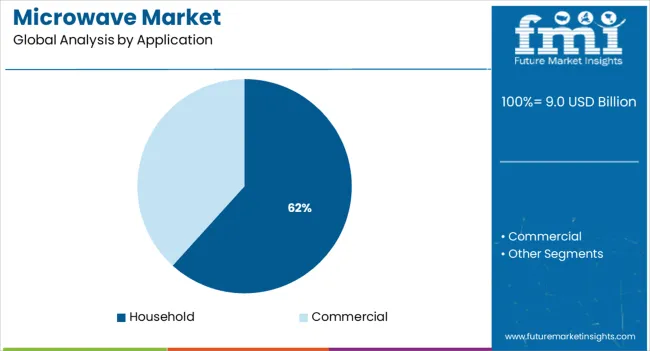
Household usage is projected to contribute 61.7% of the microwave market revenue in 2025, making it the dominant application category. The widespread penetration of microwaves in residential kitchens is being driven by lifestyle changes, rising urbanization, and the need for time-efficient meal preparation.
Increased awareness around healthy reheating and low-oil cooking methods has also supported adoption. Home-focused product innovations, including child safety features, smart timers, and custom recipe memory, have enhanced the appeal among families.
Furthermore, as space-saving and energy-conscious appliances gain favor in small households and studio apartments, the household segment continues to anchor the market's core demand.
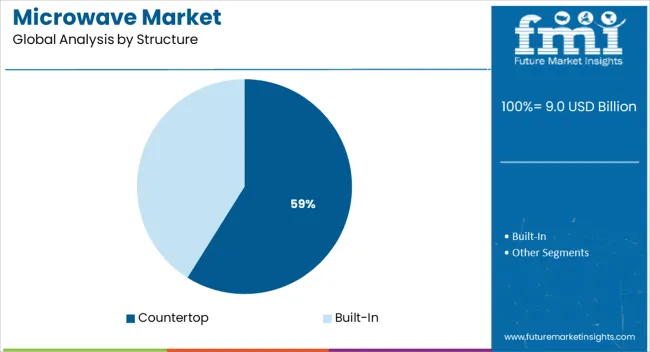
Countertop microwaves are anticipated to hold 58.9% of the market revenue in 2025, making them the leading structural configuration. Their appeal lies in ease of installation, affordability, and adaptability across a wide range of kitchen layouts.
The absence of complex mounting requirements or modifications makes countertop models especially attractive to renters, students, and first-time buyers. Compact form factors, improved aesthetics, and lighter weight have contributed to greater portability and usage flexibility.
Retailers and e-commerce platforms have increasingly favored countertop models in bundled appliance offerings, strengthening their visibility and market penetration. As mobility, simplicity, and cost-efficiency remain top priorities for a broad consumer base, the countertop structure is expected to retain its leadership.
North America, is expected to be the most lucrative market for microwave, and is expected to hold a significant value share in 2025. Preference for smart home appliances such as smart microwave is surging as a result of IoT enabled kitchen appliances.
The growing food processing and food service industry in North America has propelled the sales of microwave ovens in the region.
In addition, manufacturers are developing technologically advanced products such as smart microwaves compatible with smartphones. Moreover, with increasing internet penetration, and surging adoption of wireless technologies, sales of microwaves in the region are expected to surge over the forecast period.
Based on the structure type, the countertop microwave holds the maximum share and is expected to have a significant market value share by the end of 2035. Growth in the segment is contributed to the compatibility of this microwave and its cost-effectiveness.
As compared to built-in microwaves the installation of countertop microwaves is easy, as they have zero installation cost, and only require a power plug.
These microwaves are easy to use and they are suitable for most household cooking needs. The convenience to move such microwaves to desirable places is also contributing to sales in the market.
Thus countertop microwaves have huge demand in the commercial sector as well. On the back of these aforementioned factors, the demand for countertop microwaves is surging over the assessment period.
Demand for microwaves is expected to grow at a 4% CAGR over the forecast period, in comparison to the moderate CAGR registered between 2020 to 2024. Various startups and global players are leveraging digital platforms to promote their products and increase sales.
Increasing number of nuclear households and rising demand for frozen and ready-to-eat food are expected to drive the market. Besides this, hectic schedules and increasing focus on healthy diets among consumers will boost the adoption of microwaves.
Expansion in the hospitality sector, as well as a rise in catering contracts for large-scale events, seminars, and other social gatherings is expected to spur demand for commercial appliances.
Increasing awareness of various kitchen equipment, such as grills, microwaves, and barbecue equipment is predicted to have a positive impact in the growth in the market.
Further, growing trend in home automation, which is characterized by inverter-based microwaves, is likely to create opportunities for growth for microwave manufacturers over the forecast period.
Increasing sales of frozen and ready-to-eat food is driving demand for microwaves among consumers. Growing population and increased understanding of different cooking mediums such as microwaves, grills, and barbeques are expected to propel sales of microwaves over the forecast period.
Increasing Focus on Home-cooking in the USA Will Fuel Sales of Microwaves
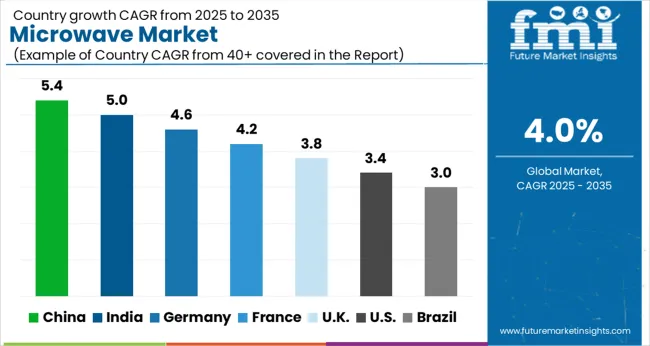
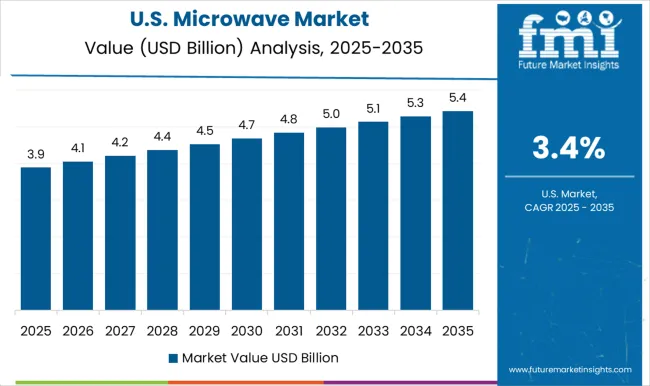
Sales in the USA microwave market are forecast to increase at a 1.1% CAGR over the forecast period. Increasing demand for smart appliances and growing preference energy-efficient kitchen appliances are some of the factors driving the USA market.
Furthermore, rising trend of home-cooking among millennials is spurring demand for affordable and energy efficient kitchen appliances among millennials in the USA will continue augmenting the growth in the market over the forecast period.
High Demand for Energy-Efficient Kitchen Appliances Will Fuel Sales of Microwaves
Demand for microwaves in China is forecast to grow at a 10.2% CAGR over the assessment period. Increasing consumption of frozen and packaged meat snacks in China is fueling sales of microwaves.
In addition to this, rapid adoption of technologically advanced equipment for the manufacturing of consumer goods and kitchen appliances in China will propel sales of microwaves over the assessment period.
Rising Demand for Convenient Kitchen Products Will Drive the India Microwave Market
The India microwave market is expected to expand at a CAGR of 8.0% during the forecast period. Consumers are preferring technology-driven kitchen appliances, such as microwaves, which is expected to boost sales in the market.
Rising electrification in rural areas and high adoption of online retail channels will drive the expansion in the market over the assessment period.
Demand for Countertop Microwaves Will Continue Gaining Traction
Based on structure, sales of countertop microwaves will grow at a CAGR of 3.3% during the forecast period. When compared with built-in microwave, the cost of countertop microwaves is less. The installation of countertop microwaves is also easy.
Furthermore, they have zero establishment costs and only require a power plug and space at the counter. Rising demand for energy-efficient and affordable kitchen appliances will drive sales in this segment.
Sales of Microwaves for Commercial Purposes to Remain High
By applications, demand for microwave in the commercial sector is expected to increase at a 4.1% CAGR over the assessment period. The cost of using microwave is less as it uses less energy than a cook stove. It is suitable for small portions of food, which is useful in places such as restaurants, hotels, schools, and offices.
Increased Product Availability on Internet Platforms Will Propel Sales of Microwaves
In terms of sales channels, the online segment will account for a dominant share in the market over the forecast period. Increased product availability on internet platforms, which allows for price, design, and feature comparisons, will boost sales through these channels.
Secure transaction/payment and doorstep delivery are also provided by online platforms. Refund and exchange policies that are friendly to customers are maintained. As a result, sales of microwaves through online channels will remain high.
Leading companies operating in the global microwave market are investing in research and development to introduce new products in the market. Manufacturers are also using brand other strategies to improve their brand awareness. For instance:
| Attribute | Details |
|---|---|
| Estimated Market Size (2025) | USD 9.0 billion |
| Projected Market Valuation (2035) | USD 13.3 billion |
| Value-based CAGR (2025 to 2035) | 4% CAGR |
| Forecast Period | 2025 to 2035 |
| Historical Data Available for | 2020 to 2024 |
| Market Analysis | USD Billion for Value |
| Key Regions Covered | North America; Latin America; Europe; East Asia; South Asia; Oceania & MEA |
| Key Countries Covered | The USA, Canada, Brazil, Mexico, Germany, the UK, France, Spain, Italy, Russia, Benelux, South Africa, Northern Africa GCC Countries, China, Japan, South Korea, India, Thailand, Malaysia, Indonesia, Australia & New Zealand. |
| Key Segments Covered | Product Type, Application, Structure, Sales Channel and Region. |
| Key Companies Profiled | Galanz Enterprise group.; Whirlpool Corporation; Hoover Limited; LG Electronics; AB Electrolux.; Sharp Corporation; Illionis Tool works INC; Alto-Shaam INC; Panasonic Corporation; Haier group corporation; Robert Bosch |
| Report Coverage | Market Forecast, Company Share Analysis, Competition Intelligence, DROT Analysis, Market Dynamics and Challenges, and Strategic Growth Initiatives |
The global microwave market is estimated to be valued at USD 9.0 billion in 2025.
The market size for the microwave market is projected to reach USD 13.3 billion by 2035.
The microwave market is expected to grow at a 4.0% CAGR between 2025 and 2035.
The key product types in microwave market are convection, grill and solo.
In terms of application, household segment to command 61.7% share in the microwave market in 2025.


Our Research Products

The "Full Research Suite" delivers actionable market intel, deep dives on markets or technologies, so clients act faster, cut risk, and unlock growth.

The Leaderboard benchmarks and ranks top vendors, classifying them as Established Leaders, Leading Challengers, or Disruptors & Challengers.

Locates where complements amplify value and substitutes erode it, forecasting net impact by horizon

We deliver granular, decision-grade intel: market sizing, 5-year forecasts, pricing, adoption, usage, revenue, and operational KPIs—plus competitor tracking, regulation, and value chains—across 60 countries broadly.

Spot the shifts before they hit your P&L. We track inflection points, adoption curves, pricing moves, and ecosystem plays to show where demand is heading, why it is changing, and what to do next across high-growth markets and disruptive tech

Real-time reads of user behavior. We track shifting priorities, perceptions of today’s and next-gen services, and provider experience, then pace how fast tech moves from trial to adoption, blending buyer, consumer, and channel inputs with social signals (#WhySwitch, #UX).

Partner with our analyst team to build a custom report designed around your business priorities. From analysing market trends to assessing competitors or crafting bespoke datasets, we tailor insights to your needs.
Supplier Intelligence
Discovery & Profiling
Capacity & Footprint
Performance & Risk
Compliance & Governance
Commercial Readiness
Who Supplies Whom
Scorecards & Shortlists
Playbooks & Docs
Category Intelligence
Definition & Scope
Demand & Use Cases
Cost Drivers
Market Structure
Supply Chain Map
Trade & Policy
Operating Norms
Deliverables
Buyer Intelligence
Account Basics
Spend & Scope
Procurement Model
Vendor Requirements
Terms & Policies
Entry Strategy
Pain Points & Triggers
Outputs
Pricing Analysis
Benchmarks
Trends
Should-Cost
Indexation
Landed Cost
Commercial Terms
Deliverables
Brand Analysis
Positioning & Value Prop
Share & Presence
Customer Evidence
Go-to-Market
Digital & Reputation
Compliance & Trust
KPIs & Gaps
Outputs
Full Research Suite comprises of:
Market outlook & trends analysis
Interviews & case studies
Strategic recommendations
Vendor profiles & capabilities analysis
5-year forecasts
8 regions and 60+ country-level data splits
Market segment data splits
12 months of continuous data updates
DELIVERED AS:
PDF EXCEL ONLINE
Microwave Source Market Size and Share Forecast Outlook 2025 to 2035
Microwave Monolithic Integrated Circuits Market Size and Share Forecast Outlook 2025 to 2035
Microwave Cable Assemblies Market Size and Share Forecast Outlook 2025 to 2035
Microwave Oven Market Size and Share Forecast Outlook 2025 to 2035
Microwaveable Stuffed Animal Toys Market Size and Share Forecast Outlook 2025 to 2035
Microwave Ablation Devices Market Size and Share Forecast Outlook 2025 to 2035
Microwave Backhaul System Market Size and Share Forecast Outlook 2025 to 2035
Microwave Device Market Size and Share Forecast Outlook 2025 to 2035
Microwave-Safe Utensils Market Size and Share Forecast Outlook 2025 to 2035
Microwave Absorbing Material Market Size, Growth, and Forecast 2025 to 2035
Microwave Power Meter Market
Microwave Antenna Market
High-Power Microwave Source Market Size and Share Forecast Outlook 2025 to 2035
Commercial Microwave Ovens Market Analysis – Size, Share, and Forecast 2025 to 2035
Commercial Microwaves Market
Solid-State Microwave Source Market Size and Share Forecast Outlook 2025 to 2035
Point-to-point Microwave Antenna Market Analysis by Polarization, Antenna Type, Diameter, Frequency Range and Region Through 2035
WiMAX (Worldwide Interoperability For Microwave Access) Market Size and Share Forecast Outlook 2025 to 2035

Thank you!
You will receive an email from our Business Development Manager. Please be sure to check your SPAM/JUNK folder too.
Chat With
MaRIA