Reports

- Global Locations -

Headquarters

Future Market Insights, Inc.

Christiana Corporate, 200
Continental Drive, Suite 401,
Newark, Delaware - 19713,
United States

T: +1-845-579-5705

Americas

Future Market Insights, Inc.

616 Corporate Way, Suite 2-9018,
Valley Cottage, NY 10989, United States

T: +1-347-918-3531

MEA

Future Market Insights

1602-6 Jumeirah Bay X2 Tower, Plot No: JLT-PH2-X2A,
Jumeirah Lakes Towers, Dubai,
United Arab Emirates

Europe

Future Market Insights

3rd Floor, 207 Regent Street,
W1B 3HH London
United Kingdom

T: + 44 (0) 20 8123 9659
D: +44 (0) 20 3287 4268

Asia Pacific

Future Market Insights

IndiaLand Global Tech Park, Unit UG-1, Behind Grand HighStreet, Phase 1, Hinjawadi, MH, Pune – 411057, India

Microwave Device Market Outlook (2022 to 2032)

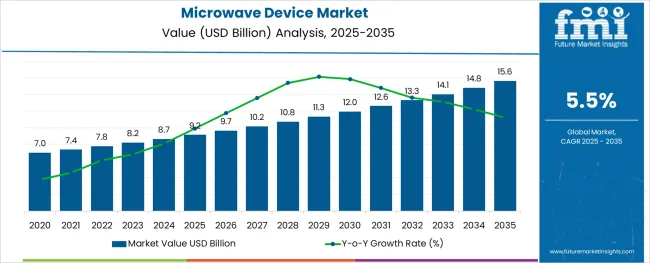
With a CAGR of 5.5% between 2022 and 2032, the microwave device market is expected to grow from an anticipated $7.8 billion in 2022 to an anticipated $13.4 billion by 2032. New opportunities are being created in the microwave device market continuously owing to the following:

  • increased funding for military and defense projects
  • expanding requirement for reliable and quick communication
  • growing need for microwave devices in the field of patient monitoring
  • the proliferation of 5G and Internet of Things networks
Report Attribute Details
Microwave Device Market Value (2022) US$ 7.8 Billion
Microwave Device Market Anticipated Forecast Value (2032) US$ 13.4 Billion
Microwave Device Market Projected Growth Rate (2022 to 2032) 5.5%

Don't pay for what you don't need

Customize your report by selecting specific countries or regions and save 30%!

Regional Analysis for the Microwave Device Market

The demand for semiconductor devices used in defense applications in nations like India, the USA, China, and Russia has increased dramatically as a result of recent global war crises, such as Russia's massive invasion of Ukraine and the border dispute between China and India. Additionally, the supply chain and distribution network for defense and commercial aviation has been completely interrupted due to the ongoing war between Russia and Ukraine.

One of the most important parts of any electronic or avionics setup is the microwave equipment. Due to the ongoing conflict, there has been an interruption in the delivery of essential commodities. A whopping 70% of the world's neon gas comes from Ukraine. Neon is used for a wide variety of purposes, including but not limited to lighting, vacuum tubes, high-voltage indicators, lightning arresters, wave meter tubes, television tubes, and helium-neon lasers. Ninety percent of the neon used in American semiconductor manufacturing comes from Ukraine. There will be long-term effects on the microwave device market from the war, as adjusting the global supply chain and distribution network will take some time.

Ku-growing band's use in space and defense applications is fuelling the market's expansion

During the forecast period, the Ku-Band segment of the microwave device market is likely to grow at the quickest rate due to rising investments in space Research and Development activities and rising demand for satellite communications. Ku-band systems and equipment are becoming increasingly popular in the defense sector, which is anticipated to drive future microwave device market expansion.

In 2021, the L-Band market sector was the most lucrative. This microwave device market is dominated by the proliferation of high-tech L-Band microwave systems used in GPS, radio, telecommunications, and air traffic control.

S-Band, X-Band, C-Band, and Ka-Band radio frequency spectrums are anticipated to have a sizable microwave device market share throughout the forecast period because of their widespread use in modern communications and computing.

Sudip Saha
Sudip Saha

Principal Consultant

Talk to Analyst

Find your sweet spots for generating winning opportunities in this market.

How Industrial Consumption is Shaping Up the Market

In 2022, the telecommunications industry is predicted to be the most lucrative. Wireless networks, microwave radio relay networks, radar, satellite, and spacecraft communication, and point-to-point links are all contributing to the market's growth and dominance. Therefore, increased rates of microwave device market expansion are expected in the not-too-distant future.

The space industry is expected to post the fastest growth rate over the projection time frame. Market expansion is expected to be driven by rising satellite launches and spending on space Research and Development activities in both established and emerging economies.

As the current pandemic enters a recovery phase, the healthcare industry is expected to expand at a rapid rate. It is expected that the healthcare industry would experience rapid expansion as a result of rising demand for the product to detect cancer cells and treat severe ailments. Thus, the demand for microwave devices is expected to grow consistently.

Microwave device market share is likely to increase due to the usage of navigation radars used by UAVs, as these microwaves are suitable for wireless transmission of signals having larger bandwidth.

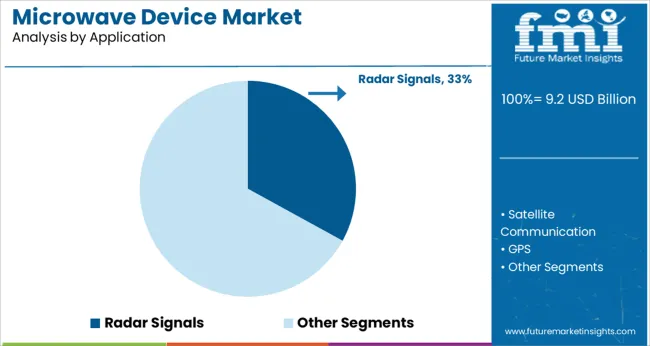
The microwave device is generally used for satellite communications, radar signals, phones, and marine applications, which is likely to boost the demand for microwave devices by end-user companies.

The sales of microwave device are rapidly rising as it provides more antenna gain, higher data & frequency rates, and reduces the antenna size with the benefit of low power consumption. This leads to an increase in microwave devices as per the microwave device market survey.

Microwave device is further used for medical treatments, drying materials, and in households for the preparation of food which increase the adoption of microwave device in the market.

Microwave device technology consists of electromagnetic rays having frequencies of 300 MHz to 300 GHz in the electromagnetic spectrum traveling in straight lines due to its high-efficiency technology, and heat tolerance is likely to rise in the microwave device market size during the forecast period from 2022 to 2032.

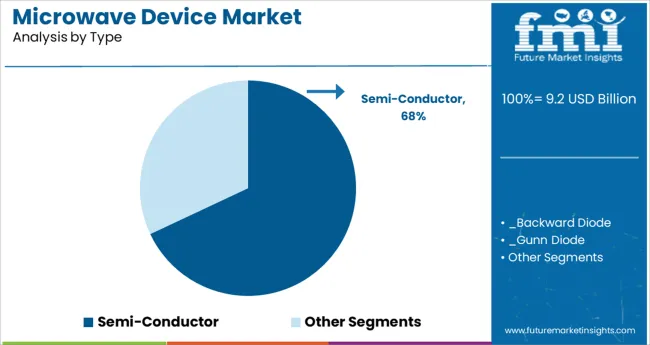
Microwave device is generally of two types semiconductor microwave devices and tube microwave devices, the increasing usage of GAN & SIC devices in the amplifier technology is boosting the adoption of microwave devices in the coming year.

Microwave devices are supposed to enhance accuracy, and it is executed in telecom applications which is another factor of rising in the microwave device market growth during the forecast period.

The microwave device is broadly used with a high bandwidth that helps to generate data transmission at high rates, which is also efficient for detecting, measuring, and generating microwaves. These are all the key factors that are upsurging the microwave device market statistics in the coming year.

What are Some of the Factors Spearheading the Microwave Device Market?

The major factor driving the adoption of microwave devices is the increasing usage of microwave devices in various segments such as cooking, medical and security purpose. This usage of microwave devices helps in providing wide bandwidth without the need for cable during the forecast period from 2022 to 2032.

Another factor driving this microwave device market is that Microwaves can carry a high quantity of information due to which microwave devices are used for faster operations. This factor is supposed to rise the microwave device market trends in the coming year.

The key challenge for the microwave device market is the high cost of these devices, and line-of-sight will be disrupted if any obstacle, such as new buildings, is in the way due to which signal can be missed. It is a huge issue as per the microwave device market report during the forecast period.

It also takes high transit time for carriers through these microwave devices, which is another challenge faced by end users and is anticipated to decrease the sales of microwave devices in the market.

Among the segments, the C-band segment is anticipated to dominate the microwave device market statistics all around the region. A rising in development and innovation is encouraging the vendors to raise the production for the consumers as per their demand.
Get the data you need at a Fraction of the cost

Personalize your report by choosing insights you need
and save 40%!

Which are the Factors Driving the Europe Microwave Device Market?

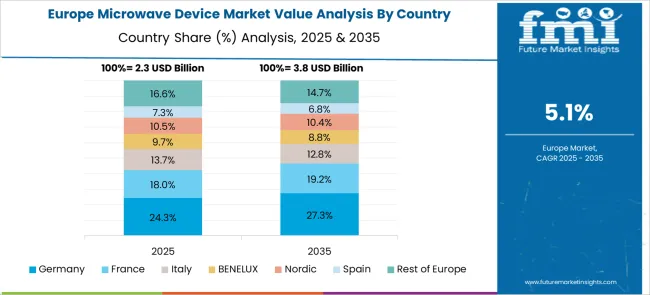
Presently, Europe holds the largest market share in the microwave device market analysis due to the presence of major market players in the region.

The microwave device is rapidly used in various end-user industries & it also various types of microwave devices, including semi-conductor microwave devices, backward diodes, Gunn diodes, Impatt diodes, Schottky diodes, tunnel diodes and tube microwave devices, and others which increase the microwave device market share in the coming year.

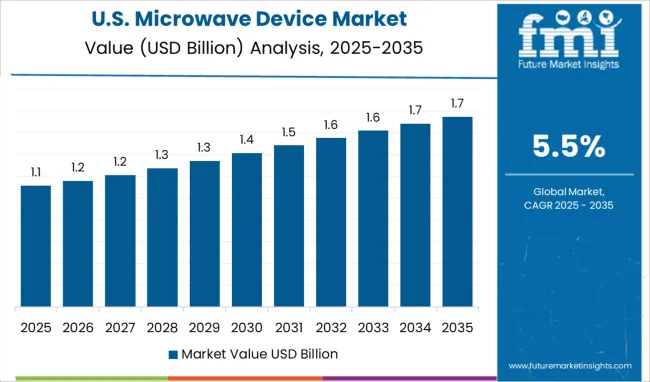
Presently, Europe is likely to lead the microwave device market growth by acquiring 25.9% of the share in the microwave device market all around the region during the forecast period from 2022 to 2032.

The rising usage of microwave technology for various medical and household appliances is helping this market to increase the adoption of microwave devices in the region.
How is the Demand Analysis of Microwave Device in North America?

North America stood in the second position after Europe with a share of 21.9% in the microwave device market size due to the increase in the adoption of microwave device technologies with the entry of major & established players in the region.

The key industry manufacturers are also likely to launch new products in the market as cost-friendly & high-quality, which is anticipated to boost the demand for microwave devices during the forecast period from 2022 to 2032.

How is the Start-up Ecosystem in the Microwave Device Market?

The start-ups operating in the microwave device market find low-entry barriers. To name a few, MinWave Technologies, SenSiC, School Rebound, and Rhovica Neuroimaging won the initial stage of Venture Kick’s financial and entrepreneurial support.

These start-ups are formulating microwave devices, which are 10X smaller and 10X lighter for facilitating the ease of studying challenging systems and assisting biotechs in addressing unmet needs of the medical facility.
Who are the Key Competitors in the Microwave Device Market?

The key competitors are using various technical adoption to expand the business of microwave devices and increase production which is anticipated to surge in the microwave device market trends & forecast in the coming year.

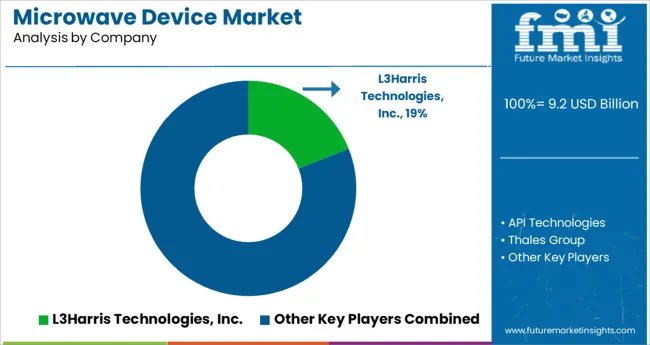
In the microwave device market, there are many providers some of them are L-3 Communications, API Technologies, Thales Group, Electron Energy Corporation, and others.

The Government is also a key player in the microwave device market growth while investing in huge expenditures on the defense force. All these key competitors are likely to boost the microwave device market opportunities in the coming forecast period from 2022 to 2032.

Recent Development in Microwave Device Market are:

  • The global telecom company Comtech Telecommunication Corporation deals with a contract of US$ 1.4 Million with the RF microwave control components in April 2021.
  • Microchip Technology Inc introduced its newly launched product GMICP2731-10. It is a gallium nitride radio frequency including Ka-band MMIC which helps to connect the signal fidelity and allows Earth stations to transmit with a high RF level.

Report Scope

Report Attribute Details
Growth Rate CAGR of 5.5% from 2022 to 2032
Base Year for Estimation 2021
Historical Data 2016 to 2021
Forecast Period 2022 to 2032
Quantitative Units Revenue in USD Million and CAGR from 2022 to 2032
Report Coverage Revenue Forecast, Volume Forecast, Company Ranking, Competitive Landscape, Growth Factors, Trends, and Pricing Analysis
Segments Covered
  • Product
  • End User
  • Frequency
  • Region
Regions Covered
  • North America
  • Latin America
  • Europe
  • East Asia
  • South Asia
  • Oceania
  • Middle East and Africa
Key Countries Profiled
  • USA
  • Canada
  • Brazil
  • Argentina
  • Germany
  • United Kingdom
  • France
  • Spain
  • Italy
  • Nordics
  • BENELUX
  • Australia & New Zealand
  • China
  • India
  • ASIAN
  • GCC Countries
  • South Africa
Key Companies Profiled
  • L-3 Communications
  • API Technologies
  • Thales Group
  • Electron Energy Corporation
Customization Available Upon Request

Key Segments

By Product:

  • Passive Devices
  • Active Devices

By End User:

  • Healthcare
  • Military & Defence
  • Space & Communication

By Frequency:

  • Ku-band
  • C-band
  • Ka-band
  • L-band
  • S-band
  • X-band

By Region:

  • North America
  • Latin America
  • Europe
  • Asia Pacific
  • Middle East and Africa

Frequently Asked Questions

What is the Growth Outlook for the Microwave Device Market?

The microwave device market is likely to advance at a CAGR of 5.5% through 2032.

Which Region Holds a Microwave Device Market Share?

The Europe region is set to hold a microwave device market share of 25.9% by 2032.

What is the Future of the Microwave Device Market?

The microwave device market is expected to account for US$ 13.4 Billion by 2032.

Table of Content

1. Executive Summary | Microwave Device Market

    1.1. Global Market Outlook

    1.2. Demand-side Trends

    1.3. Supply-side Trends

    1.4. Technology Roadmap Analysis

    1.5. Analysis and Recommendations

2. Market Overview

    2.1. Market Coverage / Taxonomy

    2.2. Market Definition / Scope / Limitations

3. Market Background

    3.1. Market Dynamics

        3.1.1. Drivers

        3.1.2. Restraints

        3.1.3. Opportunity

        3.1.4. Trends

    3.2. Scenario Forecast

        3.2.1. Demand in Optimistic Scenario

        3.2.2. Demand in Likely Scenario

        3.2.3. Demand in Conservative Scenario

    3.3. Opportunity Map Analysis

    3.4. Product Life Cycle Analysis

    3.5. Supply Chain Analysis

        3.5.1. Supply Side Participants and Their Roles

            3.5.1.1. Producers

            3.5.1.2. Mid-Level Participants (Traders/ Agents/ Brokers)

            3.5.1.3. Wholesalers and Distributors

        3.5.2. Value Added and Value Created at Node in the Supply Chain

        3.5.3. List of Raw Material Suppliers

        3.5.4. List of Existing and Potential Buyers

    3.6. Investment Feasibility Matrix

    3.7. Value Chain Analysis

        3.7.1. Profit Margin Analysis

        3.7.2. Wholesalers and Distributors

        3.7.3. Retailers

    3.8. PESTLE and Porter’s Analysis

    3.9. Regulatory Landscape

        3.9.1. By Key Regions

        3.9.2. By Key Countries

    3.10. Regional Parent Market Outlook

    3.11. Production and Consumption Statistics

    3.12. Import and Export Statistics

4. Global Market Analysis 2017 to 2021 and Forecast, 2022 to 2032

    4.1. Historical Market Size Value (US$ Million) & Volume (Units) Analysis, 2017 to 2021

    4.2. Current and Future Market Size Value (US$ Million) & Volume (Units) Projections, 2022 to 2032

        4.2.1. Y-o-Y Growth Trend Analysis

        4.2.2. Absolute $ Opportunity Analysis

5. Global Market Analysis 2017 to 2021 and Forecast 2022 to 2032, By Type

    5.1. Introduction / Key Findings

    5.2. Historical Market Size Value (US$ Million) & Volume (Units) Analysis By Type, 2017 to 2021

    5.3. Current and Future Market Size Value (US$ Million) & Volume (Units) Analysis and Forecast By Type, 2022 to 2032

        5.3.1. Semi-Conductor 

            5.3.1.1. Backward Diode

            5.3.1.2. Gunn Diode

            5.3.1.3. Impatt Diode

            5.3.1.4. Schottky Diode

            5.3.1.5. Tunnel Diode

            5.3.1.6. Others

        5.3.2. Tube 

    5.4. Y-o-Y Growth Trend Analysis By Type, 2017 to 2021

    5.5. Absolute $ Opportunity Analysis By Type, 2022 to 2032

6. Global Market Analysis 2017 to 2021 and Forecast 2022 to 2032, By Applications

    6.1. Introduction / Key Findings

    6.2. Historical Market Size Value (US$ Million) & Volume (Units) Analysis By Applications, 2017 to 2021

    6.3. Current and Future Market Size Value (US$ Million) & Volume (Units) Analysis and Forecast By Applications, 2022 to 2032

        6.3.1. Satellite Communication

        6.3.2. GPS

        6.3.3. Medical Treatment

        6.3.4. Household

        6.3.5. Radar Signals

        6.3.6. Others

    6.4. Y-o-Y Growth Trend Analysis By Applications, 2017 to 2021

    6.5. Absolute $ Opportunity Analysis By Applications, 2022 to 2032

7. Global Market Analysis 2017 to 2021 and Forecast 2022 to 2032, By Region

    7.1. Introduction

    7.2. Historical Market Size Value (US$ Million) & Volume (Units) Analysis By Region, 2017 to 2021

    7.3. Current Market Size Value (US$ Million) & Volume (Units) Analysis and Forecast By Region, 2022 to 2032

        7.3.1. North America

        7.3.2. Latin America

        7.3.3. Europe

        7.3.4. Asia Pacific

        7.3.5. Middle East and Africa

    7.4. Market Attractiveness Analysis By Region

8. North America Market Analysis 2017 to 2021 and Forecast 2022 to 2032, By Country

    8.1. Historical Market Size Value (US$ Million) & Volume (Units) Trend Analysis By Market Taxonomy, 2017 to 2021

    8.2. Market Size Value (US$ Million) & Volume (Units) Forecast By Market Taxonomy, 2022 to 2032

        8.2.1. By Country

            8.2.1.1. USA

            8.2.1.2. Canada

        8.2.2. By Type

        8.2.3. By Applications

    8.3. Market Attractiveness Analysis

        8.3.1. By Country

        8.3.2. By Type

        8.3.3. By Applications

    8.4. Key Takeaways

9. Latin America Market Analysis 2017 to 2021 and Forecast 2022 to 2032, By Country

    9.1. Historical Market Size Value (US$ Million) & Volume (Units) Trend Analysis By Market Taxonomy, 2017 to 2021

    9.2. Market Size Value (US$ Million) & Volume (Units) Forecast By Market Taxonomy, 2022 to 2032

        9.2.1. By Country

            9.2.1.1. Brazil

            9.2.1.2. Mexico

            9.2.1.3. Rest of Latin America

        9.2.2. By Type

        9.2.3. By Applications

    9.3. Market Attractiveness Analysis

        9.3.1. By Country

        9.3.2. By Type

        9.3.3. By Applications

    9.4. Key Takeaways

10. Europe Market Analysis 2017 to 2021 and Forecast 2022 to 2032, By Country

    10.1. Historical Market Size Value (US$ Million) & Volume (Units) Trend Analysis By Market Taxonomy, 2017 to 2021

    10.2. Market Size Value (US$ Million) & Volume (Units) Forecast By Market Taxonomy, 2022 to 2032

        10.2.1. By Country

            10.2.1.1. Germany

            10.2.1.2. United Kingdom

            10.2.1.3. France

            10.2.1.4. Spain

            10.2.1.5. Italy

            10.2.1.6. Rest of Europe

        10.2.2. By Type

        10.2.3. By Applications

    10.3. Market Attractiveness Analysis

        10.3.1. By Country

        10.3.2. By Type

        10.3.3. By Applications

    10.4. Key Takeaways

11. Asia Pacific Market Analysis 2017 to 2021 and Forecast 2022 to 2032, By Country

    11.1. Historical Market Size Value (US$ Million) & Volume (Units) Trend Analysis By Market Taxonomy, 2017 to 2021

    11.2. Market Size Value (US$ Million) & Volume (Units) Forecast By Market Taxonomy, 2022 to 2032

        11.2.1. By Country

            11.2.1.1. China

            11.2.1.2. Japan

            11.2.1.3. South Korea

            11.2.1.4. Malaysia

            11.2.1.5. Singapore

            11.2.1.6. Australia

            11.2.1.7. New Zealand

            11.2.1.8. Rest of Asia Pacific

        11.2.2. By Type

        11.2.3. By Applications

    11.3. Market Attractiveness Analysis

        11.3.1. By Country

        11.3.2. By Type

        11.3.3. By Applications

    11.4. Key Takeaways

12. Middle East and Africa Market Analysis 2017 to 2021 and Forecast 2022 to 2032, By Country

    12.1. Historical Market Size Value (US$ Million) & Volume (Units) Trend Analysis By Market Taxonomy, 2017 to 2021

    12.2. Market Size Value (US$ Million) & Volume (Units) Forecast By Market Taxonomy, 2022 to 2032

        12.2.1. By Country

            12.2.1.1. GCC Countries

            12.2.1.2. South Africa

            12.2.1.3. Israel

            12.2.1.4. Rest of Middle East and Africa

        12.2.2. By Type

        12.2.3. By Applications

    12.3. Market Attractiveness Analysis

        12.3.1. By Country

        12.3.2. By Type

        12.3.3. By Applications

    12.4. Key Takeaways

13. Key Countries Market Analysis

    13.1. USA

        13.1.1. Pricing Analysis

        13.1.2. Market Share Analysis, 2021

            13.1.2.1. By Type

            13.1.2.2. By Applications

    13.2. Canada

        13.2.1. Pricing Analysis

        13.2.2. Market Share Analysis, 2021

            13.2.2.1. By Type

            13.2.2.2. By Applications

    13.3. Brazil

        13.3.1. Pricing Analysis

        13.3.2. Market Share Analysis, 2021

            13.3.2.1. By Type

            13.3.2.2. By Applications

    13.4. Mexico

        13.4.1. Pricing Analysis

        13.4.2. Market Share Analysis, 2021

            13.4.2.1. By Type

            13.4.2.2. By Applications

    13.5. Germany

        13.5.1. Pricing Analysis

        13.5.2. Market Share Analysis, 2021

            13.5.2.1. By Type

            13.5.2.2. By Applications

    13.6. United Kingdom

        13.6.1. Pricing Analysis

        13.6.2. Market Share Analysis, 2021

            13.6.2.1. By Type

            13.6.2.2. By Applications

    13.7. France

        13.7.1. Pricing Analysis

        13.7.2. Market Share Analysis, 2021

            13.7.2.1. By Type

            13.7.2.2. By Applications

    13.8. Spain

        13.8.1. Pricing Analysis

        13.8.2. Market Share Analysis, 2021

            13.8.2.1. By Type

            13.8.2.2. By Applications

    13.9. Italy

        13.9.1. Pricing Analysis

        13.9.2. Market Share Analysis, 2021

            13.9.2.1. By Type

            13.9.2.2. By Applications

    13.10. China

        13.10.1. Pricing Analysis

        13.10.2. Market Share Analysis, 2021

            13.10.2.1. By Type

            13.10.2.2. By Applications

    13.11. Japan

        13.11.1. Pricing Analysis

        13.11.2. Market Share Analysis, 2021

            13.11.2.1. By Type

            13.11.2.2. By Applications

    13.12. South Korea

        13.12.1. Pricing Analysis

        13.12.2. Market Share Analysis, 2021

            13.12.2.1. By Type

            13.12.2.2. By Applications

    13.13. Malaysia

        13.13.1. Pricing Analysis

        13.13.2. Market Share Analysis, 2021

            13.13.2.1. By Type

            13.13.2.2. By Applications

    13.14. Singapore

        13.14.1. Pricing Analysis

        13.14.2. Market Share Analysis, 2021

            13.14.2.1. By Type

            13.14.2.2. By Applications

    13.15. Australia

        13.15.1. Pricing Analysis

        13.15.2. Market Share Analysis, 2021

            13.15.2.1. By Type

            13.15.2.2. By Applications

    13.16. New Zealand

        13.16.1. Pricing Analysis

        13.16.2. Market Share Analysis, 2021

            13.16.2.1. By Type

            13.16.2.2. By Applications

    13.17. GCC Countries

        13.17.1. Pricing Analysis

        13.17.2. Market Share Analysis, 2021

            13.17.2.1. By Type

            13.17.2.2. By Applications

    13.18. South Africa

        13.18.1. Pricing Analysis

        13.18.2. Market Share Analysis, 2021

            13.18.2.1. By Type

            13.18.2.2. By Applications

    13.19. Israel

        13.19.1. Pricing Analysis

        13.19.2. Market Share Analysis, 2021

            13.19.2.1. By Type

            13.19.2.2. By Applications

14. Market Structure Analysis

    14.1. Competition Dashboard

    14.2. Competition Benchmarking

    14.3. Market Share Analysis of Top Players

        14.3.1.  By Regional

        14.3.2.  By Type

        14.3.3.  By Applications

15. Competition Analysis

    15.1. Competition Deep Dive

        15.1.1. L3Harris Technologies, Inc.

            15.1.1.1. Overview

            15.1.1.2. Product Portfolio

            15.1.1.3. Profitability by Market Segments

            15.1.1.4. Sales Footprint

            15.1.1.5. Strategy Overview

                15.1.1.5.1. Marketing Strategy

                15.1.1.5.2. Product Strategy

                15.1.1.5.3. Channel Strategy

        15.1.2. API Technologies

            15.1.2.1. Overview

            15.1.2.2. Product Portfolio

            15.1.2.3. Profitability by Market Segments

            15.1.2.4. Sales Footprint

            15.1.2.5. Strategy Overview

                15.1.2.5.1. Marketing Strategy

                15.1.2.5.2. Product Strategy

                15.1.2.5.3. Channel Strategy

        15.1.3. Thales Group

            15.1.3.1. Overview

            15.1.3.2. Product Portfolio

            15.1.3.3. Profitability by Market Segments

            15.1.3.4. Sales Footprint

            15.1.3.5. Strategy Overview

                15.1.3.5.1. Marketing Strategy

                15.1.3.5.2. Product Strategy

                15.1.3.5.3. Channel Strategy

        15.1.4. Electron Energy Corporation

            15.1.4.1. Overview

            15.1.4.2. Product Portfolio

            15.1.4.3. Profitability by Market Segments

            15.1.4.4. Sales Footprint

            15.1.4.5. Strategy Overview

                15.1.4.5.1. Marketing Strategy

                15.1.4.5.2. Product Strategy

                15.1.4.5.3. Channel Strategy

        15.1.5. CableFree

            15.1.5.1. Overview

            15.1.5.2. Product Portfolio

            15.1.5.3. Profitability by Market Segments

            15.1.5.4. Sales Footprint

            15.1.5.5. Strategy Overview

                15.1.5.5.1. Marketing Strategy

                15.1.5.5.2. Product Strategy

                15.1.5.5.3. Channel Strategy

        15.1.6. Teledyne Technologies

            15.1.6.1. Overview

            15.1.6.2. Product Portfolio

            15.1.6.3. Profitability by Market Segments

            15.1.6.4. Sales Footprint

            15.1.6.5. Strategy Overview

                15.1.6.5.1. Marketing Strategy

                15.1.6.5.2. Product Strategy

                15.1.6.5.3. Channel Strategy

        15.1.7. Toshiba Corporation

            15.1.7.1. Overview

            15.1.7.2. Product Portfolio

            15.1.7.3. Profitability by Market Segments

            15.1.7.4. Sales Footprint

            15.1.7.5. Strategy Overview

                15.1.7.5.1. Marketing Strategy

                15.1.7.5.2. Product Strategy

                15.1.7.5.3. Channel Strategy

        15.1.8. Communications & Power Industries LLC

            15.1.8.1. Overview

            15.1.8.2. Product Portfolio

            15.1.8.3. Profitability by Market Segments

            15.1.8.4. Sales Footprint

            15.1.8.5. Strategy Overview

                15.1.8.5.1. Marketing Strategy

                15.1.8.5.2. Product Strategy

                15.1.8.5.3. Channel Strategy

        15.1.9. Cytec Corporation

            15.1.9.1. Overview

            15.1.9.2. Product Portfolio

            15.1.9.3. Profitability by Market Segments

            15.1.9.4. Sales Footprint

            15.1.9.5. Strategy Overview

                15.1.9.5.1. Marketing Strategy

                15.1.9.5.2. Product Strategy

                15.1.9.5.3. Channel Strategy

        15.1.10. TMD Technologies Ltd.

            15.1.10.1. Overview

            15.1.10.2. Product Portfolio

            15.1.10.3. Profitability by Market Segments

            15.1.10.4. Sales Footprint

            15.1.10.5. Strategy Overview

                15.1.10.5.1. Marketing Strategy

                15.1.10.5.2. Product Strategy

                15.1.10.5.3. Channel Strategy

16. Assumptions & Acronyms Used

17. Research Methodology

List of Tables

Table 1: Global Market Value (US$ Million) Forecast by Region, 2017 to 2032

Table 2: Global Market Volume (Units) Forecast by Region, 2017 to 2032

Table 3: Global Market Value (US$ Million) Forecast by Type, 2017 to 2032

Table 4: Global Market Volume (Units) Forecast by Type, 2017 to 2032

Table 5: Global Market Value (US$ Million) Forecast by Applications, 2017 to 2032

Table 6: Global Market Volume (Units) Forecast by Applications, 2017 to 2032

Table 7: North America Market Value (US$ Million) Forecast by Country, 2017 to 2032

Table 8: North America Market Volume (Units) Forecast by Country, 2017 to 2032

Table 9: North America Market Value (US$ Million) Forecast by Type, 2017 to 2032

Table 10: North America Market Volume (Units) Forecast by Type, 2017 to 2032

Table 11: North America Market Value (US$ Million) Forecast by Applications, 2017 to 2032

Table 12: North America Market Volume (Units) Forecast by Applications, 2017 to 2032

Table 13: Latin America Market Value (US$ Million) Forecast by Country, 2017 to 2032

Table 14: Latin America Market Volume (Units) Forecast by Country, 2017 to 2032

Table 15: Latin America Market Value (US$ Million) Forecast by Type, 2017 to 2032

Table 16: Latin America Market Volume (Units) Forecast by Type, 2017 to 2032

Table 17: Latin America Market Value (US$ Million) Forecast by Applications, 2017 to 2032

Table 18: Latin America Market Volume (Units) Forecast by Applications, 2017 to 2032

Table 19: Europe Market Value (US$ Million) Forecast by Country, 2017 to 2032

Table 20: Europe Market Volume (Units) Forecast by Country, 2017 to 2032

Table 21: Europe Market Value (US$ Million) Forecast by Type, 2017 to 2032

Table 22: Europe Market Volume (Units) Forecast by Type, 2017 to 2032

Table 23: Europe Market Value (US$ Million) Forecast by Applications, 2017 to 2032

Table 24: Europe Market Volume (Units) Forecast by Applications, 2017 to 2032

Table 25: Asia Pacific Market Value (US$ Million) Forecast by Country, 2017 to 2032

Table 26: Asia Pacific Market Volume (Units) Forecast by Country, 2017 to 2032

Table 27: Asia Pacific Market Value (US$ Million) Forecast by Type, 2017 to 2032

Table 28: Asia Pacific Market Volume (Units) Forecast by Type, 2017 to 2032

Table 29: Asia Pacific Market Value (US$ Million) Forecast by Applications, 2017 to 2032

Table 30: Asia Pacific Market Volume (Units) Forecast by Applications, 2017 to 2032

Table 31: Middle East and Africa Market Value (US$ Million) Forecast by Country, 2017 to 2032

Table 32: Middle East and Africa Market Volume (Units) Forecast by Country, 2017 to 2032

Table 33: Middle East and Africa Market Value (US$ Million) Forecast by Type, 2017 to 2032

Table 34: Middle East and Africa Market Volume (Units) Forecast by Type, 2017 to 2032

Table 35: Middle East and Africa Market Value (US$ Million) Forecast by Applications, 2017 to 2032

Table 36: Middle East and Africa Market Volume (Units) Forecast by Applications, 2017 to 2032

List of Charts

Figure 1: Global Market Value (US$ Million) by Type, 2022 to 2032

Figure 2: Global Market Value (US$ Million) by Applications, 2022 to 2032

Figure 3: Global Market Value (US$ Million) by Region, 2022 to 2032

Figure 4: Global Market Value (US$ Million) Analysis by Region, 2017 to 2032

Figure 5: Global Market Volume (Units) Analysis by Region, 2017 to 2032

Figure 6: Global Market Value Share (%) and BPS Analysis by Region, 2022 to 2032

Figure 7: Global Market Y-o-Y Growth (%) Projections by Region, 2022 to 2032

Figure 8: Global Market Value (US$ Million) Analysis by Type, 2017 to 2032

Figure 9: Global Market Volume (Units) Analysis by Type, 2017 to 2032

Figure 10: Global Market Value Share (%) and BPS Analysis by Type, 2022 to 2032

Figure 11: Global Market Y-o-Y Growth (%) Projections by Type, 2022 to 2032

Figure 12: Global Market Value (US$ Million) Analysis by Applications, 2017 to 2032

Figure 13: Global Market Volume (Units) Analysis by Applications, 2017 to 2032

Figure 14: Global Market Value Share (%) and BPS Analysis by Applications, 2022 to 2032

Figure 15: Global Market Y-o-Y Growth (%) Projections by Applications, 2022 to 2032

Figure 16: Global Market Attractiveness by Type, 2022 to 2032

Figure 17: Global Market Attractiveness by Applications, 2022 to 2032

Figure 18: Global Market Attractiveness by Region, 2022 to 2032

Figure 19: North America Market Value (US$ Million) by Type, 2022 to 2032

Figure 20: North America Market Value (US$ Million) by Applications, 2022 to 2032

Figure 21: North America Market Value (US$ Million) by Country, 2022 to 2032

Figure 22: North America Market Value (US$ Million) Analysis by Country, 2017 to 2032

Figure 23: North America Market Volume (Units) Analysis by Country, 2017 to 2032

Figure 24: North America Market Value Share (%) and BPS Analysis by Country, 2022 to 2032

Figure 25: North America Market Y-o-Y Growth (%) Projections by Country, 2022 to 2032

Figure 26: North America Market Value (US$ Million) Analysis by Type, 2017 to 2032

Figure 27: North America Market Volume (Units) Analysis by Type, 2017 to 2032

Figure 28: North America Market Value Share (%) and BPS Analysis by Type, 2022 to 2032

Figure 29: North America Market Y-o-Y Growth (%) Projections by Type, 2022 to 2032

Figure 30: North America Market Value (US$ Million) Analysis by Applications, 2017 to 2032

Figure 31: North America Market Volume (Units) Analysis by Applications, 2017 to 2032

Figure 32: North America Market Value Share (%) and BPS Analysis by Applications, 2022 to 2032

Figure 33: North America Market Y-o-Y Growth (%) Projections by Applications, 2022 to 2032

Figure 34: North America Market Attractiveness by Type, 2022 to 2032

Figure 35: North America Market Attractiveness by Applications, 2022 to 2032

Figure 36: North America Market Attractiveness by Country, 2022 to 2032

Figure 37: Latin America Market Value (US$ Million) by Type, 2022 to 2032

Figure 38: Latin America Market Value (US$ Million) by Applications, 2022 to 2032

Figure 39: Latin America Market Value (US$ Million) by Country, 2022 to 2032

Figure 40: Latin America Market Value (US$ Million) Analysis by Country, 2017 to 2032

Figure 41: Latin America Market Volume (Units) Analysis by Country, 2017 to 2032

Figure 42: Latin America Market Value Share (%) and BPS Analysis by Country, 2022 to 2032

Figure 43: Latin America Market Y-o-Y Growth (%) Projections by Country, 2022 to 2032

Figure 44: Latin America Market Value (US$ Million) Analysis by Type, 2017 to 2032

Figure 45: Latin America Market Volume (Units) Analysis by Type, 2017 to 2032

Figure 46: Latin America Market Value Share (%) and BPS Analysis by Type, 2022 to 2032

Figure 47: Latin America Market Y-o-Y Growth (%) Projections by Type, 2022 to 2032

Figure 48: Latin America Market Value (US$ Million) Analysis by Applications, 2017 to 2032

Figure 49: Latin America Market Volume (Units) Analysis by Applications, 2017 to 2032

Figure 50: Latin America Market Value Share (%) and BPS Analysis by Applications, 2022 to 2032

Figure 51: Latin America Market Y-o-Y Growth (%) Projections by Applications, 2022 to 2032

Figure 52: Latin America Market Attractiveness by Type, 2022 to 2032

Figure 53: Latin America Market Attractiveness by Applications, 2022 to 2032

Figure 54: Latin America Market Attractiveness by Country, 2022 to 2032

Figure 55: Europe Market Value (US$ Million) by Type, 2022 to 2032

Figure 56: Europe Market Value (US$ Million) by Applications, 2022 to 2032

Figure 57: Europe Market Value (US$ Million) by Country, 2022 to 2032

Figure 58: Europe Market Value (US$ Million) Analysis by Country, 2017 to 2032

Figure 59: Europe Market Volume (Units) Analysis by Country, 2017 to 2032

Figure 60: Europe Market Value Share (%) and BPS Analysis by Country, 2022 to 2032

Figure 61: Europe Market Y-o-Y Growth (%) Projections by Country, 2022 to 2032

Figure 62: Europe Market Value (US$ Million) Analysis by Type, 2017 to 2032

Figure 63: Europe Market Volume (Units) Analysis by Type, 2017 to 2032

Figure 64: Europe Market Value Share (%) and BPS Analysis by Type, 2022 to 2032

Figure 65: Europe Market Y-o-Y Growth (%) Projections by Type, 2022 to 2032

Figure 66: Europe Market Value (US$ Million) Analysis by Applications, 2017 to 2032

Figure 67: Europe Market Volume (Units) Analysis by Applications, 2017 to 2032

Figure 68: Europe Market Value Share (%) and BPS Analysis by Applications, 2022 to 2032

Figure 69: Europe Market Y-o-Y Growth (%) Projections by Applications, 2022 to 2032

Figure 70: Europe Market Attractiveness by Type, 2022 to 2032

Figure 71: Europe Market Attractiveness by Applications, 2022 to 2032

Figure 72: Europe Market Attractiveness by Country, 2022 to 2032

Figure 73: Asia Pacific Market Value (US$ Million) by Type, 2022 to 2032

Figure 74: Asia Pacific Market Value (US$ Million) by Applications, 2022 to 2032

Figure 75: Asia Pacific Market Value (US$ Million) by Country, 2022 to 2032

Figure 76: Asia Pacific Market Value (US$ Million) Analysis by Country, 2017 to 2032

Figure 77: Asia Pacific Market Volume (Units) Analysis by Country, 2017 to 2032

Figure 78: Asia Pacific Market Value Share (%) and BPS Analysis by Country, 2022 to 2032

Figure 79: Asia Pacific Market Y-o-Y Growth (%) Projections by Country, 2022 to 2032

Figure 80: Asia Pacific Market Value (US$ Million) Analysis by Type, 2017 to 2032

Figure 81: Asia Pacific Market Volume (Units) Analysis by Type, 2017 to 2032

Figure 82: Asia Pacific Market Value Share (%) and BPS Analysis by Type, 2022 to 2032

Figure 83: Asia Pacific Market Y-o-Y Growth (%) Projections by Type, 2022 to 2032

Figure 84: Asia Pacific Market Value (US$ Million) Analysis by Applications, 2017 to 2032

Figure 85: Asia Pacific Market Volume (Units) Analysis by Applications, 2017 to 2032

Figure 86: Asia Pacific Market Value Share (%) and BPS Analysis by Applications, 2022 to 2032

Figure 87: Asia Pacific Market Y-o-Y Growth (%) Projections by Applications, 2022 to 2032

Figure 88: Asia Pacific Market Attractiveness by Type, 2022 to 2032

Figure 89: Asia Pacific Market Attractiveness by Applications, 2022 to 2032

Figure 90: Asia Pacific Market Attractiveness by Country, 2022 to 2032

Figure 91: Middle East and Africa Market Value (US$ Million) by Type, 2022 to 2032

Figure 92: Middle East and Africa Market Value (US$ Million) by Applications, 2022 to 2032

Figure 93: Middle East and Africa Market Value (US$ Million) by Country, 2022 to 2032

Figure 94: Middle East and Africa Market Value (US$ Million) Analysis by Country, 2017 to 2032

Figure 95: Middle East and Africa Market Volume (Units) Analysis by Country, 2017 to 2032

Figure 96: Middle East and Africa Market Value Share (%) and BPS Analysis by Country, 2022 to 2032

Figure 97: Middle East and Africa Market Y-o-Y Growth (%) Projections by Country, 2022 to 2032

Figure 98: Middle East and Africa Market Value (US$ Million) Analysis by Type, 2017 to 2032

Figure 99: Middle East and Africa Market Volume (Units) Analysis by Type, 2017 to 2032

Figure 100: Middle East and Africa Market Value Share (%) and BPS Analysis by Type, 2022 to 2032

Figure 101: Middle East and Africa Market Y-o-Y Growth (%) Projections by Type, 2022 to 2032

Figure 102: Middle East and Africa Market Value (US$ Million) Analysis by Applications, 2017 to 2032

Figure 103: Middle East and Africa Market Volume (Units) Analysis by Applications, 2017 to 2032

Figure 104: Middle East and Africa Market Value Share (%) and BPS Analysis by Applications, 2022 to 2032

Figure 105: Middle East and Africa Market Y-o-Y Growth (%) Projections by Applications, 2022 to 2032

Figure 106: Middle East and Africa Market Attractiveness by Type, 2022 to 2032

Figure 107: Middle East and Africa Market Attractiveness by Applications, 2022 to 2032

Figure 108: Middle East and Africa Market Attractiveness by Country, 2022 to 2032

Recommendations

Technology

Microwave Monolithic Integrated Circuits Market

Published : June 2023

Technology

Point-to-point Microwave Antenna Market

Published : February 2023

Technology

Microwave Backhaul System Market

Published : June 2022

Explore Technology Insights

View Reports