Reports

- Global Locations -

Headquarters

Future Market Insights, Inc.

Christiana Corporate, 200
Continental Drive, Suite 401,
Newark, Delaware - 19713,
United States

T: +1-845-579-5705

Americas

Future Market Insights, Inc.

616 Corporate Way, Suite 2-9018,
Valley Cottage, NY 10989, United States

T: +1-347-918-3531

MEA

Future Market Insights

1602-6 Jumeirah Bay X2 Tower, Plot No: JLT-PH2-X2A,
Jumeirah Lakes Towers, Dubai,
United Arab Emirates

Europe

Future Market Insights

3rd Floor, 207 Regent Street,
W1B 3HH London
United Kingdom

T: + 44 (0) 20 8123 9659
D: +44 (0) 20 3287 4268

Asia Pacific

Future Market Insights

IndiaLand Global Tech Park, Unit UG-1, Behind Grand HighStreet, Phase 1, Hinjawadi, MH, Pune – 411057, India

Medical Device Packaging Market Outlook

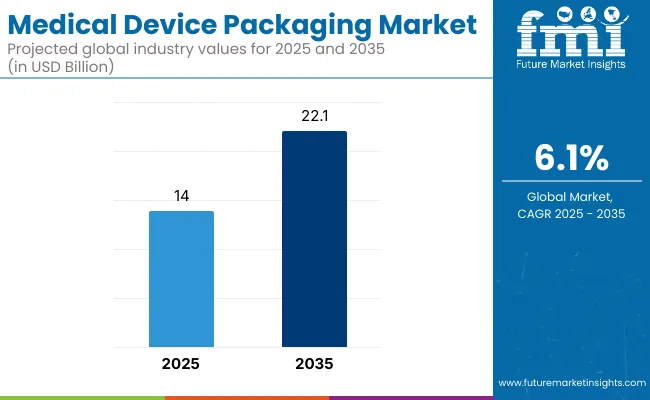
Global sales revenue of the medical device packaging market is projected to be US$ 38.57 billion in 2023. The market is slated to increase at a CAGR of 5.4% to reach a valuation of US$ 65.26 billion by 2033.

The global medical device packaging business has witnessed impressive growth over the past few years due to increasing demand from the medical devices sector. This is coupled with growing expenditure on healthcare by key economies. The rising demand for easy-to-use and easy-to-dispose packaging solutions is also contributing to the growth of the global medical device packaging market.

  • Industries strive to reduce their environmental footprint and follow the regulation of waste management. Demand for easy-to-dispose packaging solutions is likely to increase in the coming years.
  • The bulk of medical waste is made up of single-use medical gadgets and their packaging, which is damaging the environment if not properly disposed of. Easy-to-dispose-of packaging options, such as compostable or biodegradable packaging, are becoming increasingly popular. Since they provide a more environmentally friendly option to conventional packaging materials.
  • These options help decrease the load on waste management systems and are reasonably priced. Easy-to-dispose-of packaging is anticipated to become the norm in the medical device packaging business. As demand for eco-friendly packaging solutions rises.

There is a high demand for packaging solutions that maintain the product and the package integrity throughout the cycle. This need for protection is anticipated to play a key role in driving the growth of global medical device packaging.

Due to all these factors, the market is likely to expect a growth rate of 1.05x between 2022 and 2023.

Attributes Details
Expected Market CAGR (2023 to 2033) 5.4%
Expected Market Size (2023) US$ 38.57 billion
Expected Market Size (2033) US$ 65.26 billion

Don't pay for what you don't need

Customize your report by selecting specific countries or regions and save 30%!

Medical Device Packaging Demand Analysis (2018 to 2022) Vs Market Outlook (2023 to 2033)

Demand for medical device packaging is gaining traction, particularly in the advanced economies of Asia, North America, and Europe. A trend fueling the sales of medical device packaging is the introduction of anti-counterfeit packaging. Also, the market is witnessing a shifting trend of packaging materials from glass to plastics.

Attributes Details
Market CAGR (2018 to 2022) 4.7%
Market CAGR (2023 to 2033) 5.4%
Market Size (2018) US$ 30.44 billion
Market Size (2022) US$ 36.59 billion
Market Size (2026) US$ 45.16 billion

Consumption of global medical device packaging is expected to be pegged at 206 billion units by 2027.

Even though the growth rate is quite moderate, over the long term, it is anticipated that the revenue threshold is likely to rise. In recent years, especially in developed nations, unhealthy lifestyles have contributed to the increasing prevalence of chronic diseases. This includes:

  • Heart disease
  • Cancer
  • Diabetes
  • Stroke
  • Arthritis

Over the past four years, the adoption of medical devices has grown as a result of the aforementioned disorders. This requires various pieces of medical equipment for diagnosis and treatment.

What Factors Need to Take Care of the Medical Device Packaging Industry?

A sterile environment is created for the contents of medical device packaging, and this sterility must be preserved until the box is opened for use. A medical equipment or surgical instrument must come into contact with a patient's sterile tissue or mucous membranes during all interference operations.

The introduction of harmful germs that could result in infection is a serious concern associated with all such techniques. To avoid a breach of the host defenses, reusable medical equipment must be cleansed or sterilized before use. As a result, a crucial component of the use of medical equipment is the degree of disinfection or sterilization of the object's intended use.

Ismail Sutaria
Ismail Sutaria

Principal Consultant

Talk to Analyst

Find your sweet spots for generating winning opportunities in this market.

Comparative View of the Market

Medical Device Packaging Market:

Attributes Medical Device Packaging Market
CAGR (2023 to 2033) 5.4%
Market Value (2033) US$ 65.26 billion
Growth Factor Need for easy-to-dispose packaging
Opportunity Growing prevalence of chronic disease
Trends The shifting trend from glass to plastics

Medical Device Secondary Packaging Market:

Attributes Medical Device Secondary Packaging Market
CAGR (2023 to 2033) 6.1%
Market Value (2033) US$ 20.9 billion
Growth Factor Rising demand for minimally invasive surgery
Opportunity Advancements in medical technology
Trends Surging awareness of proper packaging

Portable Medical Devices Market:

Attributes Portable Medical Devices Market
CAGR (2023 to 2033) 10.7%
Market Value (2033) US$ 163.84 billion
Growth Factor Rising adoption of wearable devices
Opportunity Emerging wireless technologies
Trends Surging need for real-time monitoring

Category Analysis

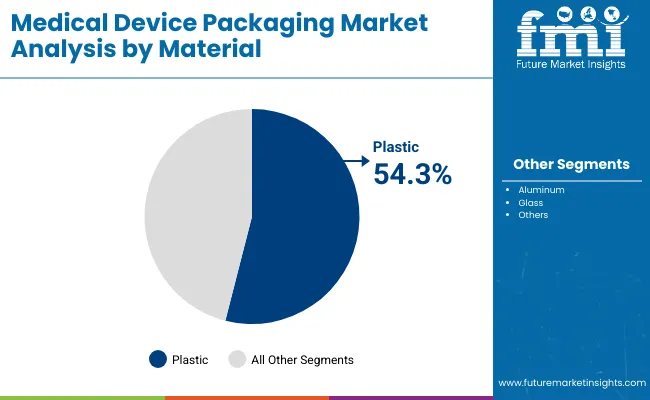
  • Based on raw material, PE is the widely preferred material, followed by paper laminates. When it comes to guarding against oxygen, moisture, and light, aluminum proves to be the very first choice.
  • Plastics show significant growth in the market. It is a universal fact that plastics happen to have better aesthetics. In other words, plastics are visible in every form, right from clear to opaque. Plus, they are highly durable, versatile, hygienic, and safe. Lightweightness and cost-friendliness are the other factors favoring plastics.
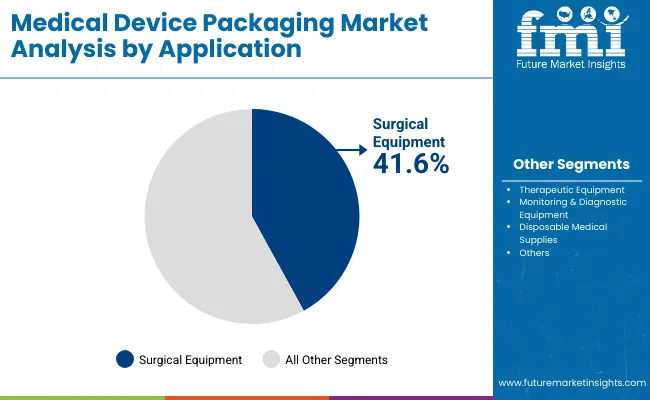
  • Among the applications, the disposable consumables segment is expected to continue with its dominance, both in terms of value and volume. Besides, implantable devices are an upcoming field, wherein secure packaging is the key. Though aesthetic implants were deeply affected amidst the pandemic, the situation prevailing is expected to boost the market toward growth. As normalcy is looking to be restored.

Which Packaging Type Has an Excellent Future in the Market?

In 2022, clamshell blister packs held the top market share of 33.8%. Nonetheless, among the various packaging options, bags and pouches represent a significant portion of the worldwide medical device packaging industry. Medical devices can be stored and handled easily thanks to their small size and high product-to-package ratio.

When made using the right materials, such as PET and LLDPE, pouches and bags can shield electronic equipment from gasses, moisture, and light. Medical device packaging and related components must adhere to strict regulations and specifications.

Boxes are expected to have a substantial market throughout the projected period. Since they are frequently used for the secure transportation and packaging of medical devices.

Medical Manufacturing Revolutionizing the Global Industry

By end users, medical manufacturing dominated the market with a share of 42.% in 2022. However, contract packaging is expected to emerge as a lucrative segment of growth in terms of CAGR.

For instance, MedAccred said in May 2020 that it aims to keep supporting the medical device sector. In the past year, the company has recognized a huge amount of new suppliers and established new audit methods for sterile device packaging and plastics mechanical assembly.

The Medical Manufacturers MedAccred Accreditation Pathway entered its second year. A partnership between the program and the United States Department of Commerce for manufacturers and suppliers seeking accreditation.

Get the data you need at a Fraction of the cost

Personalize your report by choosing insights you need
and save 40%!

Regional Analysis

What is the Scope of Medical Device Packaging Growth in the North America Market?

Due to its thriving healthcare industry and plenty of organizations serving the sector, North America held the leading share of 31.5% in 2022. The United States enjoys a competitive advantage that leads to high production levels of medical devices.

This relates to the creation of software, the use of instruments, technology, and sizable financial commitments to the field of research and development. Around 29.5% of the North America medical devices packaging market is held by the United States alone.

The interim order regarding the import and sale of medical devices for use regarding COVID-19 in Canada was approved by the Federal Minister of Health in March 2020. By the temporary measure, Health Canada permits the sale of selected products in Canada. Provided that the packaging satisfies all applicable regulations.

Is Europe Able to Meet the Industry's Demand for Medical Device Packaging?

Country Market Share/CAGR
Germany (2022) 8.1%
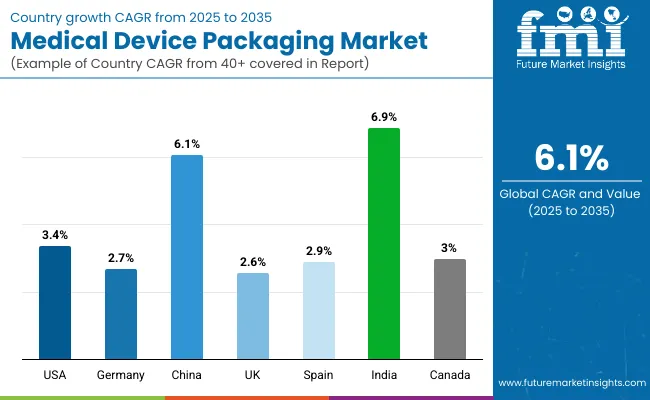
United Kingdom CAGR (2023 to 2033) 5.7%
  • In 2022, Europe held the second-leading share with more than 27.2%. In 2023, the United Kingdom is likely to overtake Germany as a key market.
  • The nation is distinguished by the existence of numerous reputable device-manufacturing businesses that compete in both the domestic and global markets.
  • The United Kingdom is a leader in medical technology innovation and is a key exporter of medical products on a global scale.

How Asia Pacific Contributes to the Medical Device Packaging Industry?

Country CAGR (2023 to 2033)
India 7.5%
China 6.6%

Asia Pacific is anticipated to experience adequate growth by 2033. China is one of the key markets for medical equipment in the world and a country with significant economic growth in Asia Pacific. The healthcare sector is receiving a lot of investment as a result of China's economic growth. In the upcoming years, it is anticipated that China's healthcare sector is likely to flourish further.

How Manufacturers can Expand Their Base in the Medical Device Packaging Sector?

  • Established manufacturers can increase the range of their products if they want to stay competitive. To establish their USP, they can provide medical packaging for implants and diagnostic tools.
  • Medical device manufacturers must make sure that they adhere to all regulations and maintain quality, as the industry is highly regulated. By doing this, they can establish a name for themselves in the sector.
  • The market is likely to gain from their geographic expansion. To make huge profits, they must expand to new areas and analyze the patterns of demand.
  • In the industry under study, new businesses are coming up with creative ways to identify medical devices efficiently.
    • For instance, the Vault device packaging solution from CleanCut Technologies works well with tray-style packaging. By using the same techniques for identical medical devices with a few minor tweaks. Packaging businesses can cut down on validation time and ultimately produce smaller batch sizes that adhere to customer specifications.
    • The use of NFC and RFID tags in packaging materials is anticipated to be encouraged by counterfeiting, a clear issue with medical products.
  • The sterile instruments market is being propelled by an increase in hospitals, therapeutic equipment producers, and diagnostic facilities. Manufacturers must adapt their packaging designs frequently to meet evolving end-user needs and new medical device advancements, to keep up with these developments.

How do International Businesses Compete in the Medical Device Packaging Sector?

Leading corporations frequently buy rival businesses to diversify their product offerings and boost production capacity. Throughout the forecast period, there are few new concepts and innovations introduced due to the existence of publicly recognized multinational companies in the market area.

In the struggle against the players on the global market, smaller and privately held companies are far behind in terms of revenue generation. Medical device packaging start-ups must be prepared and adapt to previous and present trends. To make their future business plans if they want to develop a significant market presence.

Key players in the medical device packaging market are continuously susceptible to developments. This is used as a foundation for participating in inorganic or organic forms of expansion.

  • Amcor, in April 2020, did produce ultra packaging for hydrogen-sterilized products. Steam preservation was also a part of this packaging. The standard requirement of SBS (Sterile Barrier System) is being adhered to.
  • Wipak, in November 2019, came up with pouching material that is at a lesser risk of wastage or spoilage at the time of transportation and warehousing. It consists of 9 layers in all.

Key Players

  • Avery Dennison Corporation
  • 3M Company
  • E.I. du Pont de Nemours and Company
  • CCL Industries Inc.
  • Amcor Limited
  • Constantia Flexibles Group GmbH
  • Bemis Company, Inc
  • Sonoco Company
  • WestRock Company

KeySegments

By Packaging Type:

  • Bags & Pouches
  • Containers
  • Trays
  • Stick Packs
  • Clamshell Blister Packs
  • Boxes
  • Others (Flow Wraps etc.)

By Raw Material:

  • PE
    • HDPE
    • LDPE
    • LLDPE
  • PET
  • PP
  • PS
  • PVC
  • Aluminum
  • Glass
  • Paper Laminates
  • Fabric
  • Others (PLA, PHA, etc.)

By Application:

  • Disposable Consumables
  • Monitoring & Diagnostic Equipment
  • Therapeutic Equipment

By End-use Industry:

  • Medical Manufacturing
  • Contract Packaging
  • Others

By Region:

  • North America
  • Latin America
  • Europe
  • East Asia
  • South Asia
  • Oceania
  • The Middle East & Africa (MEA)

Frequently Asked Questions

How Much is the Medical Device Packaging Market Worth?

The medical device packaging market is estimated to be worth US$ 38.57 billion in 2023.

What is the Demand Outlook for the Medical Device Packaging Market?

The medical device packaging market is expected to have a CAGR of 5.4% during the forecast period.

What is the Historical Share of the Medical Device Packaging Market?

The medical device packaging market expanded to a share of US$ 36.59 billion in 2022.

What is the North America Medical Device Packaging Market Outlook?

North America's medical device packaging market is likely to account for a share of 31.5% in 2023.

What is the United Kingdom Medical Device Packaging Market Outlook?

By 2033, it is anticipated that the medical device packaging sector in the United Kingdom experience a CAGR of 5.7%.

Table of Content

1. Executive Summary | Medical Device Packaging Market 

    1.1. Global Market Outlook

    1.2. Demand-side Trends

    1.3. Supply-side Trends

    1.4. Technology Roadmap Analysis

    1.5. Analysis and Recommendations

2. Market Overview

    2.1. Market Coverage / Taxonomy

    2.2. Market Definition / Scope / Limitations

3. Market Background

    3.1. Market Dynamics

        3.1.1. Drivers

        3.1.2. Restraints

        3.1.3. Opportunity

        3.1.4. Trends

    3.2. Scenario Forecast

        3.2.1. Demand in Optimistic Scenario

        3.2.2. Demand in Likely Scenario

        3.2.3. Demand in Conservative Scenario

    3.3. Opportunity Map Analysis

    3.4. Product Life Cycle Analysis

    3.5. Supply Chain Analysis

        3.5.1. Supply Side Participants and their Roles

            3.5.1.1. Producers

            3.5.1.2. Mid-Level Participants (Traders/ Agents/ Brokers)

            3.5.1.3. Wholesalers and Distributors

        3.5.2. Value Added and Value Created at Node in the Supply Chain

        3.5.3. List of Raw Material Suppliers

        3.5.4. List of Existing and Potential Buyer’s

    3.6. Investment Feasibility Matrix

    3.7. Value Chain Analysis

        3.7.1. Profit Margin Analysis

        3.7.2. Wholesalers and Distributors

        3.7.3. Retailers

    3.8. PESTLE and Porter’s Analysis

    3.9. Regulatory Landscape

        3.9.1. By Key Regions

        3.9.2. By Key Countries

    3.10. Regional Parent Market Outlook

    3.11. Production and Consumption Statistics

    3.12. Import and Export Statistics

4. Global Market Analysis 2018 to 2022 and Forecast, 2023 to 2033

    4.1. Historical Market Size Value (US$ Million) & Volume (Units) Analysis, 2018 to 2022

    4.2. Current and Future Market Size Value (US$ Million) & Volume (Units) Projections, 2023 to 2033

        4.2.1. Y-o-Y Growth Trend Analysis

        4.2.2. Absolute $ Opportunity Analysis

5. Global Market Analysis 2018 to 2022 and Forecast 2023 to 2033, By Packaging Type

    5.1. Introduction / Key Findings

    5.2. Historical Market Size Value (US$ Million) & Volume (Units) Analysis By Packaging Type, 2018 to 2022

    5.3. Current and Future Market Size Value (US$ Million) & Volume (Units) Analysis and Forecast By Packaging Type, 2023 to 2033

        5.3.1. Bags & Pouches

        5.3.2. Containers

        5.3.3. Trays

        5.3.4. Stick Packs

        5.3.5. Clamshell Blister Packs

        5.3.6. Boxes

        5.3.7. Others

    5.4. Y-o-Y Growth Trend Analysis By Packaging Type, 2018 to 2022

    5.5. Absolute $ Opportunity Analysis By Packaging Type, 2023 to 2033

6. Global Market Analysis 2018 to 2022 and Forecast 2023 to 2033, By Raw Material

    6.1. Introduction / Key Findings

    6.2. Historical Market Size Value (US$ Million) & Volume (Units) Analysis By Raw Material, 2018 to 2022

    6.3. Current and Future Market Size Value (US$ Million) & Volume (Units) Analysis and Forecast By Raw Material, 2023 to 2033

        6.3.1. PE

            6.3.1.1. HDPE

            6.3.1.2. LDPE

            6.3.1.3. LLDPE

        6.3.2. PET

        6.3.3. PP

        6.3.4. PS

        6.3.5. PVC

        6.3.6. Aluminium

        6.3.7. Glass

        6.3.8. Paper Laminates

        6.3.9. Fabric

        6.3.10. Others

    6.4. Y-o-Y Growth Trend Analysis By Raw Material, 2018 to 2022

    6.5. Absolute $ Opportunity Analysis By Raw Material, 2023 to 2033

7. Global Market Analysis 2018 to 2022 and Forecast 2023 to 2033, By Application

    7.1. Introduction / Key Findings

    7.2. Historical Market Size Value (US$ Million) & Volume (Units) Analysis By Application, 2018 to 2022

    7.3. Current and Future Market Size Value (US$ Million) & Volume (Units) Analysis and Forecast By Application, 2023 to 2033

        7.3.1. Disposable Consumables

        7.3.2. Monitoring & Diagnostic Equipment

        7.3.3. Therapeutic Equipment

    7.4. Y-o-Y Growth Trend Analysis By Application, 2018 to 2022

    7.5. Absolute $ Opportunity Analysis By Application, 2023 to 2033

8. Global Market Analysis 2018 to 2022 and Forecast 2023 to 2033, By End-user

    8.1. Introduction / Key Findings

    8.2. Historical Market Size Value (US$ Million) & Volume (Units) Analysis By End-user, 2018 to 2022

    8.3. Current and Future Market Size Value (US$ Million) & Volume (Units) Analysis and Forecast By End-user, 2023 to 2033

        8.3.1. Medical Manufacturing

        8.3.2. Contract Packaging

        8.3.3. Others

    8.4. Y-o-Y Growth Trend Analysis By End-user, 2018 to 2022

    8.5. Absolute $ Opportunity Analysis By End-user, 2023 to 2033

9. Global Market Analysis 2018 to 2022 and Forecast 2023 to 2033, By Region

    9.1. Introduction

    9.2. Historical Market Size Value (US$ Million) & Volume (Units) Analysis By Region, 2018 to 2022

    9.3. Current Market Size Value (US$ Million) & Volume (Units) Analysis and Forecast By Region, 2023 to 2033

        9.3.1. North America

        9.3.2. Latin America

        9.3.3. Europe

        9.3.4. Asia Pacific

        9.3.5. MEA

    9.4. Market Attractiveness Analysis By Region

10. North America Market Analysis 2018 to 2022 and Forecast 2023 to 2033, By Country

    10.1. Historical Market Size Value (US$ Million) & Volume (Units) Trend Analysis By Market Taxonomy, 2018 to 2022

    10.2. Market Size Value (US$ Million) & Volume (Units) Forecast By Market Taxonomy, 2023 to 2033

        10.2.1. By Country

            10.2.1.1. The USA

            10.2.1.2. Canada

        10.2.2. By Packaging Type

        10.2.3. By Raw Material

        10.2.4. By Application

        10.2.5. By End-user

    10.3. Market Attractiveness Analysis

        10.3.1. By Country

        10.3.2. By Packaging Type

        10.3.3. By Raw Material

        10.3.4. By Application

        10.3.5. By End-user

    10.4. Key Takeaways

11. Latin America Market Analysis 2018 to 2022 and Forecast 2023 to 2033, By Country

    11.1. Historical Market Size Value (US$ Million) & Volume (Units) Trend Analysis By Market Taxonomy, 2018 to 2022

    11.2. Market Size Value (US$ Million) & Volume (Units) Forecast By Market Taxonomy, 2023 to 2033

        11.2.1. By Country

            11.2.1.1. Brazil

            11.2.1.2. Mexico

            11.2.1.3. Rest of Latin America

        11.2.2. By Packaging Type

        11.2.3. By Raw Material

        11.2.4. By Application

        11.2.5. By End-user

    11.3. Market Attractiveness Analysis

        11.3.1. By Country

        11.3.2. By Packaging Type

        11.3.3. By Raw Material

        11.3.4. By Application

        11.3.5. By End-user

    11.4. Key Takeaways

12. Europe Market Analysis 2018 to 2022 and Forecast 2023 to 2033, By Country

    12.1. Historical Market Size Value (US$ Million) & Volume (Units) Trend Analysis By Market Taxonomy, 2018 to 2022

    12.2. Market Size Value (US$ Million) & Volume (Units) Forecast By Market Taxonomy, 2023 to 2033

        12.2.1. By Country

            12.2.1.1. Germany

            12.2.1.2. United Kingdom

            12.2.1.3. France

            12.2.1.4. Spain

            12.2.1.5. Italy

            12.2.1.6. Rest of Europe

        12.2.2. By Packaging Type

        12.2.3. By Raw Material

        12.2.4. By Application

        12.2.5. By End-user

    12.3. Market Attractiveness Analysis

        12.3.1. By Country

        12.3.2. By Packaging Type

        12.3.3. By Raw Material

        12.3.4. By Application

        12.3.5. By End-user

    12.4. Key Takeaways

13. Asia Pacific Market Analysis 2018 to 2022 and Forecast 2023 to 2033, By Country

    13.1. Historical Market Size Value (US$ Million) & Volume (Units) Trend Analysis By Market Taxonomy, 2018 to 2022

    13.2. Market Size Value (US$ Million) & Volume (Units) Forecast By Market Taxonomy, 2023 to 2033

        13.2.1. By Country

            13.2.1.1. China

            13.2.1.2. Japan

            13.2.1.3. South Korea

            13.2.1.4. Singapore

            13.2.1.5. Thailand

            13.2.1.6. Indonesia

            13.2.1.7. Australia

            13.2.1.8. New Zealand

            13.2.1.9. Rest of Asia Pacific

        13.2.2. By Packaging Type

        13.2.3. By Raw Material

        13.2.4. By Application

        13.2.5. By End-user

    13.3. Market Attractiveness Analysis

        13.3.1. By Country

        13.3.2. By Packaging Type

        13.3.3. By Raw Material

        13.3.4. By Application

        13.3.5. By End-user

    13.4. Key Takeaways

14. MEA Market Analysis 2018 to 2022 and Forecast 2023 to 2033, By Country

    14.1. Historical Market Size Value (US$ Million) & Volume (Units) Trend Analysis By Market Taxonomy, 2018 to 2022

    14.2. Market Size Value (US$ Million) & Volume (Units) Forecast By Market Taxonomy, 2023 to 2033

        14.2.1. By Country

            14.2.1.1. GCC Countries

            14.2.1.2. South Africa

            14.2.1.3. Israel

            14.2.1.4. Rest of MEA

        14.2.2. By Packaging Type

        14.2.3. By Raw Material

        14.2.4. By Application

        14.2.5. By End-user

    14.3. Market Attractiveness Analysis

        14.3.1. By Country

        14.3.2. By Packaging Type

        14.3.3. By Raw Material

        14.3.4. By Application

        14.3.5. By End-user

    14.4. Key Takeaways

15. Key Countries Market Analysis

    15.1. USA

        15.1.1. Pricing Analysis

        15.1.2. Market Share Analysis, 2022

            15.1.2.1. By Packaging Type

            15.1.2.2. By Raw Material

            15.1.2.3. By Application

            15.1.2.4. By End-user

    15.2. Canada

        15.2.1. Pricing Analysis

        15.2.2. Market Share Analysis, 2022

            15.2.2.1. By Packaging Type

            15.2.2.2. By Raw Material

            15.2.2.3. By Application

            15.2.2.4. By End-user

    15.3. Brazil

        15.3.1. Pricing Analysis

        15.3.2. Market Share Analysis, 2022

            15.3.2.1. By Packaging Type

            15.3.2.2. By Raw Material

            15.3.2.3. By Application

            15.3.2.4. By End-user

    15.4. Mexico

        15.4.1. Pricing Analysis

        15.4.2. Market Share Analysis, 2022

            15.4.2.1. By Packaging Type

            15.4.2.2. By Raw Material

            15.4.2.3. By Application

            15.4.2.4. By End-user

    15.5. Germany

        15.5.1. Pricing Analysis

        15.5.2. Market Share Analysis, 2022

            15.5.2.1. By Packaging Type

            15.5.2.2. By Raw Material

            15.5.2.3. By Application

            15.5.2.4. By End-user

    15.6. United Kingdom

        15.6.1. Pricing Analysis

        15.6.2. Market Share Analysis, 2022

            15.6.2.1. By Packaging Type

            15.6.2.2. By Raw Material

            15.6.2.3. By Application

            15.6.2.4. By End-user

    15.7. France

        15.7.1. Pricing Analysis

        15.7.2. Market Share Analysis, 2022

            15.7.2.1. By Packaging Type

            15.7.2.2. By Raw Material

            15.7.2.3. By Application

            15.7.2.4. By End-user

    15.8. Spain

        15.8.1. Pricing Analysis

        15.8.2. Market Share Analysis, 2022

            15.8.2.1. By Packaging Type

            15.8.2.2. By Raw Material

            15.8.2.3. By Application

            15.8.2.4. By End-user

    15.9. Italy

        15.9.1. Pricing Analysis

        15.9.2. Market Share Analysis, 2022

            15.9.2.1. By Packaging Type

            15.9.2.2. By Raw Material

            15.9.2.3. By Application

            15.9.2.4. By End-user

    15.10. China

        15.10.1. Pricing Analysis

        15.10.2. Market Share Analysis, 2022

            15.10.2.1. By Packaging Type

            15.10.2.2. By Raw Material

            15.10.2.3. By Application

            15.10.2.4. By End-user

    15.11. Japan

        15.11.1. Pricing Analysis

        15.11.2. Market Share Analysis, 2022

            15.11.2.1. By Packaging Type

            15.11.2.2. By Raw Material

            15.11.2.3. By Application

            15.11.2.4. By End-user

    15.12. South Korea

        15.12.1. Pricing Analysis

        15.12.2. Market Share Analysis, 2022

            15.12.2.1. By Packaging Type

            15.12.2.2. By Raw Material

            15.12.2.3. By Application

            15.12.2.4. By End-user

    15.13. Singapore

        15.13.1. Pricing Analysis

        15.13.2. Market Share Analysis, 2022

            15.13.2.1. By Packaging Type

            15.13.2.2. By Raw Material

            15.13.2.3. By Application

            15.13.2.4. By End-user

    15.14. Thailand

        15.14.1. Pricing Analysis

        15.14.2. Market Share Analysis, 2022

            15.14.2.1. By Packaging Type

            15.14.2.2. By Raw Material

            15.14.2.3. By Application

            15.14.2.4. By End-user

    15.15. Indonesia

        15.15.1. Pricing Analysis

        15.15.2. Market Share Analysis, 2022

            15.15.2.1. By Packaging Type

            15.15.2.2. By Raw Material

            15.15.2.3. By Application

            15.15.2.4. By End-user

    15.16. Australia

        15.16.1. Pricing Analysis

        15.16.2. Market Share Analysis, 2022

            15.16.2.1. By Packaging Type

            15.16.2.2. By Raw Material

            15.16.2.3. By Application

            15.16.2.4. By End-user

    15.17. New Zealand

        15.17.1. Pricing Analysis

        15.17.2. Market Share Analysis, 2022

            15.17.2.1. By Packaging Type

            15.17.2.2. By Raw Material

            15.17.2.3. By Application

            15.17.2.4. By End-user

    15.18. GCC Countries

        15.18.1. Pricing Analysis

        15.18.2. Market Share Analysis, 2022

            15.18.2.1. By Packaging Type

            15.18.2.2. By Raw Material

            15.18.2.3. By Application

            15.18.2.4. By End-user

    15.19. South Africa

        15.19.1. Pricing Analysis

        15.19.2. Market Share Analysis, 2022

            15.19.2.1. By Packaging Type

            15.19.2.2. By Raw Material

            15.19.2.3. By Application

            15.19.2.4. By End-user

    15.20. Israel

        15.20.1. Pricing Analysis

        15.20.2. Market Share Analysis, 2022

            15.20.2.1. By Packaging Type

            15.20.2.2. By Raw Material

            15.20.2.3. By Application

            15.20.2.4. By End-user

16. Market Structure Analysis

    16.1. Competition Dashboard

    16.2. Competition Benchmarking

    16.3. Market Share Analysis of Top Players

        16.3.1. By Regional

        16.3.2. By Packaging Type

        16.3.3. By Raw Material

        16.3.4. By Application

        16.3.5. By End-user

17. Competition Analysis

    17.1. Competition Deep Dive

        17.1.1. Avery Dennison Corporation

            17.1.1.1. Overview

            17.1.1.2. Product Portfolio

            17.1.1.3. Profitability by Market Segments

            17.1.1.4. Sales Footprint

            17.1.1.5. Strategy Overview

                17.1.1.5.1. Marketing Strategy

                17.1.1.5.2. Product Strategy

                17.1.1.5.3. Channel Strategy

        17.1.2. 3M Company

            17.1.2.1. Overview

            17.1.2.2. Product Portfolio

            17.1.2.3. Profitability by Market Segments

            17.1.2.4. Sales Footprint

            17.1.2.5. Strategy Overview

                17.1.2.5.1. Marketing Strategy

                17.1.2.5.2. Product Strategy

                17.1.2.5.3. Channel Strategy

        17.1.3. DuPont de Nemours 

            17.1.3.1. Overview

            17.1.3.2. Product Portfolio

            17.1.3.3. Profitability by Market Segments

            17.1.3.4. Sales Footprint

            17.1.3.5. Strategy Overview

                17.1.3.5.1. Marketing Strategy

                17.1.3.5.2. Product Strategy

                17.1.3.5.3. Channel Strategy

        17.1.4. CCL Industries Inc.

            17.1.4.1. Overview

            17.1.4.2. Product Portfolio

            17.1.4.3. Profitability by Market Segments

            17.1.4.4. Sales Footprint

            17.1.4.5. Strategy Overview

                17.1.4.5.1. Marketing Strategy

                17.1.4.5.2. Product Strategy

                17.1.4.5.3. Channel Strategy

        17.1.5. Amcor Limited

            17.1.5.1. Overview

            17.1.5.2. Product Portfolio

            17.1.5.3. Profitability by Market Segments

            17.1.5.4. Sales Footprint

            17.1.5.5. Strategy Overview

                17.1.5.5.1. Marketing Strategy

                17.1.5.5.2. Product Strategy

                17.1.5.5.3. Channel Strategy

        17.1.6. Constantia Flexibles Group GmbH

            17.1.6.1. Overview

            17.1.6.2. Product Portfolio

            17.1.6.3. Profitability by Market Segments

            17.1.6.4. Sales Footprint

            17.1.6.5. Strategy Overview

                17.1.6.5.1. Marketing Strategy

                17.1.6.5.2. Product Strategy

                17.1.6.5.3. Channel Strategy

        17.1.7. Bemis Company, Inc

            17.1.7.1. Overview

            17.1.7.2. Product Portfolio

            17.1.7.3. Profitability by Market Segments

            17.1.7.4. Sales Footprint

            17.1.7.5. Strategy Overview

                17.1.7.5.1. Marketing Strategy

                17.1.7.5.2. Product Strategy

                17.1.7.5.3. Channel Strategy

        17.1.8. Sonoco Company

            17.1.8.1. Overview

            17.1.8.2. Product Portfolio

            17.1.8.3. Profitability by Market Segments

            17.1.8.4. Sales Footprint

            17.1.8.5. Strategy Overview

                17.1.8.5.1. Marketing Strategy

                17.1.8.5.2. Product Strategy

                17.1.8.5.3. Channel Strategy

        17.1.9. WestRock Company

            17.1.9.1. Overview

            17.1.9.2. Product Portfolio

            17.1.9.3. Profitability by Market Segments

            17.1.9.4. Sales Footprint

            17.1.9.5. Strategy Overview

                17.1.9.5.1. Marketing Strategy

                17.1.9.5.2. Product Strategy

                17.1.9.5.3. Channel Strategy

18. Assumptions & Acronyms Used

19. Research Methodology

Don't pay for what you don't need

Customize your report by selecting specific countries or regions and save 30%!

List of Tables

Table 1: Global Market Value (US$ Million) Forecast by Region, 2018 to 2033

Table 2: Global Market Volume (Units) Forecast by Region, 2018 to 2033

Table 3: Global Market Value (US$ Million) Forecast by Packaging Type, 2018 to 2033

Table 4: Global Market Volume (Units) Forecast by Packaging Type, 2018 to 2033

Table 5: Global Market Value (US$ Million) Forecast by Raw Material, 2018 to 2033

Table 6: Global Market Volume (Units) Forecast by Raw Material, 2018 to 2033

Table 7: Global Market Value (US$ Million) Forecast by Application, 2018 to 2033

Table 8: Global Market Volume (Units) Forecast by Application, 2018 to 2033

Table 9: Global Market Value (US$ Million) Forecast by End-user, 2018 to 2033

Table 10: Global Market Volume (Units) Forecast by End-user, 2018 to 2033

Table 11: North America Market Value (US$ Million) Forecast by Country, 2018 to 2033

Table 12: North America Market Volume (Units) Forecast by Country, 2018 to 2033

Table 13: North America Market Value (US$ Million) Forecast by Packaging Type, 2018 to 2033

Table 14: North America Market Volume (Units) Forecast by Packaging Type, 2018 to 2033

Table 15: North America Market Value (US$ Million) Forecast by Raw Material, 2018 to 2033

Table 16: North America Market Volume (Units) Forecast by Raw Material, 2018 to 2033

Table 17: North America Market Value (US$ Million) Forecast by Application, 2018 to 2033

Table 18: North America Market Volume (Units) Forecast by Application, 2018 to 2033

Table 19: North America Market Value (US$ Million) Forecast by End-user, 2018 to 2033

Table 20: North America Market Volume (Units) Forecast by End-user, 2018 to 2033

Table 21: Latin America Market Value (US$ Million) Forecast by Country, 2018 to 2033

Table 22: Latin America Market Volume (Units) Forecast by Country, 2018 to 2033

Table 23: Latin America Market Value (US$ Million) Forecast by Packaging Type, 2018 to 2033

Table 24: Latin America Market Volume (Units) Forecast by Packaging Type, 2018 to 2033

Table 25: Latin America Market Value (US$ Million) Forecast by Raw Material, 2018 to 2033

Table 26: Latin America Market Volume (Units) Forecast by Raw Material, 2018 to 2033

Table 27: Latin America Market Value (US$ Million) Forecast by Application, 2018 to 2033

Table 28: Latin America Market Volume (Units) Forecast by Application, 2018 to 2033

Table 29: Latin America Market Value (US$ Million) Forecast by End-user, 2018 to 2033

Table 30: Latin America Market Volume (Units) Forecast by End-user, 2018 to 2033

Table 31: Europe Market Value (US$ Million) Forecast by Country, 2018 to 2033

Table 32: Europe Market Volume (Units) Forecast by Country, 2018 to 2033

Table 33: Europe Market Value (US$ Million) Forecast by Packaging Type, 2018 to 2033

Table 34: Europe Market Volume (Units) Forecast by Packaging Type, 2018 to 2033

Table 35: Europe Market Value (US$ Million) Forecast by Raw Material, 2018 to 2033

Table 36: Europe Market Volume (Units) Forecast by Raw Material, 2018 to 2033

Table 37: Europe Market Value (US$ Million) Forecast by Application, 2018 to 2033

Table 38: Europe Market Volume (Units) Forecast by Application, 2018 to 2033

Table 39: Europe Market Value (US$ Million) Forecast by End-user, 2018 to 2033

Table 40: Europe Market Volume (Units) Forecast by End-user, 2018 to 2033

Table 41: Asia Pacific Market Value (US$ Million) Forecast by Country, 2018 to 2033

Table 42: Asia Pacific Market Volume (Units) Forecast by Country, 2018 to 2033

Table 43: Asia Pacific Market Value (US$ Million) Forecast by Packaging Type, 2018 to 2033

Table 44: Asia Pacific Market Volume (Units) Forecast by Packaging Type, 2018 to 2033

Table 45: Asia Pacific Market Value (US$ Million) Forecast by Raw Material, 2018 to 2033

Table 46: Asia Pacific Market Volume (Units) Forecast by Raw Material, 2018 to 2033

Table 47: Asia Pacific Market Value (US$ Million) Forecast by Application, 2018 to 2033

Table 48: Asia Pacific Market Volume (Units) Forecast by Application, 2018 to 2033

Table 49: Asia Pacific Market Value (US$ Million) Forecast by End-user, 2018 to 2033

Table 50: Asia Pacific Market Volume (Units) Forecast by End-user, 2018 to 2033

Table 51: MEA Market Value (US$ Million) Forecast by Country, 2018 to 2033

Table 52: MEA Market Volume (Units) Forecast by Country, 2018 to 2033

Table 53: MEA Market Value (US$ Million) Forecast by Packaging Type, 2018 to 2033

Table 54: MEA Market Volume (Units) Forecast by Packaging Type, 2018 to 2033

Table 55: MEA Market Value (US$ Million) Forecast by Raw Material, 2018 to 2033

Table 56: MEA Market Volume (Units) Forecast by Raw Material, 2018 to 2033

Table 57: MEA Market Value (US$ Million) Forecast by Application, 2018 to 2033

Table 58: MEA Market Volume (Units) Forecast by Application, 2018 to 2033

Table 59: MEA Market Value (US$ Million) Forecast by End-user, 2018 to 2033

Table 60: MEA Market Volume (Units) Forecast by End-user, 2018 to 2033
Ismail Sutaria
Ismail Sutaria

Principal Consultant

Talk to Analyst

Find your sweet spots for generating winning opportunities in this market.

List of Charts

Figure 1: Global Market Value (US$ Million) by Packaging Type, 2023 to 2033

Figure 2: Global Market Value (US$ Million) by Raw Material, 2023 to 2033

Figure 3: Global Market Value (US$ Million) by Application, 2023 to 2033

Figure 4: Global Market Value (US$ Million) by End-user, 2023 to 2033

Figure 5: Global Market Value (US$ Million) by Region, 2023 to 2033

Figure 6: Global Market Value (US$ Million) Analysis by Region, 2018 to 2033

Figure 7: Global Market Volume (Units) Analysis by Region, 2018 to 2033

Figure 8: Global Market Value Share (%) and BPS Analysis by Region, 2023 to 2033

Figure 9: Global Market Y-o-Y Growth (%) Projections by Region, 2023 to 2033

Figure 10: Global Market Value (US$ Million) Analysis by Packaging Type, 2018 to 2033

Figure 11: Global Market Volume (Units) Analysis by Packaging Type, 2018 to 2033

Figure 12: Global Market Value Share (%) and BPS Analysis by Packaging Type, 2023 to 2033

Figure 13: Global Market Y-o-Y Growth (%) Projections by Packaging Type, 2023 to 2033

Figure 14: Global Market Value (US$ Million) Analysis by Raw Material, 2018 to 2033

Figure 15: Global Market Volume (Units) Analysis by Raw Material, 2018 to 2033

Figure 16: Global Market Value Share (%) and BPS Analysis by Raw Material, 2023 to 2033

Figure 17: Global Market Y-o-Y Growth (%) Projections by Raw Material, 2023 to 2033

Figure 18: Global Market Value (US$ Million) Analysis by Application, 2018 to 2033

Figure 19: Global Market Volume (Units) Analysis by Application, 2018 to 2033

Figure 20: Global Market Value Share (%) and BPS Analysis by Application, 2023 to 2033

Figure 21: Global Market Y-o-Y Growth (%) Projections by Application, 2023 to 2033

Figure 22: Global Market Value (US$ Million) Analysis by End-user, 2018 to 2033

Figure 23: Global Market Volume (Units) Analysis by End-user, 2018 to 2033

Figure 24: Global Market Value Share (%) and BPS Analysis by End-user, 2023 to 2033

Figure 25: Global Market Y-o-Y Growth (%) Projections by End-user, 2023 to 2033

Figure 26: Global Market Attractiveness by Packaging Type, 2023 to 2033

Figure 27: Global Market Attractiveness by Raw Material, 2023 to 2033

Figure 28: Global Market Attractiveness by Application, 2023 to 2033

Figure 29: Global Market Attractiveness by End-user, 2023 to 2033

Figure 30: Global Market Attractiveness by Region, 2023 to 2033

Figure 31: North America Market Value (US$ Million) by Packaging Type, 2023 to 2033

Figure 32: North America Market Value (US$ Million) by Raw Material, 2023 to 2033

Figure 33: North America Market Value (US$ Million) by Application, 2023 to 2033

Figure 34: North America Market Value (US$ Million) by End-user, 2023 to 2033

Figure 35: North America Market Value (US$ Million) by Country, 2023 to 2033

Figure 36: North America Market Value (US$ Million) Analysis by Country, 2018 to 2033

Figure 37: North America Market Volume (Units) Analysis by Country, 2018 to 2033

Figure 38: North America Market Value Share (%) and BPS Analysis by Country, 2023 to 2033

Figure 39: North America Market Y-o-Y Growth (%) Projections by Country, 2023 to 2033

Figure 40: North America Market Value (US$ Million) Analysis by Packaging Type, 2018 to 2033

Figure 41: North America Market Volume (Units) Analysis by Packaging Type, 2018 to 2033

Figure 42: North America Market Value Share (%) and BPS Analysis by Packaging Type, 2023 to 2033

Figure 43: North America Market Y-o-Y Growth (%) Projections by Packaging Type, 2023 to 2033

Figure 44: North America Market Value (US$ Million) Analysis by Raw Material, 2018 to 2033

Figure 45: North America Market Volume (Units) Analysis by Raw Material, 2018 to 2033

Figure 46: North America Market Value Share (%) and BPS Analysis by Raw Material, 2023 to 2033

Figure 47: North America Market Y-o-Y Growth (%) Projections by Raw Material, 2023 to 2033

Figure 48: North America Market Value (US$ Million) Analysis by Application, 2018 to 2033

Figure 49: North America Market Volume (Units) Analysis by Application, 2018 to 2033

Figure 50: North America Market Value Share (%) and BPS Analysis by Application, 2023 to 2033

Figure 51: North America Market Y-o-Y Growth (%) Projections by Application, 2023 to 2033

Figure 52: North America Market Value (US$ Million) Analysis by End-user, 2018 to 2033

Figure 53: North America Market Volume (Units) Analysis by End-user, 2018 to 2033

Figure 54: North America Market Value Share (%) and BPS Analysis by End-user, 2023 to 2033

Figure 55: North America Market Y-o-Y Growth (%) Projections by End-user, 2023 to 2033

Figure 56: North America Market Attractiveness by Packaging Type, 2023 to 2033

Figure 57: North America Market Attractiveness by Raw Material, 2023 to 2033

Figure 58: North America Market Attractiveness by Application, 2023 to 2033

Figure 59: North America Market Attractiveness by End-user, 2023 to 2033

Figure 60: North America Market Attractiveness by Country, 2023 to 2033

Figure 61: Latin America Market Value (US$ Million) by Packaging Type, 2023 to 2033

Figure 62: Latin America Market Value (US$ Million) by Raw Material, 2023 to 2033

Figure 63: Latin America Market Value (US$ Million) by Application, 2023 to 2033

Figure 64: Latin America Market Value (US$ Million) by End-user, 2023 to 2033

Figure 65: Latin America Market Value (US$ Million) by Country, 2023 to 2033

Figure 66: Latin America Market Value (US$ Million) Analysis by Country, 2018 to 2033

Figure 67: Latin America Market Volume (Units) Analysis by Country, 2018 to 2033

Figure 68: Latin America Market Value Share (%) and BPS Analysis by Country, 2023 to 2033

Figure 69: Latin America Market Y-o-Y Growth (%) Projections by Country, 2023 to 2033

Figure 70: Latin America Market Value (US$ Million) Analysis by Packaging Type, 2018 to 2033

Figure 71: Latin America Market Volume (Units) Analysis by Packaging Type, 2018 to 2033

Figure 72: Latin America Market Value Share (%) and BPS Analysis by Packaging Type, 2023 to 2033

Figure 73: Latin America Market Y-o-Y Growth (%) Projections by Packaging Type, 2023 to 2033

Figure 74: Latin America Market Value (US$ Million) Analysis by Raw Material, 2018 to 2033

Figure 75: Latin America Market Volume (Units) Analysis by Raw Material, 2018 to 2033

Figure 76: Latin America Market Value Share (%) and BPS Analysis by Raw Material, 2023 to 2033

Figure 77: Latin America Market Y-o-Y Growth (%) Projections by Raw Material, 2023 to 2033

Figure 78: Latin America Market Value (US$ Million) Analysis by Application, 2018 to 2033

Figure 79: Latin America Market Volume (Units) Analysis by Application, 2018 to 2033

Figure 80: Latin America Market Value Share (%) and BPS Analysis by Application, 2023 to 2033

Figure 81: Latin America Market Y-o-Y Growth (%) Projections by Application, 2023 to 2033

Figure 82: Latin America Market Value (US$ Million) Analysis by End-user, 2018 to 2033

Figure 83: Latin America Market Volume (Units) Analysis by End-user, 2018 to 2033

Figure 84: Latin America Market Value Share (%) and BPS Analysis by End-user, 2023 to 2033

Figure 85: Latin America Market Y-o-Y Growth (%) Projections by End-user, 2023 to 2033

Figure 86: Latin America Market Attractiveness by Packaging Type, 2023 to 2033

Figure 87: Latin America Market Attractiveness by Raw Material, 2023 to 2033

Figure 88: Latin America Market Attractiveness by Application, 2023 to 2033

Figure 89: Latin America Market Attractiveness by End-user, 2023 to 2033

Figure 90: Latin America Market Attractiveness by Country, 2023 to 2033

Figure 91: Europe Market Value (US$ Million) by Packaging Type, 2023 to 2033

Figure 92: Europe Market Value (US$ Million) by Raw Material, 2023 to 2033

Figure 93: Europe Market Value (US$ Million) by Application, 2023 to 2033

Figure 94: Europe Market Value (US$ Million) by End-user, 2023 to 2033

Figure 95: Europe Market Value (US$ Million) by Country, 2023 to 2033

Figure 96: Europe Market Value (US$ Million) Analysis by Country, 2018 to 2033

Figure 97: Europe Market Volume (Units) Analysis by Country, 2018 to 2033

Figure 98: Europe Market Value Share (%) and BPS Analysis by Country, 2023 to 2033

Figure 99: Europe Market Y-o-Y Growth (%) Projections by Country, 2023 to 2033

Figure 100: Europe Market Value (US$ Million) Analysis by Packaging Type, 2018 to 2033

Figure 101: Europe Market Volume (Units) Analysis by Packaging Type, 2018 to 2033

Figure 102: Europe Market Value Share (%) and BPS Analysis by Packaging Type, 2023 to 2033

Figure 103: Europe Market Y-o-Y Growth (%) Projections by Packaging Type, 2023 to 2033

Figure 104: Europe Market Value (US$ Million) Analysis by Raw Material, 2018 to 2033

Figure 105: Europe Market Volume (Units) Analysis by Raw Material, 2018 to 2033

Figure 106: Europe Market Value Share (%) and BPS Analysis by Raw Material, 2023 to 2033

Figure 107: Europe Market Y-o-Y Growth (%) Projections by Raw Material, 2023 to 2033

Figure 108: Europe Market Value (US$ Million) Analysis by Application, 2018 to 2033

Figure 109: Europe Market Volume (Units) Analysis by Application, 2018 to 2033

Figure 110: Europe Market Value Share (%) and BPS Analysis by Application, 2023 to 2033

Figure 111: Europe Market Y-o-Y Growth (%) Projections by Application, 2023 to 2033

Figure 112: Europe Market Value (US$ Million) Analysis by End-user, 2018 to 2033

Figure 113: Europe Market Volume (Units) Analysis by End-user, 2018 to 2033

Figure 114: Europe Market Value Share (%) and BPS Analysis by End-user, 2023 to 2033

Figure 115: Europe Market Y-o-Y Growth (%) Projections by End-user, 2023 to 2033

Figure 116: Europe Market Attractiveness by Packaging Type, 2023 to 2033

Figure 117: Europe Market Attractiveness by Raw Material, 2023 to 2033

Figure 118: Europe Market Attractiveness by Application, 2023 to 2033

Figure 119: Europe Market Attractiveness by End-user, 2023 to 2033

Figure 120: Europe Market Attractiveness by Country, 2023 to 2033

Figure 121: Asia Pacific Market Value (US$ Million) by Packaging Type, 2023 to 2033

Figure 122: Asia Pacific Market Value (US$ Million) by Raw Material, 2023 to 2033

Figure 123: Asia Pacific Market Value (US$ Million) by Application, 2023 to 2033

Figure 124: Asia Pacific Market Value (US$ Million) by End-user, 2023 to 2033

Figure 125: Asia Pacific Market Value (US$ Million) by Country, 2023 to 2033

Figure 126: Asia Pacific Market Value (US$ Million) Analysis by Country, 2018 to 2033

Figure 127: Asia Pacific Market Volume (Units) Analysis by Country, 2018 to 2033

Figure 128: Asia Pacific Market Value Share (%) and BPS Analysis by Country, 2023 to 2033

Figure 129: Asia Pacific Market Y-o-Y Growth (%) Projections by Country, 2023 to 2033

Figure 130: Asia Pacific Market Value (US$ Million) Analysis by Packaging Type, 2018 to 2033

Figure 131: Asia Pacific Market Volume (Units) Analysis by Packaging Type, 2018 to 2033

Figure 132: Asia Pacific Market Value Share (%) and BPS Analysis by Packaging Type, 2023 to 2033

Figure 133: Asia Pacific Market Y-o-Y Growth (%) Projections by Packaging Type, 2023 to 2033

Figure 134: Asia Pacific Market Value (US$ Million) Analysis by Raw Material, 2018 to 2033

Figure 135: Asia Pacific Market Volume (Units) Analysis by Raw Material, 2018 to 2033

Figure 136: Asia Pacific Market Value Share (%) and BPS Analysis by Raw Material, 2023 to 2033

Figure 137: Asia Pacific Market Y-o-Y Growth (%) Projections by Raw Material, 2023 to 2033

Figure 138: Asia Pacific Market Value (US$ Million) Analysis by Application, 2018 to 2033

Figure 139: Asia Pacific Market Volume (Units) Analysis by Application, 2018 to 2033

Figure 140: Asia Pacific Market Value Share (%) and BPS Analysis by Application, 2023 to 2033

Figure 141: Asia Pacific Market Y-o-Y Growth (%) Projections by Application, 2023 to 2033

Figure 142: Asia Pacific Market Value (US$ Million) Analysis by End-user, 2018 to 2033

Figure 143: Asia Pacific Market Volume (Units) Analysis by End-user, 2018 to 2033

Figure 144: Asia Pacific Market Value Share (%) and BPS Analysis by End-user, 2023 to 2033

Figure 145: Asia Pacific Market Y-o-Y Growth (%) Projections by End-user, 2023 to 2033

Figure 146: Asia Pacific Market Attractiveness by Packaging Type, 2023 to 2033

Figure 147: Asia Pacific Market Attractiveness by Raw Material, 2023 to 2033

Figure 148: Asia Pacific Market Attractiveness by Application, 2023 to 2033

Figure 149: Asia Pacific Market Attractiveness by End-user, 2023 to 2033

Figure 150: Asia Pacific Market Attractiveness by Country, 2023 to 2033

Figure 151: MEA Market Value (US$ Million) by Packaging Type, 2023 to 2033

Figure 152: MEA Market Value (US$ Million) by Raw Material, 2023 to 2033

Figure 153: MEA Market Value (US$ Million) by Application, 2023 to 2033

Figure 154: MEA Market Value (US$ Million) by End-user, 2023 to 2033

Figure 155: MEA Market Value (US$ Million) by Country, 2023 to 2033

Figure 156: MEA Market Value (US$ Million) Analysis by Country, 2018 to 2033

Figure 157: MEA Market Volume (Units) Analysis by Country, 2018 to 2033

Figure 158: MEA Market Value Share (%) and BPS Analysis by Country, 2023 to 2033

Figure 159: MEA Market Y-o-Y Growth (%) Projections by Country, 2023 to 2033

Figure 160: MEA Market Value (US$ Million) Analysis by Packaging Type, 2018 to 2033

Figure 161: MEA Market Volume (Units) Analysis by Packaging Type, 2018 to 2033

Figure 162: MEA Market Value Share (%) and BPS Analysis by Packaging Type, 2023 to 2033

Figure 163: MEA Market Y-o-Y Growth (%) Projections by Packaging Type, 2023 to 2033

Figure 164: MEA Market Value (US$ Million) Analysis by Raw Material, 2018 to 2033

Figure 165: MEA Market Volume (Units) Analysis by Raw Material, 2018 to 2033

Figure 166: MEA Market Value Share (%) and BPS Analysis by Raw Material, 2023 to 2033

Figure 167: MEA Market Y-o-Y Growth (%) Projections by Raw Material, 2023 to 2033

Figure 168: MEA Market Value (US$ Million) Analysis by Application, 2018 to 2033

Figure 169: MEA Market Volume (Units) Analysis by Application, 2018 to 2033

Figure 170: MEA Market Value Share (%) and BPS Analysis by Application, 2023 to 2033

Figure 171: MEA Market Y-o-Y Growth (%) Projections by Application, 2023 to 2033

Figure 172: MEA Market Value (US$ Million) Analysis by End-user, 2018 to 2033

Figure 173: MEA Market Volume (Units) Analysis by End-user, 2018 to 2033

Figure 174: MEA Market Value Share (%) and BPS Analysis by End-user, 2023 to 2033

Figure 175: MEA Market Y-o-Y Growth (%) Projections by End-user, 2023 to 2033

Figure 176: MEA Market Attractiveness by Packaging Type, 2023 to 2033

Figure 177: MEA Market Attractiveness by Raw Material, 2023 to 2033

Figure 178: MEA Market Attractiveness by Application, 2023 to 2033

Figure 179: MEA Market Attractiveness by End-user, 2023 to 2033

Figure 180: MEA Market Attractiveness by Country, 2023 to 2033

Recommendations

Packaging

Medical Devices Secondary Packaging Market

Published : February 2023

Explore Packaging Insights

View Reports

Medical Device Packaging Market