Reports

- Global Locations -

Headquarters

Future Market Insights, Inc.

Christiana Corporate, 200
Continental Drive, Suite 401,
Newark, Delaware - 19713,
United States

T: +1-845-579-5705

Americas

Future Market Insights, Inc.

616 Corporate Way, Suite 2-9018,
Valley Cottage, NY 10989, United States

T: +1-347-918-3531

MEA

Future Market Insights

1602-6 Jumeirah Bay X2 Tower, Plot No: JLT-PH2-X2A,
Jumeirah Lakes Towers, Dubai,
United Arab Emirates

Europe

Future Market Insights

3rd Floor, 207 Regent Street,
W1B 3HH London
United Kingdom

T: + 44 (0) 20 8123 9659
D: +44 (0) 20 3287 4268

Asia Pacific

Future Market Insights

IndiaLand Global Tech Park, Unit UG-1, Behind Grand HighStreet, Phase 1, Hinjawadi, MH, Pune – 411057, India

Medical Biomimetics Market Snapshot (2023 to 2033)

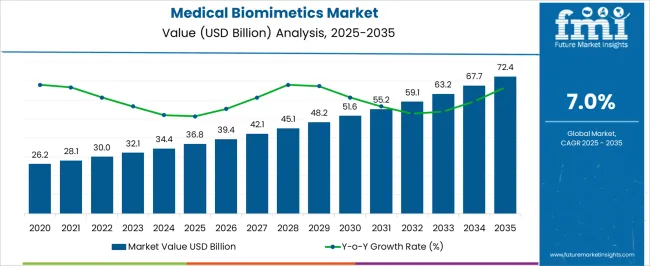
The global medical biomimetics market garnered a market value of US$ 32.10 Billion in 2023 and is expected to accumulate a market value of US$ 63.15 Billion by registering a CAGR of 7% in the forecast period 2023 to 2033. The growth of the medical biomimetics market can be attributed to increasing government funding for research pertaining to biomimetics, along with the adoption and innovations of medical engineering and nanotechnology in healthcare. The market for medical biomimetics registered a CAGR of 5% in the historical period 2016 to 2021.

Biomimetics is an integrative area in which principles from biology, chemistry, and engineering are used for the synthesis of materials, machines, or synthetic systems that have functions that imitate biological processes. Biomimetics-based designs could be used in drug delivery, tissue engineering, and regenerative medicine. The application of biomimetics to illustrate the issues in pharmaceutics and medicine is a promising method for the treatment of deadly diseases like cancer.

Report Attribute Details
Expected Market Value (2023) US$ 32.10 Billion
Anticipated Forecast Value (2033) US$ 63.15 Billion
Projected Growth Rate (2023 to 2033) 7% CAGR

Don't pay for what you don't need

Customize your report by selecting specific countries or regions and save 30%!

2018 to 2022 Medical Biomimetics Market Demand Analysis vs. Forecast 2023 to 2033

According to market research and competitive intelligence provider Future Market Insights- the market for medical biomimetics reflected a value of 7% during the historical period, 2018 to 2022.

The medical biomimetics market was affected by COVID-19 owing to delays and cancellations of orthopedic, dental, cardiovascular, and other medical procedures. However, the development of vaccines, medicines, and conventional drugs, in addition to the use of innovative drug delivery technologies has increased impetus in the fight against the COVID-19 pandemic. Advanced delivery technologies, such as the use of nanocapsules/ nanospheres, nanocrystals, liposomes, nano lipid carriers/solid lipid nanoparticles, nanosponges, and dendrimers based on biomimetics can be utilized for targeted delivery of therapeutic compounds to infected individuals for treating COVID-19. Numerous research activities have been carried out for the use of biomimicry during the pandemic.

For instance, in August 2021, researchers from the Academy of Medical Engineering and Translational Medicine, School of Life Sciences, and Tianjin University designed the inhalable nano vaccine with biomimetics COVID-19 structure to activate the mucosal immunity of the respiratory tract against coronavirus. Through replicating the route of infection and structure, this inhalable nano vaccine approach might encourage a new approach to respiratory virus precaution. Thus, the market for medical biomimetics is expected to register a CAGR of 5% in the forecast period 2023 to 2033.

Which are Some Prominent Drivers of Medical Biomimetics Market?

Surgical devices and instruments development propelling the growth of the medical biomimetics market

Medical biomimetics is the fastest-expanding field of bioengineering. It is the impersonation of features found in animals and plants to provide both treatment and protection from bacteria and illness as well as management of the disease. Medical biomimetics is considered a technology that emulates or uses nature for the advancement of human lives. Medical biomimetics is gaining more adoption in surgical devices and instrument development.

There has been increasing in the use of biomimetics in tools and devices for the artificial creation of organs mainly due to the susceptibility of old age people to organ dysfunction and failure. Increasing awareness and adoption of biomimetics has had a positive impact on organ transplantation and will continue to push the market growth in forthcoming years. Efforts to encourage organ donation must continue in all countries, but it is also necessary to develop alternative solutions, such as bioengineering. Various companies are involved in the development of biomimetics-based products.

For instance, CorNeat Vision developed the CorNeat KPro implant, a patented synthetic cornea, which offers a long-lasting medical solution for corneal injury, and blindness. The product is following a CE marking and 510K clearance path, which is expected to be approved for marketing in late 2024. In addition, the company in October 2021 also received USD 2.44 Billion grant from the European Innovation Council to support the clinical activities as well as automation and manufacturing processes which will enable the company to reach the market with this cure.

Advancements in Drug Delivery Systems boosting the adoption of Medical Biomimetics

Moreover, the innovations in nanotechnology, leading to the advancement in drug delivery systems will positively impact the medical biomimetics growth in the forecast period. Based on their biocompatibility physical, and chemical properties, nanomaterials are attractive for use in biomedical applications and exhibit great possibility in biomimetics medicine.

Currently, with the advancement of biomimetic functionalized nanotechnology, nanomaterials have been functionalized and modified by cell membrane-derived elements to form biomimetic nanomaterials with augmented biocompatibility, stability, targeting, and specificity. The biomimetic functionalized variation of nanomaterials can establish selectivity for tissue disease or biomarkers, implying that these biomimetic nanomaterials can be used for the diagnosis of disease. Thus, the use of biomimetic nanomaterials for the non-invasive diagnosis of diseases has stimulated great interest.

Additionally, rising Research and Development activities coupled with the growing application potential of medical biomimetics in the diagnostic imaging market space including ultrasound, ECGs, and CT scans are expected to drive the market growth. For instance, Imperial College London is currently developing a biomimetic flexible steerable probe. The objective of this research is to access deep brain areas with the least damage to precisely place the minimally invasive instrumentation (electrodes, catheters for deep stimulation of the brain), to perform the diagnosis and clinical analysis (sampling, biopsy), micro neurosurgery, and localized drug delivery.

Sabyasachi Ghosh
Sabyasachi Ghosh

Principal Consultant

Talk to Analyst

Find your sweet spots for generating winning opportunities in this market.

What are the Challenges Faced by the Medical Biomimetics Market?

Regulatory Frameworks restraining Medical Biomimetics Market Growth

A stringent regulatory framework hinders the medical biomimetics industry's growth. Regarding the ever-increasing and widespread applications of biomimetic biomaterials in numerous medical fields, their precise assessment is of great significance.

Although each biomaterial undergoes thorough premarket evaluation, the regulatory organizations receive a significant number of adverse events and complications reports each year. Moreover, biomaterials are integrated into biological systems, hence, they must fulfill all scientific requirements such as high biocompatibility, sufficiently long shelf-life, and accommodating biological interactions.
Regional Insights

Strong Presence of Key Players Helping in the Innovation of Medical Biomimetics Equipment in North America?

Adoption of Novel Technology shaping landscape for Medical Biomimetics

The large share of North America is mainly attributed to the high research and development activities in the region, high adoption of novel technology, high disposable income, and presence of key market players in the region.

North America is expected to be a major market for medical biomimetics due to trends such as an increase in the rate of adoption of novel technologies, growth in the geriatric population, an increase in research and development activities related to medical biomimetics, and a strong presence of key players. Thus, North America is expected to dominate the regional medical biomimetics market with a share of 39% in 2023.

Government Funding and Initiatives Supporting Growth of Medical Biomimetics in the Asia Pacific?

Booming Biotechnology Sector contributing to Medical Biomimetics Growth

The market in the Asia Pacific is expected to expand at a high growth rate during the forecast period due to factors including an increase in government initiatives in the healthcare sector, an increase in the medical tourism sector, and a booming biotechnology industry.

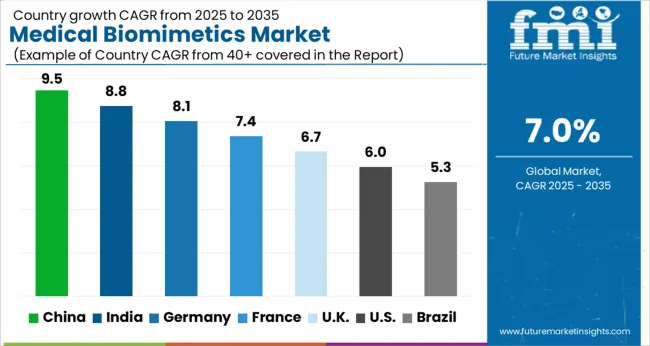
Asia Pacific region is projected to exhibit a high growth rate of the medical biomimetics market during the forecast period owing to increasing investment in medical and healthcare infrastructure, a huge patient population, growing awareness and adoption of new technology, and government initiatives to boost the growth of the biotechnology sector. Thus, Asia Pacific is expected to possess a 36% market share of the medical biomimetics market in 2023.

Get the data you need at a Fraction of the cost

Personalize your report by choosing insights you need
and save 40%!

Category-Wise Insights

Launch of Technologically Advanced Products Accelerating Application of Medical Biomimetics in Treatment of Cardiovascular Diseases?

Government Funding creating Lucrative Opportunities for use of Medical Biomimetics for Cardiovascular Diseases

CVD is the number one cause of death globally, affecting 17.9 Billion deaths every year. Worldwide, more than 2.1 Billion patients receive CVD implants each year to prevent death. Moreover, the launch of technologically advanced products coupled with government funding offers lucrative opportunities for the segment during the forecast period.

LifeMatrix has developed a distinctive bioengineering technology to grow human replacement tissues as next-generation implants for treating CVDs. The patented LifeMatrix tissues can be manufactured as blood vessels, heart valves, and other cardiovascular structures. The biomimetic device helps to prevent repetitive major surgeries and the risks associated with them throughout the patient’s life.

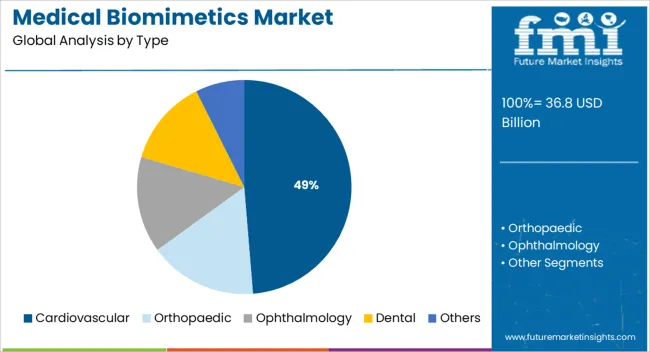
In addition, the technology which has been created by a team of cardiovascular and cardiac experts in April 2021 also received US$ 149,707 in funding from Venture Kick to support regulatory submissions and increase the clinical launch strategy. Thus, by product, the cardiovascular segment is expected to possess a 43% market share for the medical biomimetics market in 2023.

Technological Advancements in Orthopaedic Products spurring the growth of Medical Biomimetics

The orthopedic segment is expected to grow at the fastest CAGR of the medical biomimetics market during the forecast period. Technological advancements coupled with the launch of new products drive the growth of the segment. For instance, in March 2021, Sparta Biomedical Inc. received Breakthrough Device Designation from the USFDA for SBM-01 Biomimetic Implant.

The implant is proposed to replace the damaged knee cartilage in patients suffering from single or multiple osteochondral or chondral defects in the knee. The company, in December 2021, also received US$ 5 Billion to advance its preclinical activities for investigational device exemption submission.

Increasing Prevalence of Chronic Diseases Augmenting Application of Medical Biomimetics in Wound Healing?

Demographic trends contributing to the growth of the application of Medical Biomimetics in Wound Healing

The demand for wound healing and wound care products is growing, owing to the escalating number of surgical cases and the increasing prevalence of chronic diseases globally. Moreover, the segment will continue to grow due to specific demographic trends, with an aging population, rising incidence of diabetes and obesity, and related higher sensitivity towards non-healing chronic wounds. In the USA, in 2021, the prevalence of chronic wounds was about 2% of the overall USA. population or about 6.9 Billion people were suffering from chronic wounds.

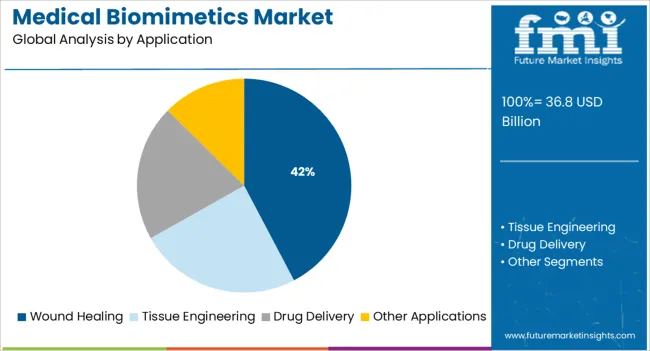
Furthermore, the expanding number of patients needing improved treatment represents a considerable burden of cost on the healthcare system. The total cost of treating chronic wounds is increasing sharply, and the recent annual projected cost in the USA exceeds USD 28 billion. Thus, the wound healing segment is expected to dominate the medical biomimetics market and expected to account for 35% market share in 2023.

While numerous approaches for wound healing are offered, they are only somewhat effective. Thus, there is a demand for more efficient therapies for healing wounds. The advancement of instructive materials and biomimetics is evolving as a favorable procedure for redirecting fibrotic wound healing into a regenerative method. Biomimetics materials are currently advancing on the shortcomings of current treatments for wound care as they are being created to accelerate these spatiotemporal cues, thus encouraging regeneration within the host tissues.

Demand for Advanced Drug Administration Systems increasing use for Drug Delivery

The drug delivery segment is anticipated to witness a considerable growth rate in the medical biomimetics market during the forecast period. This can be attributed to the patient shifts towards the adoption of advanced drug administration systems, and increasing research and development. So far, albumin-based delivery is perhaps the most successful approach to biomimetics therapeutics, and there are numerous marketed drugs involving Abraxane, liraglutide, semaglutide, and, albiglutide.

In addition, cell-based biomimetic delivery is another interesting case for biomimetic therapeutics. For instance, since the 1970s RBCs as living cell carriers have been examined for decades.  Moreover, the adoption of targeted drug delivery systems further promotes the growth of biomimetics in drug delivery applications as biomimetics approaches show promising results in promoting drug efficiency in targeted drug delivery.

Start-ups for Medical Biomimetics Market

Key players in the medical biomimetics market are Biome Renewables, Bimitech, denovoMATRIX, BEOnChip, and Bioxegy
  • Bioxegy, a key player in the medical biomimetics market is focusing on innovating and incorporating higher resistance, flexibility, and lightness, as well as aerodynamics, grip, and thermoregulation, among others.
  • denovoMATRIX, a key start-up player provides a screen matrix, a tool to rapidly test a large number of cell microenvironments simultaneously. Thus, the company’s technology incorporates important biological ligands for cell adhesion, spreading, and robust growth, within its biomimetic coatings

Market Competition

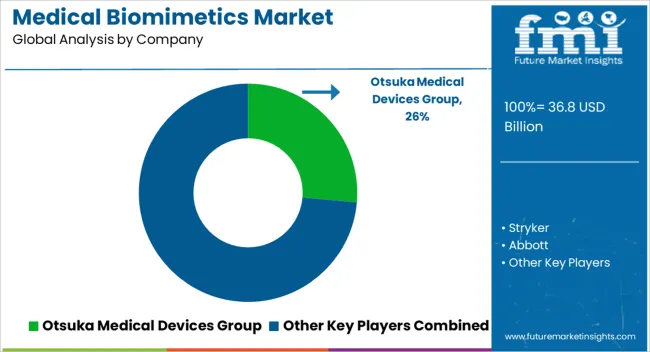
Key players in medical biomimetics are implementing various strategies including partnerships through mergers and acquisitions, geographical expansion, and strategic collaborations to expand their market presence. Some of the key players in the global medical biomimetics market include Otsuka Medical Devices Group, Stryker, Abbott, AVINENT Science and Technology, SynTouch Inc, Osteopore International Pte Ltd, Vandstrom, Inc., Biomimetics Technologies Inc, Swedish Biomimetics 3000 ApS, Keystone Dental Group, LifeMatrix, Curasan, Inc, CorNeat Vision, NanoHive Medical LLC, Zimmer Biomet

  • In February 2022, NanoHive Medical, LLC a leader in the innovation of 3D printed, biomimetic spinal interbody fusion solutions, announced a distribution agreement with Accelus. The agreement helps in developing the distribution network for NanoHive Medical’s Hive Soft Titanium range of interbody fusion devices in the USA
  • In September 2021, Nexa3D, partnered with Henkel to develop the world’s first connected SKOP stethoscope for WeMed. Based on the biomimetics design developed on the NXE400 3D printer using materials from Henkel, the WeMed SKOP stethoscope is the first connected stethoscope to be manufactured additively.

Report Scope

Report Attribute Details
Market Value in 2023 US$ 32.10 Billion
Market Value in 2033 US$ 63.15 Billion
Growth Rate CAGR of 7% from 2023 to 2033
Base Year for Estimation 2021
Historical Data 2018 to 2022
Forecast Period 2023 to 2033
Quantitative Units Revenue in USD Billion and CAGR from 2023 to 2033
Report Coverage Revenue Forecast, Volume Forecast, Company Ranking, Competitive Landscape, Growth Factors, Trends, and Pricing Analysis
Segments Covered
  • Type
  • Application
  • Region
Regions Covered
  • North America
  • Latin America
  • Europe
  • South Asia
  • East Asia
  • Oceania
  • Middle East and Africa
Key Countries Profiled
  • USA
  • Canada
  • Brazil
  • Mexico
  • Germany
  • United Kingdom
  • France
  • Spain
  • Italy
  • India
  • Malaysia
  • Singapore
  • Thailand
  • China
  • Japan
  • South Korea
  • Australia
  • New Zealand
  • GCC Countries
  • South Africa
Key Companies Profiled
  • Otsuka Medical Devices Group
  • Stryker
  • Abbott
  • AVINENT Science and Technology
  • SynTouch Inc.
  • Osteopore International Pte Ltd
  • Vandstrom, Inc.
  • Biomimetics Technologies Inc
  • Swedish Biomimetics 3000 ApS
  • Keystone Dental Group
  • LifeMatrix
  • Curasan, Inc.
  • CorNeat Vision
  • NanoHive Medical LLC
  • Zimmer Biomet
Customization Available Upon Request

Key Segments Profiled in the Medical Biomimetics Industry Survey

Type:

  • Cardiovascular
  • Orthopaedic
  • Ophthalmology
  • Dental
  • Others

Application:

  • Wound Healing
  • Tissue Engineering
  • Drug Delivery
  • Other Applications

Region:

  • North America
  • Latin America
  • Europe
  • South Asia
  • East Asia
  • Oceania
  • Middle East & Africa

Frequently Asked Questions

At what rate did the medical biomimetics market flourish from 2018 to 2022?

From 2018 to 2022, the medical biomimetics market grew at a CAGR of 5%.

What will be the growth rate of the global medical biomimetics market during the forecast period?

The global medical biomimetics market is expected to grow at a 7% CAGR from 2023 to 2033.

What will be the projected market size of the medical biomimetics market by 2033?

As of 2033, the medical biomimetics market is expected to reach US$ 63.15 Billion

Which application segment is expected to dominate the global medical biomimetics market during 2023?

The wound healing segment is expected to dominate the medical biomimetics market and is expected to account for 35% market share in 2023.

Which product segment is expected to dominate the global medical biomimetics market during 2023?

The cardiovascular segment is expected to possess a 43% market share in the medical biomimetics market in 2023.

How is the North America medical biomimetics market projected to grow in 2023?

North America is expected to possess a 40% market share in the medical biomimetics market in 2023.

How is the Asia Pacific medical biomimetics market projected to grow in 2023?

Asia Pacific is expected to possess a 36% market share in the medical biomimetics market in 2023.

Table of Content

1. Executive Summary | Medical Biomimetics Market

    1.1. Global Market Outlook

    1.2. Demand-side Trends

    1.3. Supply-side Trends

    1.4. Technology Roadmap Analysis

    1.5. Analysis and Recommendations

2. Market Overview

    2.1. Market Coverage / Taxonomy

    2.2. Market Definition / Scope / Limitations

3. Market Background

    3.1. Market Dynamics

        3.1.1. Drivers

        3.1.2. Restraints

        3.1.3. Opportunity

        3.1.4. Trends

    3.2. Scenario Forecast

        3.2.1. Demand in Optimistic Scenario

        3.2.2. Demand in Likely Scenario

        3.2.3. Demand in Conservative Scenario

    3.3. Opportunity Map Analysis

    3.4. Investment Feasibility Matrix

    3.5. PESTLE and Porter’s Analysis

    3.6. Regulatory Landscape

        3.6.1. By Key Regions

        3.6.2. By Key Countries

    3.7. Regional Parent Market Outlook

4. Global Market Analysis 2018 to 2022 and Forecast, 2023 to 2033

    4.1. Historical Market Size Value (US$ Million) Analysis, 2018 to 2022

    4.2. Current and Future Market Size Value (US$ Million) Projections, 2023 to 2033

        4.2.1. Y-o-Y Growth Trend Analysis

        4.2.2. Absolute $ Opportunity Analysis

5. Global Market Analysis 2018 to 2022 and Forecast 2023 to 2033, By Type

    5.1. Introduction / Key Findings

    5.2. Historical Market Size Value (US$ Million) Analysis By Type, 2018 to 2022

    5.3. Current and Future Market Size Value (US$ Million) Analysis and Forecast By Type, 2023 to 2033

        5.3.1. Cardiovascular

        5.3.2. Orthopaedic

        5.3.3. Ophthalmology

        5.3.4. Dental

        5.3.5. Others

    5.4. Y-o-Y Growth Trend Analysis By Type, 2018 to 2022

    5.5. Absolute $ Opportunity Analysis By Type, 2023 to 2033

6. Global Market Analysis 2018 to 2022 and Forecast 2023 to 2033, By Application

    6.1. Introduction / Key Findings

    6.2. Historical Market Size Value (US$ Million) Analysis By Application, 2018 to 2022

    6.3. Current and Future Market Size Value (US$ Million) Analysis and Forecast By Application, 2023 to 2033

        6.3.1. Wound Healing

        6.3.2. Tissue Engineering

        6.3.3. Drug Delivery

        6.3.4. Other

    6.4. Y-o-Y Growth Trend Analysis By Application, 2018 to 2022

    6.5. Absolute $ Opportunity Analysis By Application, 2023 to 2033

7. Global Market Analysis 2018 to 2022 and Forecast 2023 to 2033, By Region

    7.1. Introduction

    7.2. Historical Market Size Value (US$ Million) Analysis By Region, 2018 to 2022

    7.3. Current Market Size Value (US$ Million) Analysis and Forecast By Region, 2023 to 2033

        7.3.1. North America

        7.3.2. Latin America

        7.3.3. Europe

        7.3.4. South Asia

        7.3.5. East Asia

        7.3.6. Oceania

        7.3.7. Middle East and Africa(MEA)

    7.4. Market Attractiveness Analysis By Region

8. North America Market Analysis 2018 to 2022 and Forecast 2023 to 2033, By Country

    8.1. Historical Market Size Value (US$ Million) Trend Analysis By Market Taxonomy, 2018 to 2022

    8.2. Market Size Value (US$ Million) Forecast By Market Taxonomy, 2023 to 2033

        8.2.1. By Country

            8.2.1.1. USA

            8.2.1.2. Canada

        8.2.2. By Type

        8.2.3. By Application

    8.3. Market Attractiveness Analysis

        8.3.1. By Country

        8.3.2. By Type

        8.3.3. By Application

    8.4. Key Takeaways

9. Latin America Market Analysis 2018 to 2022 and Forecast 2023 to 2033, By Country

    9.1. Historical Market Size Value (US$ Million) Trend Analysis By Market Taxonomy, 2018 to 2022

    9.2. Market Size Value (US$ Million) Forecast By Market Taxonomy, 2023 to 2033

        9.2.1. By Country

            9.2.1.1. Brazil

            9.2.1.2. Mexico

            9.2.1.3. Rest of Latin America

        9.2.2. By Type

        9.2.3. By Application

    9.3. Market Attractiveness Analysis

        9.3.1. By Country

        9.3.2. By Type

        9.3.3. By Application

    9.4. Key Takeaways

10. Europe Market Analysis 2018 to 2022 and Forecast 2023 to 2033, By Country

    10.1. Historical Market Size Value (US$ Million) Trend Analysis By Market Taxonomy, 2018 to 2022

    10.2. Market Size Value (US$ Million) Forecast By Market Taxonomy, 2023 to 2033

        10.2.1. By Country

            10.2.1.1. Germany

            10.2.1.2. United Kingdom

            10.2.1.3. France

            10.2.1.4. Spain

            10.2.1.5. Italy

            10.2.1.6. Rest of Europe

        10.2.2. By Type

        10.2.3. By Application

    10.3. Market Attractiveness Analysis

        10.3.1. By Country

        10.3.2. By Type

        10.3.3. By Application

    10.4. Key Takeaways

11. South Asia Market Analysis 2018 to 2022 and Forecast 2023 to 2033, By Country

    11.1. Historical Market Size Value (US$ Million) Trend Analysis By Market Taxonomy, 2018 to 2022

    11.2. Market Size Value (US$ Million) Forecast By Market Taxonomy, 2023 to 2033

        11.2.1. By Country

            11.2.1.1. India

            11.2.1.2. Malaysia

            11.2.1.3. Singapore

            11.2.1.4. Thailand

            11.2.1.5. Rest of South Asia

        11.2.2. By Type

        11.2.3. By Application

    11.3. Market Attractiveness Analysis

        11.3.1. By Country

        11.3.2. By Type

        11.3.3. By Application

    11.4. Key Takeaways

12. East Asia Market Analysis 2018 to 2022 and Forecast 2023 to 2033, By Country

    12.1. Historical Market Size Value (US$ Million) Trend Analysis By Market Taxonomy, 2018 to 2022

    12.2. Market Size Value (US$ Million) Forecast By Market Taxonomy, 2023 to 2033

        12.2.1. By Country

            12.2.1.1. China

            12.2.1.2. Japan

            12.2.1.3. South Korea

        12.2.2. By Type

        12.2.3. By Application

    12.3. Market Attractiveness Analysis

        12.3.1. By Country

        12.3.2. By Type

        12.3.3. By Application

    12.4. Key Takeaways

13. Oceania Market Analysis 2018 to 2022 and Forecast 2023 to 2033, By Country

    13.1. Historical Market Size Value (US$ Million) Trend Analysis By Market Taxonomy, 2018 to 2022

    13.2. Market Size Value (US$ Million) Forecast By Market Taxonomy, 2023 to 2033

        13.2.1. By Country

            13.2.1.1. Australia

            13.2.1.2. New Zealand

        13.2.2. By Type

        13.2.3. By Application

    13.3. Market Attractiveness Analysis

        13.3.1. By Country

        13.3.2. By Type

        13.3.3. By Application

    13.4. Key Takeaways

14. MEA Market Analysis 2018 to 2022 and Forecast 2023 to 2033, By Country

    14.1. Historical Market Size Value (US$ Million) Trend Analysis By Market Taxonomy, 2018 to 2022

    14.2. Market Size Value (US$ Million) Forecast By Market Taxonomy, 2023 to 2033

        14.2.1. By Country

            14.2.1.1. GCC Countries

            14.2.1.2. South Africa

            14.2.1.3. Israel

            14.2.1.4. Rest of Middle East and Africa(MEA)

        14.2.2. By Type

        14.2.3. By Application

    14.3. Market Attractiveness Analysis

        14.3.1. By Country

        14.3.2. By Type

        14.3.3. By Application

    14.4. Key Takeaways

15. Key Countries Market Analysis

    15.1. USA

        15.1.1. Pricing Analysis

        15.1.2. Market Share Analysis, 2021

            15.1.2.1. By Type

            15.1.2.2. By Application

    15.2. Canada

        15.2.1. Pricing Analysis

        15.2.2. Market Share Analysis, 2021

            15.2.2.1. By Type

            15.2.2.2. By Application

    15.3. Brazil

        15.3.1. Pricing Analysis

        15.3.2. Market Share Analysis, 2021

            15.3.2.1. By Type

            15.3.2.2. By Application

    15.4. Mexico

        15.4.1. Pricing Analysis

        15.4.2. Market Share Analysis, 2021

            15.4.2.1. By Type

            15.4.2.2. By Application

    15.5. Germany

        15.5.1. Pricing Analysis

        15.5.2. Market Share Analysis, 2021

            15.5.2.1. By Type

            15.5.2.2. By Application

    15.6. United Kingdom

        15.6.1. Pricing Analysis

        15.6.2. Market Share Analysis, 2021

            15.6.2.1. By Type

            15.6.2.2. By Application

    15.7. France

        15.7.1. Pricing Analysis

        15.7.2. Market Share Analysis, 2021

            15.7.2.1. By Type

            15.7.2.2. By Application

    15.8. Spain

        15.8.1. Pricing Analysis

        15.8.2. Market Share Analysis, 2021

            15.8.2.1. By Type

            15.8.2.2. By Application

    15.9. Italy

        15.9.1. Pricing Analysis

        15.9.2. Market Share Analysis, 2021

            15.9.2.1. By Type

            15.9.2.2. By Application

    15.10. India

        15.10.1. Pricing Analysis

        15.10.2. Market Share Analysis, 2021

            15.10.2.1. By Type

            15.10.2.2. By Application

    15.11. Malaysia

        15.11.1. Pricing Analysis

        15.11.2. Market Share Analysis, 2021

            15.11.2.1. By Type

            15.11.2.2. By Application

    15.12. Singapore

        15.12.1. Pricing Analysis

        15.12.2. Market Share Analysis, 2021

            15.12.2.1. By Type

            15.12.2.2. By Application

    15.13. Thailand

        15.13.1. Pricing Analysis

        15.13.2. Market Share Analysis, 2021

            15.13.2.1. By Type

            15.13.2.2. By Application

    15.14. China

        15.14.1. Pricing Analysis

        15.14.2. Market Share Analysis, 2021

            15.14.2.1. By Type

            15.14.2.2. By Application

    15.15. Japan

        15.15.1. Pricing Analysis

        15.15.2. Market Share Analysis, 2021

            15.15.2.1. By Type

            15.15.2.2. By Application

    15.16. South Korea

        15.16.1. Pricing Analysis

        15.16.2. Market Share Analysis, 2021

            15.16.2.1. By Type

            15.16.2.2. By Application

    15.17. Australia

        15.17.1. Pricing Analysis

        15.17.2. Market Share Analysis, 2021

            15.17.2.1. By Type

            15.17.2.2. By Application

    15.18. New Zealand

        15.18.1. Pricing Analysis

        15.18.2. Market Share Analysis, 2021

            15.18.2.1. By Type

            15.18.2.2. By Application

    15.19. GCC Countries

        15.19.1. Pricing Analysis

        15.19.2. Market Share Analysis, 2021

            15.19.2.1. By Type

            15.19.2.2. By Application

    15.20. South Africa

        15.20.1. Pricing Analysis

        15.20.2. Market Share Analysis, 2021

            15.20.2.1. By Type

            15.20.2.2. By Application

    15.21. Israel

        15.21.1. Pricing Analysis

        15.21.2. Market Share Analysis, 2021

            15.21.2.1. By Type

            15.21.2.2. By Application

16. Market Structure Analysis

    16.1. Competition Dashboard

    16.2. Competition Benchmarking

    16.3. Market Share Analysis of Top Players

        16.3.1. By Regional

        16.3.2. By Type

        16.3.3. By Application

17. Competition Analysis

    17.1. Competition Deep Dive

        17.1.1. Otsuka Medical Devices Group

            17.1.1.1. Overview

            17.1.1.2. Product Portfolio

            17.1.1.3. Profitability by Market Segments

            17.1.1.4. Sales Footprint

            17.1.1.5. Strategy Overview

                17.1.1.5.1. Marketing Strategy

        17.1.2. Stryker

            17.1.2.1. Overview

            17.1.2.2. Product Portfolio

            17.1.2.3. Profitability by Market Segments

            17.1.2.4. Sales Footprint

            17.1.2.5. Strategy Overview

                17.1.2.5.1. Marketing Strategy

        17.1.3. Abbott

            17.1.3.1. Overview

            17.1.3.2. Product Portfolio

            17.1.3.3. Profitability by Market Segments

            17.1.3.4. Sales Footprint

            17.1.3.5. Strategy Overview

                17.1.3.5.1. Marketing Strategy

        17.1.4. AVINENT Science and Technology

            17.1.4.1. Overview

            17.1.4.2. Product Portfolio

            17.1.4.3. Profitability by Market Segments

            17.1.4.4. Sales Footprint

            17.1.4.5. Strategy Overview

                17.1.4.5.1. Marketing Strategy

        17.1.5. SynTouch Inc.

            17.1.5.1. Overview

            17.1.5.2. Product Portfolio

            17.1.5.3. Profitability by Market Segments

            17.1.5.4. Sales Footprint

            17.1.5.5. Strategy Overview

                17.1.5.5.1. Marketing Strategy

        17.1.6. Osteopore International Pte Ltd

            17.1.6.1. Overview

            17.1.6.2. Product Portfolio

            17.1.6.3. Profitability by Market Segments

            17.1.6.4. Sales Footprint

            17.1.6.5. Strategy Overview

                17.1.6.5.1. Marketing Strategy

        17.1.7. Vandstrom, Inc.

            17.1.7.1. Overview

            17.1.7.2. Product Portfolio

            17.1.7.3. Profitability by Market Segments

            17.1.7.4. Sales Footprint

            17.1.7.5. Strategy Overview

                17.1.7.5.1. Marketing Strategy

        17.1.8. Biomimetics Technologies Inc.

            17.1.8.1. Overview

            17.1.8.2. Product Portfolio

            17.1.8.3. Profitability by Market Segments

            17.1.8.4. Sales Footprint

            17.1.8.5. Strategy Overview

                17.1.8.5.1. Marketing Strategy

        17.1.9. Swedish Biomimetics 3000 ApS

            17.1.9.1. Overview

            17.1.9.2. Product Portfolio

            17.1.9.3. Profitability by Market Segments

            17.1.9.4. Sales Footprint

            17.1.9.5. Strategy Overview

                17.1.9.5.1. Marketing Strategy

        17.1.10. Keystone Dental Group

            17.1.10.1. Overview

            17.1.10.2. Product Portfolio

            17.1.10.3. Profitability by Market Segments

            17.1.10.4. Sales Footprint

            17.1.10.5. Strategy Overview

                17.1.10.5.1. Marketing Strategy

        17.1.11. LifeMatrix

            17.1.11.1. Overview

            17.1.11.2. Product Portfolio

            17.1.11.3. Profitability by Market Segments

            17.1.11.4. Sales Footprint

            17.1.11.5. Strategy Overview

                17.1.11.5.1. Marketing Strategy

        17.1.12. Curasan, Inc.

            17.1.12.1. Overview

            17.1.12.2. Product Portfolio

            17.1.12.3. Profitability by Market Segments

            17.1.12.4. Sales Footprint

            17.1.12.5. Strategy Overview

                17.1.12.5.1. Marketing Strategy

        17.1.13. CorNeat Vision

            17.1.13.1. Overview

            17.1.13.2. Product Portfolio

            17.1.13.3. Profitability by Market Segments

            17.1.13.4. Sales Footprint

            17.1.13.5. Strategy Overview

                17.1.13.5.1. Marketing Strategy

        17.1.14. NanoHive Medical LLC

            17.1.14.1. Overview

            17.1.14.2. Product Portfolio

            17.1.14.3. Profitability by Market Segments

            17.1.14.4. Sales Footprint

            17.1.14.5. Strategy Overview

                17.1.14.5.1. Marketing Strategy

        17.1.15. Zimmer Biomet

            17.1.15.1. Overview

            17.1.15.2. Product Portfolio

            17.1.15.3. Profitability by Market Segments

            17.1.15.4. Sales Footprint

            17.1.15.5. Strategy Overview

                17.1.15.5.1. Marketing Strategy

18. Assumptions & Acronyms Used

19. Research Methodology

Don't pay for what you don't need

Customize your report by selecting specific countries or regions and save 30%!

List of Tables

Table 1: Global Market Value (US$ Million) Forecast by Region, 2018 to 2033

Table 2: Global Market Value (US$ Million) Forecast by Type, 2018 to 2033

Table 3: Global Market Value (US$ Million) Forecast by Application, 2018 to 2033

Table 4: North America Market Value (US$ Million) Forecast by Country, 2018 to 2033

Table 5: North America Market Value (US$ Million) Forecast by Type, 2018 to 2033

Table 6: North America Market Value (US$ Million) Forecast by Application, 2018 to 2033

Table 7: Latin America Market Value (US$ Million) Forecast by Country, 2018 to 2033

Table 8: Latin America Market Value (US$ Million) Forecast by Type, 2018 to 2033

Table 9: Latin America Market Value (US$ Million) Forecast by Application, 2018 to 2033

Table 10: Europe Market Value (US$ Million) Forecast by Country, 2018 to 2033

Table 11: Europe Market Value (US$ Million) Forecast by Type, 2018 to 2033

Table 12: Europe Market Value (US$ Million) Forecast by Application, 2018 to 2033

Table 13: South Asia Market Value (US$ Million) Forecast by Country, 2018 to 2033

Table 14: South Asia Market Value (US$ Million) Forecast by Type, 2018 to 2033

Table 15: South Asia Market Value (US$ Million) Forecast by Application, 2018 to 2033

Table 16: East Asia Market Value (US$ Million) Forecast by Country, 2018 to 2033

Table 17: East Asia Market Value (US$ Million) Forecast by Type, 2018 to 2033

Table 18: East Asia Market Value (US$ Million) Forecast by Application, 2018 to 2033

Table 19: Oceania Market Value (US$ Million) Forecast by Country, 2018 to 2033

Table 20: Oceania Market Value (US$ Million) Forecast by Type, 2018 to 2033

Table 21: Oceania Market Value (US$ Million) Forecast by Application, 2018 to 2033

Table 22: MEA Market Value (US$ Million) Forecast by Country, 2018 to 2033

Table 23: MEA Market Value (US$ Million) Forecast by Type, 2018 to 2033

Table 24: MEA Market Value (US$ Million) Forecast by Application, 2018 to 2033
Sabyasachi Ghosh
Sabyasachi Ghosh

Principal Consultant

Talk to Analyst

Find your sweet spots for generating winning opportunities in this market.

List of Charts

Figure 1: Global Market Value (US$ Million) by Type, 2023 to 2033

Figure 2: Global Market Value (US$ Million) by Application, 2023 to 2033

Figure 3: Global Market Value (US$ Million) by Region, 2023 to 2033

Figure 4: Global Market Value (US$ Million) Analysis by Region, 2018 to 2033

Figure 5: Global Market Value Share (%) and BPS Analysis by Region, 2023 to 2033

Figure 6: Global Market Y-o-Y Growth (%) Projections by Region, 2023 to 2033

Figure 7: Global Market Value (US$ Million) Analysis by Type, 2018 to 2033

Figure 8: Global Market Value Share (%) and BPS Analysis by Type, 2023 to 2033

Figure 9: Global Market Y-o-Y Growth (%) Projections by Type, 2023 to 2033

Figure 10: Global Market Value (US$ Million) Analysis by Application, 2018 to 2033

Figure 11: Global Market Value Share (%) and BPS Analysis by Application, 2023 to 2033

Figure 12: Global Market Y-o-Y Growth (%) Projections by Application, 2023 to 2033

Figure 13: Global Market Attractiveness by Type, 2023 to 2033

Figure 14: Global Market Attractiveness by Application, 2023 to 2033

Figure 15: Global Market Attractiveness by Region, 2023 to 2033

Figure 16: North America Market Value (US$ Million) by Type, 2023 to 2033

Figure 17: North America Market Value (US$ Million) by Application, 2023 to 2033

Figure 18: North America Market Value (US$ Million) by Country, 2023 to 2033

Figure 19: North America Market Value (US$ Million) Analysis by Country, 2018 to 2033

Figure 20: North America Market Value Share (%) and BPS Analysis by Country, 2023 to 2033

Figure 21: North America Market Y-o-Y Growth (%) Projections by Country, 2023 to 2033

Figure 22: North America Market Value (US$ Million) Analysis by Type, 2018 to 2033

Figure 23: North America Market Value Share (%) and BPS Analysis by Type, 2023 to 2033

Figure 24: North America Market Y-o-Y Growth (%) Projections by Type, 2023 to 2033

Figure 25: North America Market Value (US$ Million) Analysis by Application, 2018 to 2033

Figure 26: North America Market Value Share (%) and BPS Analysis by Application, 2023 to 2033

Figure 27: North America Market Y-o-Y Growth (%) Projections by Application, 2023 to 2033

Figure 28: North America Market Attractiveness by Type, 2023 to 2033

Figure 29: North America Market Attractiveness by Application, 2023 to 2033

Figure 30: North America Market Attractiveness by Country, 2023 to 2033

Figure 31: Latin America Market Value (US$ Million) by Type, 2023 to 2033

Figure 32: Latin America Market Value (US$ Million) by Application, 2023 to 2033

Figure 33: Latin America Market Value (US$ Million) by Country, 2023 to 2033

Figure 34: Latin America Market Value (US$ Million) Analysis by Country, 2018 to 2033

Figure 35: Latin America Market Value Share (%) and BPS Analysis by Country, 2023 to 2033

Figure 36: Latin America Market Y-o-Y Growth (%) Projections by Country, 2023 to 2033

Figure 37: Latin America Market Value (US$ Million) Analysis by Type, 2018 to 2033

Figure 38: Latin America Market Value Share (%) and BPS Analysis by Type, 2023 to 2033

Figure 39: Latin America Market Y-o-Y Growth (%) Projections by Type, 2023 to 2033

Figure 40: Latin America Market Value (US$ Million) Analysis by Application, 2018 to 2033

Figure 41: Latin America Market Value Share (%) and BPS Analysis by Application, 2023 to 2033

Figure 42: Latin America Market Y-o-Y Growth (%) Projections by Application, 2023 to 2033

Figure 43: Latin America Market Attractiveness by Type, 2023 to 2033

Figure 44: Latin America Market Attractiveness by Application, 2023 to 2033

Figure 45: Latin America Market Attractiveness by Country, 2023 to 2033

Figure 46: Europe Market Value (US$ Million) by Type, 2023 to 2033

Figure 47: Europe Market Value (US$ Million) by Application, 2023 to 2033

Figure 48: Europe Market Value (US$ Million) by Country, 2023 to 2033

Figure 49: Europe Market Value (US$ Million) Analysis by Country, 2018 to 2033

Figure 50: Europe Market Value Share (%) and BPS Analysis by Country, 2023 to 2033

Figure 51: Europe Market Y-o-Y Growth (%) Projections by Country, 2023 to 2033

Figure 52: Europe Market Value (US$ Million) Analysis by Type, 2018 to 2033

Figure 53: Europe Market Value Share (%) and BPS Analysis by Type, 2023 to 2033

Figure 54: Europe Market Y-o-Y Growth (%) Projections by Type, 2023 to 2033

Figure 55: Europe Market Value (US$ Million) Analysis by Application, 2018 to 2033

Figure 56: Europe Market Value Share (%) and BPS Analysis by Application, 2023 to 2033

Figure 57: Europe Market Y-o-Y Growth (%) Projections by Application, 2023 to 2033

Figure 58: Europe Market Attractiveness by Type, 2023 to 2033

Figure 59: Europe Market Attractiveness by Application, 2023 to 2033

Figure 60: Europe Market Attractiveness by Country, 2023 to 2033

Figure 61: South Asia Market Value (US$ Million) by Type, 2023 to 2033

Figure 62: South Asia Market Value (US$ Million) by Application, 2023 to 2033

Figure 63: South Asia Market Value (US$ Million) by Country, 2023 to 2033

Figure 64: South Asia Market Value (US$ Million) Analysis by Country, 2018 to 2033

Figure 65: South Asia Market Value Share (%) and BPS Analysis by Country, 2023 to 2033

Figure 66: South Asia Market Y-o-Y Growth (%) Projections by Country, 2023 to 2033

Figure 67: South Asia Market Value (US$ Million) Analysis by Type, 2018 to 2033

Figure 68: South Asia Market Value Share (%) and BPS Analysis by Type, 2023 to 2033

Figure 69: South Asia Market Y-o-Y Growth (%) Projections by Type, 2023 to 2033

Figure 70: South Asia Market Value (US$ Million) Analysis by Application, 2018 to 2033

Figure 71: South Asia Market Value Share (%) and BPS Analysis by Application, 2023 to 2033

Figure 72: South Asia Market Y-o-Y Growth (%) Projections by Application, 2023 to 2033

Figure 73: South Asia Market Attractiveness by Type, 2023 to 2033

Figure 74: South Asia Market Attractiveness by Application, 2023 to 2033

Figure 75: South Asia Market Attractiveness by Country, 2023 to 2033

Figure 76: East Asia Market Value (US$ Million) by Type, 2023 to 2033

Figure 77: East Asia Market Value (US$ Million) by Application, 2023 to 2033

Figure 78: East Asia Market Value (US$ Million) by Country, 2023 to 2033

Figure 79: East Asia Market Value (US$ Million) Analysis by Country, 2018 to 2033

Figure 80: East Asia Market Value Share (%) and BPS Analysis by Country, 2023 to 2033

Figure 81: East Asia Market Y-o-Y Growth (%) Projections by Country, 2023 to 2033

Figure 82: East Asia Market Value (US$ Million) Analysis by Type, 2018 to 2033

Figure 83: East Asia Market Value Share (%) and BPS Analysis by Type, 2023 to 2033

Figure 84: East Asia Market Y-o-Y Growth (%) Projections by Type, 2023 to 2033

Figure 85: East Asia Market Value (US$ Million) Analysis by Application, 2018 to 2033

Figure 86: East Asia Market Value Share (%) and BPS Analysis by Application, 2023 to 2033

Figure 87: East Asia Market Y-o-Y Growth (%) Projections by Application, 2023 to 2033

Figure 88: East Asia Market Attractiveness by Type, 2023 to 2033

Figure 89: East Asia Market Attractiveness by Application, 2023 to 2033

Figure 90: East Asia Market Attractiveness by Country, 2023 to 2033

Figure 91: Oceania Market Value (US$ Million) by Type, 2023 to 2033

Figure 92: Oceania Market Value (US$ Million) by Application, 2023 to 2033

Figure 93: Oceania Market Value (US$ Million) by Country, 2023 to 2033

Figure 94: Oceania Market Value (US$ Million) Analysis by Country, 2018 to 2033

Figure 95: Oceania Market Value Share (%) and BPS Analysis by Country, 2023 to 2033

Figure 96: Oceania Market Y-o-Y Growth (%) Projections by Country, 2023 to 2033

Figure 97: Oceania Market Value (US$ Million) Analysis by Type, 2018 to 2033

Figure 98: Oceania Market Value Share (%) and BPS Analysis by Type, 2023 to 2033

Figure 99: Oceania Market Y-o-Y Growth (%) Projections by Type, 2023 to 2033

Figure 100: Oceania Market Value (US$ Million) Analysis by Application, 2018 to 2033

Figure 101: Oceania Market Value Share (%) and BPS Analysis by Application, 2023 to 2033

Figure 102: Oceania Market Y-o-Y Growth (%) Projections by Application, 2023 to 2033

Figure 103: Oceania Market Attractiveness by Type, 2023 to 2033

Figure 104: Oceania Market Attractiveness by Application, 2023 to 2033

Figure 105: Oceania Market Attractiveness by Country, 2023 to 2033

Figure 106: MEA Market Value (US$ Million) by Type, 2023 to 2033

Figure 107: MEA Market Value (US$ Million) by Application, 2023 to 2033

Figure 108: MEA Market Value (US$ Million) by Country, 2023 to 2033

Figure 109: MEA Market Value (US$ Million) Analysis by Country, 2018 to 2033

Figure 110: MEA Market Value Share (%) and BPS Analysis by Country, 2023 to 2033

Figure 111: MEA Market Y-o-Y Growth (%) Projections by Country, 2023 to 2033

Figure 112: MEA Market Value (US$ Million) Analysis by Type, 2018 to 2033

Figure 113: MEA Market Value Share (%) and BPS Analysis by Type, 2023 to 2033

Figure 114: MEA Market Y-o-Y Growth (%) Projections by Type, 2023 to 2033

Figure 115: MEA Market Value (US$ Million) Analysis by Application, 2018 to 2033

Figure 116: MEA Market Value Share (%) and BPS Analysis by Application, 2023 to 2033

Figure 117: MEA Market Y-o-Y Growth (%) Projections by Application, 2023 to 2033

Figure 118: MEA Market Attractiveness by Type, 2023 to 2033

Figure 119: MEA Market Attractiveness by Application, 2023 to 2033

Figure 120: MEA Market Attractiveness by Country, 2023 to 2033

Recommendations

Healthcare

Cardiac Biomarker Diagnostic Test Kits Market

Published : September 2023

Healthcare

Biologics Market

Published : October 2022

Explore Healthcare Insights

View Reports

Medical Biomimetics Market