Reports

- Global Locations -

Headquarters

Future Market Insights, Inc.

Christiana Corporate, 200
Continental Drive, Suite 401,
Newark, Delaware - 19713,
United States

T: +1-845-579-5705

Americas

Future Market Insights, Inc.

616 Corporate Way, Suite 2-9018,
Valley Cottage, NY 10989, United States

T: +1-347-918-3531

MEA

Future Market Insights

1602-6 Jumeirah Bay X2 Tower, Plot No: JLT-PH2-X2A,
Jumeirah Lakes Towers, Dubai,
United Arab Emirates

Europe

Future Market Insights

3rd Floor, 207 Regent Street,
W1B 3HH London
United Kingdom

T: + 44 (0) 20 8123 9659
D: +44 (0) 20 3287 4268

Asia Pacific

Future Market Insights

IndiaLand Global Tech Park, Unit UG-1, Behind Grand HighStreet, Phase 1, Hinjawadi, MH, Pune – 411057, India

Medical Plastics Market Outlook (2023 to 2033)

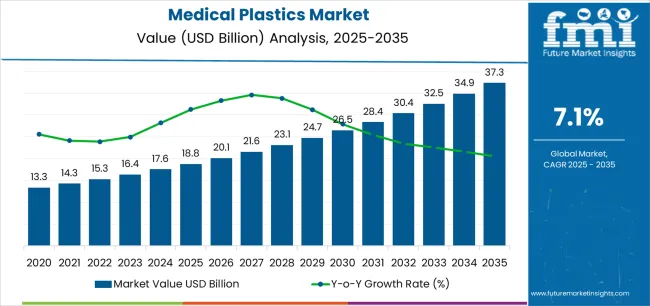
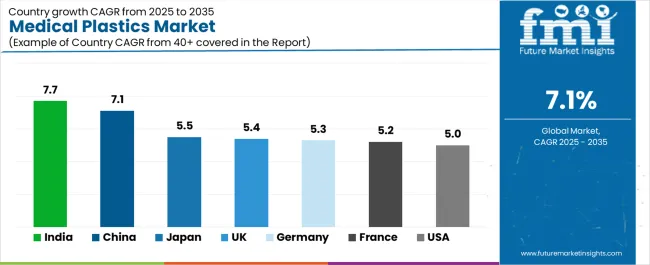
The global medical plastics market size reached US$ 15,439.8 million in 2022. Demand for medical plastics registered a 6.6% year-on-year growth in 2022, indicating that the global market would reach US$ 16,462.6 million in 2023. Over the projection period from 2023 to 2033, global sales of medical plastics are expected to exhibit a 7.0% CAGR, ultimately totaling a market size of US$ 32,293.4 million by the end of 2033.

Medical plastic demand is on the rise worldwide due to their indispensable role in ensuring the safety and hygiene of healthcare settings. With a growing global population and increasing chronic diseases, the healthcare sector is expanding rapidly. It is projected to create a surging demand for medical equipment and devices.

Medical plastics serve as a critical component in the manufacturing of a wide range of products, including syringes, IV tubes, catheters, surgical instruments, and diagnostic devices. These are projected to contribute to the growth in demand.

Advancements in medical technology and innovations are set to propel demand for medical plastics. As medical research progresses, there is a constant need for improved and specialized medical devices that are lightweight and durable.

Demand for unique medical devices that are compatible with various sterilization methods might also expand. Medical-grade plastics are set to offer an ideal solution. They can be molded into complex shapes, incorporate unique features, and maintain their functionality under demanding medical conditions.

Global focus on infection control and patient safety has further fueled demand for medical plastics. Hospitals and healthcare facilities are continuously seeking ways to minimize the risk of infections and improve patient outcomes.

Medical plastics possess inherent antimicrobial properties and can be easily cleaned & sterilized. They can help in reducing the potential for contamination and infection transmission, making them a preferred choice for medical equipment and disposable items.

Environmental considerations might also play a significant role in driving the demand for medical plastics. As sustainability becomes a priority for various sectors, including healthcare, there is a growing demand for eco-friendly medical solutions.

Medical plastics have evolved to be more environmentally friendly. Manufacturers are projected to use biodegradable and recyclable materials, reducing the environmental impact of medical waste.

Increasing focus on personalized medicine and minimally invasive procedures is likely to push demand for medical plastics worldwide. As healthcare shifts toward patient-centric approaches, there is a growing need for medical devices that can be customized to individual patient requirements.

Medical-grade plastics offer the versatility required to develop personalized implants, prosthetics, and surgical tools. Additionally, trend toward minimally invasive surgeries might augment demand for precision-engineered medical plastics.

Demand for innovative plastics that can deliver optimal performance while reducing trauma and scarring might increase. Versatility and adaptability of medical plastics would make them a crucial component in meeting the evolving demands of modern healthcare practices.

Attributes Key Insights
Medical Plastics Market Estimated Size (2023E) US$ 16,462.6 million
Projected Market Valuation (2033F) US$ 32,293.4 million
Value-based CAGR (2023 to 2033) 7.0%
Collective Value Share: Top 5 Countries (2023E) 45.2%

Don't pay for what you don't need

Customize your report by selecting specific countries or regions and save 30%!

2018 to 2022 Medical Plastic Sales Outlook Compared to Demand Forecast from 2023 to 2033

According to Future Market Insights (FMI), the medical plastics market observed significant growth at a CAGR of 6.0% in the historical period from 2018 to 2022. The pandemic, with its unprecedented challenges and overwhelming need for medical supplies, had accelerated demand for medical plastics.

The pandemic emphasized the importance of having a robust healthcare infrastructure and sufficient medical equipment & supplies readily available. Medical plastics played a crucial role in the production of personal protective equipment (PPE), face shields, and various medical devices used in diagnosis & treatment. As countries strived to strengthen their healthcare systems, medical plastic demand remained at the forefront of the global medical sector.

In recent years, popularity of medical plastics has experienced a substantial increase due to growing emphasis on cost-effectiveness in healthcare. As healthcare systems face budget constraints and need to optimize resource allocation, medical plastics offer an attractive solution.

Compared to traditional materials such as metals or glass, medical plastics are often more affordable to manufacture. Hence, these are considered a cost-efficient choice for medical equipment and devices. Their lightweight nature can also contribute to reduced transportation costs and ease of handling, further bolstering their appeal to healthcare providers worldwide.

Rise of telemedicine and remote healthcare services has further driven demand for medical plastics. With advancement of technology, more medical procedures and consultations can now be conducted remotely, leading to a demand for lightweight, portable medical devices.

Medical plastics enable the development of compact and wireless devices such as remote monitoring tools, wearable health trackers, and portable diagnostic equipment. They might help in empowering patients to take an active role in managing their health from the comfort of their homes. Shift toward telehealth has, in turn, propelled the popularity of medical plastics in meeting the evolving needs of modern healthcare delivery.

Comparative View of Adjacent Medical Plastics Market

Medical Plastics Market:

Attributes Medical Plastics Market
CAGR (2023 to 2033) 7.0%
Market Value (2023) US$ 16,462.6 million
Growth Factor Increasing demand for single-use medical devices in healthcare settings would propel sales.
Key Trend Growing utilization of antimicrobial medical plastics to enhance infection control is a key trend.

Plastic Compounding Market:

Attributes Plastic Compounding Market
CAGR (2023 to 2033) 8.3%
Market Value (2023) US$ 69.919 billion
Growth Factor Rising demand for lightweight & durable materials in automotive and aerospace sectors would aid growth.
Key Trend Adoption of sustainable practices and materials in plastic compounding processes is a leading trend.

Biocompatible Polymers Market:

Attributes Biocompatible Polymers Market
CAGR (2022 to 2032) 6.8%
Market Value (2023) US$ 957 million
Growth Factor Surging demand for implantable medical devices and tissue engineering applications is set to push growth.
Key Trend Development of biodegradable and bioresorbable biocompatible polymers for medical use is a significant trend.
Nikhil Kaitwade
Nikhil Kaitwade

Principal Consultant

Talk to Analyst

Find your sweet spots for generating winning opportunities in this market.

Which Factors Are Pushing Medical Plastic Demand Worldwide?

  • Rapid Shift toward Minimally Invasive Procedures

Shift toward minimally invasive procedures has been a significant driver for growth in the medical plastics market. Minimally invasive procedures involve using small incisions or natural body openings to perform surgeries or medical interventions, instead of traditional open surgeries.

The approach offers numerous advantages, including reduced trauma to patients, faster recovery times, shorter hospital stays, and minimal scarring. Medical plastics play a crucial role in enabling these procedures by providing the necessary tools and equipment.

They are used to make a wide range of medical supplies and devices such as catheters, surgical instruments, implants, medication delivery systems, and diagnostic gadgets. These devices require materials that are sterile, biocompatible, lightweight.

Materials that have exceptional mechanical properties are also required. Medical plastics can be utilized to create instruments and devices needed for minimally invasive procedures as they satisfy these requirements.

Rising demand for these procedures, driven by patient preferences and advancements in medical technology, has led to a corresponding increase in the demand for medical plastics. Manufacturers and healthcare providers' efforts to satisfy demands of the expanding minimally invasive surgery sector are likely to accelerate the medical plastics industry.

  • Self-administration of Drugs and Development of New Drug Delivery Technologies

Growing trend of self-administration of drugs and development of new drug delivery technologies are creating significant opportunities in the market. As patients increasingly take an active role in their healthcare, there is a rising demand for user-friendly and convenient drug delivery systems.

The trend has led to the development of innovative medical devices such as auto-injectors, inhalers, and wearable injectors. These might allow patients to self-administer medications at home or on the go. These devices often rely on medical plastics due to their versatility, biocompatibility, and ability to meet stringent regulatory requirements.

Medical plastics enable the production of components such as drug cartridges, syringes, and inhaler parts, ensuring precise drug delivery and patient safety. Integration of electronics, sensors, and connectivity features in drug delivery devices might further enhance their functionality and patient monitoring capabilities.

Expanding space of self-administered drug delivery, coupled with advancements in technology, would present lucrative opportunities for the medical plastics industry. It is projected to develop innovative solutions that cater to patient needs, improve treatment adherence, and enhance healthcare outcomes.

Which Factors Might Impede Medical Plastic Sales Worldwide?

  • Concerns over plastic waste and environmental impact might limit demand.
  • Limited biodegradability and recycling options for certain medical plastics might hamper sales.
  • Competition from alternative materials such as bioresorbable polymers and metals might impede demand.
  • Reluctance among a few healthcare professionals to adopt new plastic-based medical technologies might obstruct sales.

Get the data you need at a Fraction of the cost

Personalize your report by choosing insights you need
and save 40%!

Country-wise Insights

Why is Medical Plastic Demand Increasing Rapidly in the United States?

High Prevalence of Chronic Diseases in the United States to Push Demand for Medical Plastic Devices

In North America, the United States is expected to lead the medical plastics industry by 2033. North America is estimated to hold around 34.1% of the global medical plastics market share in 2023.

Medical plastic demand is expected to surge in the United States due to increasing aging population. As the baby boomer generation continues to age, there is a higher prevalence of chronic diseases and a greater need for medical treatments and procedures.

Medical plastics might play a crucial role in various medical devices, equipment, and implants. They are likely to help in meeting the growing demand for healthcare solutions among the elderly population.

Emphasis on infection control and patient safety in healthcare settings has also led to an increased adoption of medical plastics. The United States healthcare sector is keen on preventing hospital-acquired infections and improving patient outcomes.

Medical plastics possess inherent antimicrobial properties and are easily sterilizable. This might make them an ideal choice for producing medical devices and equipment that adhere to the highest hygiene standards.

Why Are Medical Plastic Sales Surging Astonishingly in China?

Expansion of Medical Tourism Sector in China to Augment Sales of Medical Plastic Equipment

Medical plastic sales are experiencing an astonishing surge in China due to the country's rapidly expanding healthcare infrastructure. With a growing middle-class population and increased government investment in healthcare facilities, demand for medical devices has skyrocketed.

Medical plastics have become a preferred choice for manufacturers and healthcare providers in China. Ongoing modernization and development of hospitals & clinics across the country have further fueled the need for medical-grade plastics. These are set to help equip these facilities with cutting-edge medical technologies.

Another significant factor pushing the remarkable growth in China is the country's thriving medical tourism sector. China has emerged as a popular destination for medical tourism. It has been attracting patients from around the world seeking high-quality medical treatments at competitive prices.

As medical tourists flock to China for various procedures, there is a rising demand for medical devices and equipment, including those made from medical plastics. Ability of medical plastics to offer a balance between cost-effectiveness and performance might make them a key component in catering to diverse needs of patients. This burgeoning medical tourism sector is set to contribute substantially to the astonishing rise in medical plastic sales in China.

Category-wise Insights

Which is the Highly Preferred Type of Medical Plastic Worldwide?

Demand for Medical Grade Plastic Made of PVC to Witness High Demand by 2033

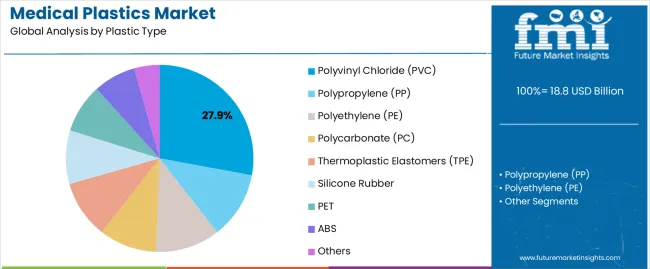
The polyvinyl chloride (PVC) segment is estimated to hold around 15.2% of the medical plastics market share in terms of value in 2023. PVC has a wide range of qualities that make it suited for numerous medical applications, including tubing, IV bags, and medical packaging.

It is less expensive than other materials, making it an appealing choice for healthcare providers trying to cut costs. PVC is highly compatible with a wide range of sterilization procedures, ensuring the safety and integrity of medical products.

Continued research & development efforts have resulted in the production of PVC compounds with improved biocompatibility and lower toxicity. PVC's large market share is likely to be driven by rising demand for cost-effective, dependable, and adaptable medical devices & equipment.

Which is the Leading End-use Segment of Medical Plastics Globally?

Supportive Government Norms to Fuel Use of Plastic Medical Products in Medical Parts & Components

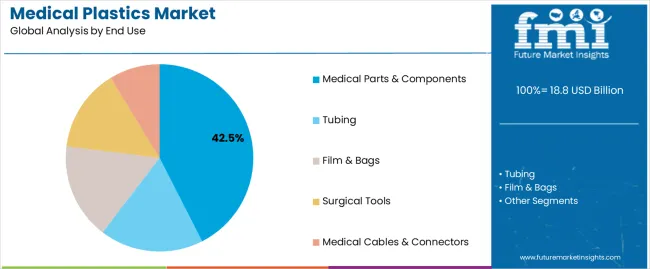
Globally, the medical parts and components segment held the largest revenue share of over 42% and dominated the end user category in 2022. It is anticipated that growing scope of applications for medical plastics in the production of diagnostic devices, pans, trays, containers, implant trials, syringes, and medical cover sheets will drive demand.

Low weight, high bacterial & chemical resistance, and low cost of polypropylene are also expected to propel its growth in medical components applications. This material has varied applications in medical disposable manufacturing. Also, it can be easily molded to precise dimensions, which might make it popular for the manufacturing of syringes.

As a result of their versatility, medical plastics are being used more worldwide. As a single-use product, medical components are used in both surgical and procedural procedures. There has been an increasing use of these medical products in procedural applications and general checkups.

Implementation of supportive norms by the United States Food and Drug Administration (FDA) might further push demand. Increasing incidence of chronic diseases among middle-income groups, changing lifestyles, and rising aging population are the key factors driving this segment in the market.

Competitive Landscape

Medical plastic manufacturers are investing in research & development to create innovative medical plastics that offer unique features, improved performance, and enhanced functionality. Developing new materials and technologies allows them to offer cutting-edge solutions to healthcare providers, giving them a competitive advantage over traditional products.

They are increasingly focusing on offering customized and personalized solutions to meet specific needs of healthcare facilities and end users. By providing tailor-made products and services, they can better address diverse demands of the healthcare sector and strengthen their customer relationships.

To remain competitive, a few manufacturers are optimizing their production processes to reduce costs while maintaining high-quality standards. Cost-effectiveness is crucial in a competitive market, as it enables them to offer competitive pricing to customers without compromising on product quality.

For instance,

  • In March 2022, to fulfill the rising need for alternatives to fossil-based materials throughout the world, ABB Technology (ABB) automated NatureWorks' greenfield bioplastics facility in Thailand. The new facility will produce 75,000 metric tons of Ingeo PLA (polylactic acid) biopolymer per year.
  • In June, 2023, in order to provide colored grades of Ultrason high-performance polymers on the international market, Avient Corporation and BASF worked together. Through this partnership, consumers in the healthcare and other sectors are given a complete solution, starting with the base polymer and ending with the colored final product.

Scope of the Report

Report Attributes Details
Estimated Market Size (2023) US$ 16,462.6 million
Estimated Market Size (2023) US$ 32,293.4 million
Value-based CAGR (2023 to 2033) 7.0%
Forecast Period 2023 to 2033
Historical Data Available for 2018 to 2022
Quantitative Units Value (US$ million) and Volume (kilo tons)
Key Countries Covered United States, Canada, Brazil, Mexico, Argentina, Germany, Italy, France, United Kingdom, Spain, Benelux, Nordics, Poland, Romania, Hungary, Czech Republic, China, Japan, South Korea, India, Australia, and Zealand, Association of Southeast Asian Nations, Türkiye, South Africa, Gulf Cooperation Council Countries
Key Segments Covered Plastic Type, End Use, and Region
Key Companies Profiled
  • INEOS
  • Advanced Plastiform, Inc
  • ELIX Polymers
  • Arkema
  • BASF SE
  • Cleanse Corp
  • Covestro LLC
  • DuPont de Nemours, Inc.
  • Eastman Chemical Company
  • EMCO Industrial Plastic Inc
  • Hanwha Group
  • HMC Polymers
  • LyondellBasell Industries N.V.
  • Others
Report Coverage Market Forecast, Company Share Analysis, Competition Intelligence, Drivers, Restraints, Opportunities, Trends Analysis, Market Dynamics and Challenges, and Strategic Growth Initiatives

Medical Plastics Market Outlook by Category

By Plastic Type :

  • Polyvinyl Chloride (PVC)
  • Thermoplastic Elastomer (TPE)
    • Thermoplastic Elastomer Vulcanizates (TPE-V)
    • Thermoplastic Elastomer Styrenics (TPE-S)
  • Polyethylene (PE)
  • Polycarbonate (PC)
  • Polypropylene (PP)
  • Polyethylene Terephthalate (PET)
  • Polyamides
  • Thermoplastic Polyurethane (TPU)
  • Polymethyl Methacrylate
  • Acrylonitrile Butadiene Styrene (ABS)
  • Silicone Rubber
    • Liquid Silicone Rubber
    • High Consistency Rubber
    • Room Temperature Vulcanizing (RTV) Silicone
    • Silicone Adhesives
    • Others

By End Use:

  • Medical Parts & Components
    • Dropper Bulbs
    • Drip Chambers
    • Gaskets & Stoppers
    • Orthopedics
    • Blood Collection Chambers
    • Medical Containers
    • Others
  • Tubing
    • Catheter Tubing
    • Drug Delivery
    • Gas Supply
    • Peristaltic Pump
    • Oxygen Tubing
    • Blood Transport & Delivery
    • Others
  • Film and Bags
    • Biopharmaceutical Storage
    • Saline Bags
    • Waste Bags
    • Others
  • Surgical Tools
    • Scalpels
    • Forceps
    • Scissors
    • Others
  • Medical Cables and Connectors
    • Diagnostic Equipment
    • Prosthetics
    • Others

By Region:

  • North America
  • Latin America
  • Western Europe
  • Eastern Europe
  • East Asia
  • South Asia Pacific
  • Russia and Belarus
  • Balkan and Baltics
  • Central Asia
  • Middle East and Africa

Frequently Asked Questions

Which Plastic Type holds Lucrative Opportunities?

Polyvinyl Chloride segment holds high revenue potential.

Which Countries Dominate the Medical Plastics Market?

The United States and China are estimated to dominate the global market.

What is the Growth Forecast for the Medical Plastics Market?

The market is forecast to register a CAGR of 7% through 2033.

How is the Historical Performance of the Medical Plastics Market?

During 2018 to 2022, the market registered a CAGR of 6%.

Which is the Top Trend in the Medical Plastics Market?

The rising focus on infection control and patients safety are the current market trends.

Table of Content

1. Executive Summary

    1.1. Global Market Outlook

    1.2. Demand Side Trends

    1.3. Supply Side Trends

    1.4. Type Roadmap

    1.5. Analysis and Recommendations

2. Market Overview

    2.1. Market Coverage / Taxonomy

    2.2. Market Definition / Scope / Limitations

3. Key Market Trends

    3.1. Supply Side Trends

    3.2. Demand Side Trends

    3.3. Key Trends Impacting the Market

    3.4. Product Innovation / Development Trends

4. Key Success Factors

    4.1. Product Adoption / Usage Analysis

    4.2. Product USPs / Features

    4.3. Strategic Promotional Strategies

5. Global Market Demand Analysis 2018 to 2022 and Forecast, 2023 to 2033

    5.1. Historical Market Volume (kilo tons) Analysis, 2018 to 2022

    5.2. Current and Future Market Volume (kilo tons) Projections, 2023 to 2033

    5.3. Y-o-Y Growth Trend Analysis

6. Global Market - Pricing Analysis

    6.1. Regional Pricing Analysis By Plastic Type

    6.2. Cost Teardown Analysis

    6.3. Global Average Pricing Analysis Benchmark

7. Global Market Demand (in Value or Size in US$ Million)Analysis 2018 to 2022 and Forecast, 2023 to 2033

    7.1. Historical Market Value (US$ Million)Analysis, 2018 to 2022

    7.2. Current and Future Market Value (US$ Million)Projections, 2023 to 2033

        7.2.1. Y-o-Y Growth Trend Analysis

        7.2.2. Absolute $ Opportunity Analysis

8. Market Background

    8.1. Macro-Economic Factors

    8.2. Forecast Factors - Relevance & Impact

    8.3. Value Chain Analysis

        8.3.1. Product Manufacturers

        8.3.2. Probable End Users

        8.3.3. Avg. Profitability Margins

    8.4. COVID-19 Crisis – Impact Assessment

        8.4.1. Current Statistics

        8.4.2. Short-Mid-Long Term Outlook

        8.4.3. Likely Rebound

    8.5. Market Dynamics

        8.5.1. Drivers

        8.5.2. Restraints

        8.5.3. Opportunity Analysis

    8.6. Region-wise Demand Supply Analysis

    8.7. Porter’s Five Forces Analysis

    8.8. Parent Market Overview

    8.9. Import and Export Value Analysis (HS Code – 901839)

    8.10. Product Type Application Preference Analysis

9. Global Market Analysis 2018 to 2022 and Forecast 2023 to 2033, By Plastic Type

    9.1. Introduction / Key Findings

    9.2. Historical Market Size (US$ Million) and Volume Analysis By Plastic Type, 2018 to 2022

    9.3. Current and Future Market Size (US$ Million) and Volume Analysis and Forecast By Plastic Type, 2023 to 2033

        9.3.1. Polyvinyl Chloride (PVC)

        9.3.2. Thermoplastic Elastomer (TPE)

            9.3.2.1. Thermoplastic Elastomer Styrenics (TPE-S)

            9.3.2.2. Thermoplastic Elastomer Vulcanizates (TPE-V)

        9.3.3. Polyethylene (PE)

        9.3.4. Polycarbonate (PC)

        9.3.5. Polypropylene (PP)

        9.3.6. Polyethylene Terephthalate (PET)

        9.3.7. Polyamides

        9.3.8. Thermoplastic Polyurethane (TPU)

        9.3.9. Polymethyl Methacrylate

        9.3.10. Acrylonitrile Butadiene Styrene (ABS)

        9.3.11. Silicone Rubber

            9.3.11.1. Liquid Silicone Rubber

            9.3.11.2. High Consistency Rubber

            9.3.11.3. Room Temperature Vulcanizing (RTV) Silicone

            9.3.11.4. Silicone Adhesives

        9.3.12. Others

    9.4. Market Attractiveness Analysis By Plastic Type

10. Global Market Analysis 2018 to 2022 and Forecast 2023 to 2033, By End Use

    10.1. Introduction / Key Findings

    10.2. Historical Market Size (US$ Million) and Volume Analysis By End Use, 2018 to 2022

    10.3. Current and Future Market Size (US$ Million) and Volume Analysis and Forecast By End Use, 2023 to 2033

        10.3.1. Medical Parts & Components

            10.3.1.1. Dropper Bulbs

            10.3.1.2. Drip Chambers

            10.3.1.3. Gaskets & Stoppers

            10.3.1.4. Orthopedics

            10.3.1.5. Blood Collection Chambers

            10.3.1.6. Medical Containers

            10.3.1.7. Others

        10.3.2. Tubing

            10.3.2.1. Catheter Tubing

            10.3.2.2. Drug Delivery

            10.3.2.3. Gas Supply

            10.3.2.4. Peristaltic Pump

            10.3.2.5. Oxygen Tubing

            10.3.2.6. Blood Transport & Delivery Tubing

            10.3.2.7. Others

        10.3.3. Film and Bags

            10.3.3.1. Biopharmaceutical Storage

            10.3.3.2. Saline Bags

            10.3.3.3. Waste Bags

            10.3.3.4. Others

        10.3.4. Surgical Tools

            10.3.4.1. Scalpels

            10.3.4.2. Forceps

            10.3.4.3. Scissors

            10.3.4.4. Others

        10.3.5. Medical Cables and Connectors

        10.3.6. Diagnostic Equipment

        10.3.7. Prosthetics

        10.3.8. Others

    10.4. Market Attractiveness Analysis By End Use

11. Global Market Analysis 2018 to 2022 and Forecast 2023 to 2033, by Region

    11.1. Introduction

    11.2. Historical Market Size (US$ Million) and Volume Analysis By Region, 2018 to 2022

    11.3. Current Market Size (US$ Million) and Volume Analysis and Forecast By Region, 2023 to 2033

        11.3.1. North America

        11.3.2. Latin America

        11.3.3. Western Europe

        11.3.4. Eastern Europe

        11.3.5. Central Asia

        11.3.6. Russia & Belarus

        11.3.7. Balkan & Baltic Countries

        11.3.8. Middle East and Africa

        11.3.9. East Asia

        11.3.10. South Asia and Pacific

    11.4. Market Attractiveness Analysis By Region

12. North America Market Analysis 2018 to 2022 and Forecast 2023 to 2033

    12.1. Introduction

    12.2. Pricing Analysis

    12.3. Historical Market Size (US$ Million) and Volume Trend Analysis By Market Taxonomy, 2018 to 2022

    12.4. Market Size (US$ Million) and Volume Forecast By Market Taxonomy, 2023 to 2033

        12.4.1. By Country

            12.4.1.1. United States

            12.4.1.2. Canada

        12.4.2. By Plastic Type

        12.4.3. By End Use

    12.5. Market Attractiveness Analysis

        12.5.1. By Country

        12.5.2. By Plastic Type

        12.5.3. By End Use

    12.6. Drivers and Restraints - Impact Analysis

13. Latin America Market Analysis 2018 to 2022 and Forecast 2023 to 2033

    13.1. Introduction

    13.2. Pricing Analysis

    13.3. Historical Market Size (US$ Million) and Volume Trend Analysis By Market Taxonomy, 2018 to 2022

    13.4. Market Size (US$ Million) and Volume Forecast By Market Taxonomy, 2023 to 2033

        13.4.1. By Country

            13.4.1.1. Brazil

            13.4.1.2. Mexico

            13.4.1.3. Argentina

            13.4.1.4. Rest of Latin America

        13.4.2. By Plastic Type

        13.4.3. By End Use

    13.5. Market Attractiveness Analysis

        13.5.1. By Country

        13.5.2. By Plastic Type

        13.5.3. By End Use

    13.6. Drivers and Restraints - Impact Analysis

14. Western Europe Market Analysis 2018 to 2022 and Forecast 2023 to 2033

    14.1. Introduction

    14.2. Pricing Analysis

    14.3. Historical Market Size (US$ Million) and Volume Trend Analysis By Market Taxonomy, 2018 to 2022

    14.4. Market Size (US$ Million) and Volume Forecast By Market Taxonomy, 2023 to 2033

        14.4.1. By Country

            14.4.1.1. Germany

            14.4.1.2. Italy

            14.4.1.3. France

            14.4.1.4. United Kingdom

            14.4.1.5. Spain

            14.4.1.6. BENELUX

            14.4.1.7. NORDICS

            14.4.1.8. Rest of Western Europe

        14.4.2. By Plastic Type

        14.4.3. By End Use

    14.5. Market Attractiveness Analysis

        14.5.1. By Country

        14.5.2. By Plastic Type

        14.5.3. By End Use

    14.6. Drivers and Restraints - Impact Analysis

15. Eastern Europe Market Analysis 2018 to 2022 and Forecast 2023 to 2033

    15.1. Introduction

    15.2. Pricing Analysis

    15.3. Historical Market Size (US$ Million) and Volume Trend Analysis By Market Taxonomy, 2018 to 2022

    15.4. Market Size (US$ Million) and Volume Forecast By Market Taxonomy, 2023 to 2033

        15.4.1. By Country

            15.4.1.1. Poland

            15.4.1.2. Hungary

            15.4.1.3. Czech Republic

            15.4.1.4. Rest of Eastern Europe

        15.4.2. By Plastic Type

        15.4.3. By End Use

    15.5. Market Attractiveness Analysis

        15.5.1. By Country

        15.5.2. By Plastic Type

        15.5.3. By End Use

    15.6. Drivers and Restraints - Impact Analysis

16. Central Asia Market Analysis 2018 to 2022 and Forecast 2023 to 2033

    16.1. Introduction

    16.2. Pricing Analysis

    16.3. Historical Market Size (US$ Million) and Volume Trend Analysis By Market Taxonomy, 2018 to 2022

    16.4. Market Size (US$ Million) and Volume Forecast By Market Taxonomy, 2023 to 2033

        16.4.1. By Plastic Type

        16.4.2. By End Use

    16.5. Market Attractiveness Analysis

        16.5.1. By Plastic Type

        16.5.2. By End Use

    16.6. Drivers and Restraints - Impact Analysis

17. Russia & Belarus Market Analysis 2018 to 2022 and Forecast 2023 to 2033

    17.1. Introduction

    17.2. Pricing Analysis

    17.3. Historical Market Size (US$ Million) and Volume Trend Analysis By Market Taxonomy, 2018 to 2022

    17.4. Market Size (US$ Million) and Volume Forecast By Market Taxonomy, 2023 to 2033

        17.4.1. By Plastic Type

        17.4.2. By End Use

    17.5. Market Attractiveness Analysis

        17.5.1. By Plastic Type

        17.5.2. By End Use

    17.6. Drivers and Restraints - Impact Analysis

18. Balkan & Baltic Countries Market Analysis 2018 to 2022 and Forecast 2023 to 2033

    18.1. Introduction

    18.2. Pricing Analysis

    18.3. Historical Market Size (US$ Million) and Volume Trend Analysis By Market Taxonomy, 2018 to 2022

    18.4. Market Size (US$ Million) and Volume Forecast By Market Taxonomy, 2023 to 2033

        18.4.1. By Plastic Type

        18.4.2. By End Use

    18.5. Market Attractiveness Analysis

        18.5.1. By Plastic Type

        18.5.2. By End Use

    18.6. Drivers and Restraints - Impact Analysis

19. South Asia and Pacific Market Analysis 2018 to 2022 and Forecast 2023 to 2033

    19.1. Introduction

    19.2. Pricing Analysis

    19.3. Historical Market Size (US$ Million) and Volume Trend Analysis By Market Taxonomy, 2018 to 2022

    19.4. Market Size (US$ Million) and Volume Forecast By Market Taxonomy, 2023 to 2033

        19.4.1. By Country

            19.4.1.1. India

            19.4.1.2. Association of Southeast Asian Nations

            19.4.1.3. Oceania

            19.4.1.4. Rest of South Asia & Pacific

        19.4.2. By Plastic Type

        19.4.3. By End Use

    19.5. Market Attractiveness Analysis

        19.5.1. By Country

        19.5.2. By Plastic Type

        19.5.3. By End Use

    19.6. Drivers and Restraints - Impact Analysis

20. East Asia Market Analysis 2018 to 2022 and Forecast 2023 to 2033

    20.1. Introduction

    20.2. Pricing Analysis

    20.3. Historical Market Size (US$ Million) and Volume Trend Analysis By Market Taxonomy, 2018 to 2022

    20.4. Market Size (US$ Million) and Volume Forecast By Market Taxonomy, 2023 to 2033

        20.4.1. By Country

            20.4.1.1. China

            20.4.1.2. Japan

            20.4.1.3. South Korea

        20.4.2. By Plastic Type

        20.4.3. By End Use

    20.5. Market Attractiveness Analysis

        20.5.1. By Country

        20.5.2. By Plastic Type

        20.5.3. By End Use

    20.6. Drivers and Restraints - Impact Analysis

21. Middle East and Africa Market Analysis 2018 to 2022 and Forecast 2023 to 2033

    21.1. Introduction

    21.2. Pricing Analysis

    21.3. Historical Market Size (US$ Million) and Volume Trend Analysis By Market Taxonomy, 2018 to 2022

    21.4. Market Size (US$ Million) and Volume Forecast By Market Taxonomy, 2023 to 2033

        21.4.1. By Country

            21.4.1.1. Kingdom of Saudi Arabia

            21.4.1.2. United Arab Emirates

            21.4.1.3. Türkiye

            21.4.1.4. Northern Africa

            21.4.1.5. South Africa

            21.4.1.6. Israel

            21.4.1.7. Rest of Middle East and Africa

        21.4.2. By Plastic Type

        21.4.3. By End Use

    21.5. Market Attractiveness Analysis

        21.5.1. By Country

        21.5.2. By Plastic Type

        21.5.3. By End Use

    21.6. Drivers and Restraints - Impact Analysis

22. Country-wise Market Analysis

    22.1. United States Market Analysis

        22.1.1. By Plastic Type

        22.1.2. By End Use

    22.2. Canada Market Analysis

        22.2.1. By Plastic Type

        22.2.2. By End Use

    22.3. Mexico Market Analysis

        22.3.1. By Plastic Type

        22.3.2. By End Use

    22.4. Brazil Market Analysis

        22.4.1. By Plastic Type

        22.4.2. By End Use

    22.5. Argentina Market Analysis

        22.5.1. By Plastic Type

        22.5.2. By End Use

    22.6. Germany Market Analysis

        22.6.1. By Plastic Type

        22.6.2. By End Use

    22.7. Italy Market Analysis

        22.7.1. By Plastic Type

        22.7.2. By End Use

    22.8. France Market Analysis

        22.8.1. By Plastic Type

        22.8.2. By End Use

    22.9. United Kingdom Market Analysis

        22.9.1. By Plastic Type

        22.9.2. By End Use

    22.10. Spain Market Analysis

        22.10.1. By Plastic Type

        22.10.2. By End Use

    22.11. NORDICS Market Analysis

        22.11.1. By Plastic Type

        22.11.2. By End Use

    22.12. Poland Market Analysis

        22.12.1. By Plastic Type

        22.12.2. By End Use

    22.13. Hungary Market Analysis

        22.13.1. By Plastic Type

        22.13.2. By End Use

    22.14. Czech Republic Market Analysis

        22.14.1. By Plastic Type

        22.14.2. By End Use

    22.15. China Market Analysis

        22.15.1. By Plastic Type

        22.15.2. By End Use

    22.16. Japan Market Analysis

        22.16.1. By Plastic Type

        22.16.2. By End Use

    22.17. S. Korea Market Analysis

        22.17.1. By Plastic Type

        22.17.2. By End Use

    22.18. India Market Analysis

        22.18.1. By Plastic Type

        22.18.2. By End Use

    22.19. Association of Southeast Asian Nations Market Analysis

        22.19.1. By Plastic Type

        22.19.2. By End Use

    22.20. Australia and New Zealand Market Analysis

        22.20.1. By Plastic Type

        22.20.2. By End Use

    22.21. Kingdom of Saudi Arabia Market Analysis

        22.21.1. By Plastic Type

        22.21.2. By End Use

    22.22. United Arab Emirates Market Analysis

        22.22.1. By Plastic Type

        22.22.2. By End Use

    22.23. Türkiye Market Analysis

        22.23.1. By Plastic Type

        22.23.2. By End Use

    22.24. South Africa Market Analysis

        22.24.1. By Plastic Type

        22.24.2. By End Use

    22.25. Israel Market Analysis

        22.25.1. By Plastic Type

        22.25.2. By End Use

23. Market Structure Analysis

    23.1. Market Positioning Analysis

    23.2. Market Share Analysis of Top Players

    23.3. Market Analysis by Tier of Companies

    23.4. Apparent Production Capacity of Key Players

24. Competition Analysis

    24.1. Competition Dashboard

    24.2. Competition Deep Dive

        24.2.1. Celanese Corporation

            24.2.1.1. Overview

            24.2.1.2. Product Portfolio

            24.2.1.3. Key Developments

            24.2.1.4. Profitability by Market Segments (Product/Channel/Region)

            24.2.1.5. Sales Footprint

            24.2.1.6. Strategy Overview

        24.2.2. Trinseo PLC

            24.2.2.1. Overview

            24.2.2.2. Product Portfolio

            24.2.2.3. Key Developments

            24.2.2.4. Profitability by Market Segments (Product/Channel/Region)

            24.2.2.5. Sales Footprint

            24.2.2.6. Strategy Overview

        24.2.3. Ensinger Group

            24.2.3.1. Overview

            24.2.3.2. Product Portfolio

            24.2.3.3. Key Developments

            24.2.3.4. Profitability by Market Segments (Product/Channel/Region)

            24.2.3.5. Sales Footprint

            24.2.3.6. Strategy Overview

        24.2.4. BASF SE

            24.2.4.1. Overview

            24.2.4.2. Product Portfolio

            24.2.4.3. Key Developments

            24.2.4.4. Profitability by Market Segments (Product/Channel/Region)

            24.2.4.5. Sales Footprint

            24.2.4.6. Strategy Overview

        24.2.5. The Dow Chemical Company

            24.2.5.1. Overview

            24.2.5.2. Product Portfolio

            24.2.5.3. Key Developments

            24.2.5.4. Profitability by Market Segments (Product/Channel/Region)

            24.2.5.5. Sales Footprint

            24.2.5.6. Strategy Overview

        24.2.6. Saudi Basic Industries Corp (SABIC)

            24.2.6.1. Overview

            24.2.6.2. Product Portfolio

            24.2.6.3. Key Developments

            24.2.6.4. Profitability by Market Segments (Product/Channel/Region)

            24.2.6.5. Sales Footprint

            24.2.6.6. Strategy Overview

        24.2.7. DuPont de Nemours, Inc.

            24.2.7.1. Overview

            24.2.7.2. Product Portfolio

            24.2.7.3. Key Developments

            24.2.7.4. Profitability by Market Segments (Product/Channel/Region)

            24.2.7.5. Sales Footprint

            24.2.7.6. Strategy Overview

        24.2.8. Arkema Group

            24.2.8.1. Overview

            24.2.8.2. Product Portfolio

            24.2.8.3. Key Developments

            24.2.8.4. Profitability by Market Segments (Product/Channel/Region)

            24.2.8.5. Sales Footprint

            24.2.8.6. Strategy Overview

        24.2.9. Evonik Industries

            24.2.9.1. Overview

            24.2.9.2. Product Portfolio

            24.2.9.3. Key Developments

            24.2.9.4. Profitability by Market Segments (Product/Channel/Region)

            24.2.9.5. Sales Footprint

            24.2.9.6. Strategy Overview

        24.2.10. Eastman Chemical Company

            24.2.10.1. Overview

            24.2.10.2. Product Portfolio

            24.2.10.3. Key Developments

            24.2.10.4. Profitability by Market Segments (Product/Channel/Region)

            24.2.10.5. Sales Footprint

            24.2.10.6. Strategy Overview

        24.2.11. LyondellBasell Industries N.V.

            24.2.11.1. Overview

            24.2.11.2. Product Portfolio

            24.2.11.3. Key Developments

            24.2.11.4. Profitability by Market Segments (Product/Channel/Region)

            24.2.11.5. Sales Footprint

            24.2.11.6. Strategy Overview

        24.2.12. Hanwha Group

            24.2.12.1. Overview

            24.2.12.2. Product Portfolio

            24.2.12.3. Key Developments

            24.2.12.4. Profitability by Market Segments (Product/Channel/Region)

            24.2.12.5. Sales Footprint

            24.2.12.6. Strategy Overview

        24.2.13. Covestro AG

            24.2.13.1. Overview

            24.2.13.2. Product Portfolio

            24.2.13.3. Key Developments

            24.2.13.4. Profitability by Market Segments (Product/Channel/Region)

            24.2.13.5. Sales Footprint

            24.2.13.6. Strategy Overview

        24.2.14. Solvay SA

            24.2.14.1. Overview

            24.2.14.2. Product Portfolio

            24.2.14.3. Key Developments

            24.2.14.4. Profitability by Market Segments (Product/Channel/Region)

            24.2.14.5. Sales Footprint

            24.2.14.6. Strategy Overview

        24.2.15. EMCO Industrial Plastic Inc.

            24.2.15.1. Overview

            24.2.15.2. Product Portfolio

            24.2.15.3. Key Developments

            24.2.15.4. Profitability by Market Segments (Product/Channel/Region)

            24.2.15.5. Sales Footprint

            24.2.15.6. Strategy Overview

        24.2.16. The Lubrizol Corporation

            24.2.16.1. Overview

            24.2.16.2. Product Portfolio

            24.2.16.3. Key Developments

            24.2.16.4. Profitability by Market Segments (Product/Channel/Region)

            24.2.16.5. Sales Footprint

            24.2.16.6. Strategy Overview

        24.2.17. Trelleborg Group

            24.2.17.1. Overview

            24.2.17.2. Product Portfolio

            24.2.17.3. Key Developments

            24.2.17.4. Profitability by Market Segments (Product/Channel/Region)

            24.2.17.5. Sales Footprint

            24.2.17.6. Strategy Overview

        24.2.18. Teknor Apex

            24.2.18.1. Overview

            24.2.18.2. Product Portfolio

            24.2.18.3. Key Developments

            24.2.18.4. Profitability by Market Segments (Product/Channel/Region)

            24.2.18.5. Sales Footprint

            24.2.18.6. Strategy Overview

        24.2.19. Spartech LLC

            24.2.19.1. Overview

            24.2.19.2. Product Portfolio

            24.2.19.3. Key Developments

            24.2.19.4. Profitability by Market Segments (Product/Channel/Region)

            24.2.19.5. Sales Footprint

            24.2.19.6. Strategy Overview

        24.2.20. Raumedic AG

            24.2.20.1. Overview

            24.2.20.2. Product Portfolio

            24.2.20.3. Key Developments

            24.2.20.4. Profitability by Market Segments (Product/Channel/Region)

            24.2.20.5. Sales Footprint

            24.2.20.6. Strategy Overview

        24.2.21. HMC Polymers Company Limited

            24.2.21.1. Overview

            24.2.21.2. Product Portfolio

            24.2.21.3. Key Developments

            24.2.21.4. Profitability by Market Segments (Product/Channel/Region)

            24.2.21.5. Sales Footprint

            24.2.21.6. Strategy Overview

        24.2.22. Tekni-Plex, Inc.

            24.2.22.1. Overview

            24.2.22.2. Product Portfolio

            24.2.22.3. Key Developments

            24.2.22.4. Profitability by Market Segments (Product/Channel/Region)

            24.2.22.5. Sales Footprint

            24.2.22.6. Strategy Overview

25. Assumptions and Acronyms Used

26. Research Methodology

List of Tables

Table 01A: Global Market Value (US$ Million) and Volume (kilo tons) Historical Data 2018 to 2022 and Forecast 2023 to 2033 By Plastic Type

Table 01B: Global Market Value (US$ Million) and Volume (kilo tons) Historical Data 2018 to 2022 and Forecast 2023 to 2033 By Plastic Type

Table 01C: Global Market Value (US$ Million) and Volume (kilo tons) Historical Data 2018 to 2022 and Forecast 2023 to 2033 By Plastic Type

Table 02A: Global Market Value (US$ Million) and Volume (kilo tons) Historical Data 2018 to 2022 and Forecast 2023 to 2033 By End Use

Table 02B: Global Market Value (US$ Million) and Volume (kilo tons) Historical Data 2018 to 2022 and Forecast 2023 to 2033 By End Use

Table 02C: Global Market Value (US$ Million) and Volume (kilo tons) Historical Data 2018 to 2022 and Forecast 2023 to 2033 By End Use

Table 02D: Global Market Value (US$ Million) and Volume (kilo tons) Historical Data 2018 to 2022 and Forecast 2023 to 2033 By End Use

Table 02E: Global Market Value (US$ Million) and Volume (kilo tons) Historical Data 2018 to 2022 and Forecast 2023 to 2033 By End Use

Table 03A: Global Market Value (US$ Million) and Volume (kilo tons) Historical Data 2018 to 2022 and Forecast 2023 to 2033 By Region

Table 03B: Global Market Value (US$ Million) and Volume (kilo tons) Historical Data 2018 to 2022 and Forecast 2023 to 2033 By Region

Table 04: North America Market Value (US$ Million) and Volume (kilo tons) Historical Data 2018 to 2022 and Forecast 2023 to 2033 By Country

Table 05A: North America Market Value (US$ Million) and Volume (kilo tons) Historical Data 2018 to 2022 and Forecast 2023 to 2033 By Plastic Type

Table 05B: North America Market Value (US$ Million) and Volume (kilo tons) Historical Data 2018 to 2022 and Forecast 2023 to 2033 By Plastic Type

Table 05C: North America Market Value (US$ Million) and Volume (kilo tons) Historical Data 2018 to 2022 and Forecast 2023 to 2033 By Plastic Type

Table 06A: North America Market Value (US$ Million) and Volume (kilo tons) Historical Data 2018 to 2022 and Forecast 2023 to 2033 By End Use

Table 06B: North America Market Value (US$ Million) and Volume (kilo tons) Historical Data 2018 to 2022 and Forecast 2023 to 2033 By End Use

Table 06C: North America Market Value (US$ Million) and Volume (kilo tons) Historical Data 2018 to 2022 and Forecast 2023 to 2033 By End Use

Table 06D: North America Market Value (US$ Million) and Volume (kilo tons) Historical Data 2018 to 2022 and Forecast 2023 to 2033 By End Use

Table 06E: North America Market Value (US$ Million) and Volume (kilo tons) Historical Data 2018 to 2022 and Forecast 2023 to 2033 By End Use

Table 07: Latin America Market Value (US$ Million) and Volume (kilo tons) Historical Data 2018 to 2022 and Forecast 2023 to 2033 By Country

Table 08A: Latin America Market Value (US$ Million) and Volume (kilo tons) Historical Data 2018 to 2022 and Forecast 2023 to 2033 By Plastic Type

Table 08B: Latin America Market Value (US$ Million) and Volume (kilo tons) Historical Data 2018 to 2022 and Forecast 2023 to 2033 By Plastic Type

Table 08C: Latin America Market Value (US$ Million) and Volume (kilo tons) Historical Data 2018 to 2022 and Forecast 2023 to 2033 By Plastic Type

Table 09A: Latin America Market Value (US$ Million) and Volume (kilo tons) Historical Data 2018 to 2022 and Forecast 2023 to 2033 By End Use

Table 09B: Latin America Market Value (US$ Million) and Volume (kilo tons) Historical Data 2018 to 2022 and Forecast 2023 to 2033 By End Use

Table 09C: Latin America Market Value (US$ Million) and Volume (kilo tons) Historical Data 2018 to 2022 and Forecast 2023 to 2033 By End Use

Table 09D: Latin America Market Value (US$ Million) and Volume (kilo tons) Historical Data 2018 to 2022 and Forecast 2023 to 2033 By End Use

Table 09E: Latin America Market Value (US$ Million) and Volume (kilo tons) Historical Data 2018 to 2022 and Forecast 2023 to 2033 By End Use

Table 10: Western Europe Market Value (US$ Million) and Volume (kilo tons) Historical Data 2018 to 2022 and Forecast 2023 to 2033 By Country

Table 11A: Western Europe Market Value (US$ Million) and Volume (kilo tons) Historical Data 2018 to 2022 and Forecast 2023 to 2033 By Plastic Type

Table 11B: Western Europe Market Value (US$ Million) and Volume (kilo tons) Historical Data 2018 to 2022 and Forecast 2023 to 2033 By Plastic Type

Table 11C: Western Europe Market Value (US$ Million) and Volume (kilo tons) Historical Data 2018 to 2022 and Forecast 2023 to 2033 By Plastic Type

Table 12A: Western Europe Market Value (US$ Million) and Volume (kilo tons) Historical Data 2018 to 2022 and Forecast 2023 to 2033 By End Use

Table 12B: Western Europe Market Value (US$ Million) and Volume (kilo tons) Historical Data 2018 to 2022 and Forecast 2023 to 2033 By End Use

Table 12C: Western Europe Market Value (US$ Million) and Volume (kilo tons) Historical Data 2018 to 2022 and Forecast 2023 to 2033 By End Use

Table 12D: Western Europe Market Value (US$ Million) and Volume (kilo tons) Historical Data 2018 to 2022 and Forecast 2023 to 2033 By End Use

Table 12E: Western Europe Market Value (US$ Million) and Volume (kilo tons) Historical Data 2018 to 2022 and Forecast 2023 to 2033 By End Use

Table 13: Eastern Europe Market Value (US$ Million) and Volume (kilo tons) Historical Data 2018 to 2022 and Forecast 2023 to 2033 By Country

Table 14A: Eastern Europe Market Value (US$ Million) and Volume (kilo tons) Historical Data 2018 to 2022 and Forecast 2023 to 2033 By Plastic Type

Table 14B: Eastern Europe Market Value (US$ Million) and Volume (kilo tons) Historical Data 2018 to 2022 and Forecast 2023 to 2033 By Plastic Type

Table 14C: Eastern Europe Market Value (US$ Million) and Volume (kilo tons) Historical Data 2018 to 2022 and Forecast 2023 to 2033 By Plastic Type

Table 15A: Eastern Europe Market Value (US$ Million) and Volume (kilo tons) Historical Data 2018 to 2022 and Forecast 2023 to 2033 By End Use

Table 15B: Eastern Europe Market Value (US$ Million) and Volume (kilo tons) Historical Data 2018 to 2022 and Forecast 2023 to 2033 By End Use

Table 15C: Eastern Europe Market Value (US$ Million) and Volume (kilo tons) Historical Data 2018 to 2022 and Forecast 2023 to 2033 By End Use

Table 15D: Eastern Europe Market Value (US$ Million) and Volume (kilo tons) Historical Data 2018 to 2022 and Forecast 2023 to 2033 By End Use

Table 15E: Eastern Europe Market Value (US$ Million) and Volume (kilo tons) Historical Data 2018 to 2022 and Forecast 2023 to 2033 By End Use

Table 16A: Russia & Belarus Market Value (US$ Million) and Volume (kilo tons) Historical Data 2018 to 2022 and Forecast 2023 to 2033 By Plastic Type

Table 16B: Russia & Belarus Market Value (US$ Million) and Volume (kilo tons) Historical Data 2018 to 2022 and Forecast 2023 to 2033 By Plastic Type

Table 16C: Russia & Belarus Market Value (US$ Million) and Volume (kilo tons) Historical Data 2018 to 2022 and Forecast 2023 to 2033 By Plastic Type

Table 17A: Russia & Belarus Market Value (US$ Million) and Volume (kilo tons) Historical Data 2018 to 2022 and Forecast 2023 to 2033 By End Use

Table 17B: Russia & Belarus Market Value (US$ Million) and Volume (kilo tons) Historical Data 2018 to 2022 and Forecast 2023 to 2033 By End Use

Table 17C: Russia & Belarus Market Value (US$ Million) and Volume (kilo tons) Historical Data 2018 to 2022 and Forecast 2023 to 2033 By End Use

Table 17D: Russia & Belarus Market Value (US$ Million) and Volume (kilo tons) Historical Data 2018 to 2022 and Forecast 2023 to 2033 By End Use

Table 17E: Russia & Belarus Market Value (US$ Million) and Volume (kilo tons) Historical Data 2018 to 2022 and Forecast 2023 to 2033 By End Use

Table 18A: Balkan & Baltic Countries Market Value (US$ Million) and Volume (kilo tons) Historical Data 2018 to 2022 and Forecast 2023 to 2033 By Plastic Type

Table 18B: Balkan & Baltic Countries Market Value (US$ Million) and Volume (kilo tons) Historical Data 2018 to 2022 and Forecast 2023 to 2033 By Plastic Type

Table 18C: Balkan & Baltic Countries Market Value (US$ Million) and Volume (kilo tons) Historical Data 2018 to 2022 and Forecast 2023 to 2033 By Plastic Type

Table 19A: Balkan & Baltic Countries Market Value (US$ Million) and Volume (kilo tons) Historical Data 2018 to 2022 and Forecast 2023 to 2033 By End Use

Table 19B: Balkan & Baltic Countries Market Value (US$ Million) and Volume (kilo tons) Historical Data 2018 to 2022 and Forecast 2023 to 2033 By End Use

Table 19C: Balkan & Baltic Countries Market Value (US$ Million) and Volume (kilo tons) Historical Data 2018 to 2022 and Forecast 2023 to 2033 By End Use

Table 19D: Balkan & Baltic Countries Market Value (US$ Million) and Volume (kilo tons) Historical Data 2018 to 2022 and Forecast 2023 to 2033 By End Use

Table 19E: Balkan & Baltic Countries Market Value (US$ Million) and Volume (kilo tons) Historical Data 2018 to 2022 and Forecast 2023 to 2033 By End Use

Table 20A: Central Asia Market Value (US$ Million) and Volume (kilo tons) Historical Data 2018 to 2022 and Forecast 2023 to 2033 By Plastic Type

Table 20B: Central Asia Market Value (US$ Million) and Volume (kilo tons) Historical Data 2018 to 2022 and Forecast 2023 to 2033 By Plastic Type

Table 20C: Central Asia Market Value (US$ Million) and Volume (kilo tons) Historical Data 2018 to 2022 and Forecast 2023 to 2033 By Plastic Type

Table 21A: Central Asia Market Value (US$ Million) and Volume (kilo tons) Historical Data 2018 to 2022 and Forecast 2023 to 2033 By End Use

Table 21B: Central Asia Market Value (US$ Million) and Volume (kilo tons) Historical Data 2018 to 2022 and Forecast 2023 to 2033 By End Use

Table 21C: Central Asia Market Value (US$ Million) and Volume (kilo tons) Historical Data 2018 to 2022 and Forecast 2023 to 2033 By End Use

Table 21D: Central Asia Market Value (US$ Million) and Volume (kilo tons) Historical Data 2018 to 2022 and Forecast 2023 to 2033 By End Use

Table 21E: Central Asia Market Value (US$ Million) and Volume (kilo tons) Historical Data 2018 to 2022 and Forecast 2023 to 2033 By End Use

Table 22: East Asia Market Value (US$ Million) and Volume (kilo tons) Historical Data 2018 to 2022 and Forecast 2023 to 2033 By Country

Table 23A: East Asia Market Value (US$ Million) and Volume (kilo tons) Historical Data 2018 to 2022 and Forecast 2023 to 2033 By Plastic Type

Table 23B: East Asia Market Value (US$ Million) and Volume (kilo tons) Historical Data 2018 to 2022 and Forecast 2023 to 2033 By Plastic Type

Table 23C: East Asia Market Value (US$ Million) and Volume (kilo tons) Historical Data 2018 to 2022 and Forecast 2023 to 2033 By Plastic Type

Table 24A: East Asia Market Value (US$ Million) and Volume (kilo tons) Historical Data 2018 to 2022 and Forecast 2023 to 2033 By End Use

Table 24B: East Asia Market Value (US$ Million) and Volume (kilo tons) Historical Data 2018 to 2022 and Forecast 2023 to 2033 By End Use

Table 24C: East Asia Market Value (US$ Million) and Volume (kilo tons) Historical Data 2018 to 2022 and Forecast 2023 to 2033 By End Use

Table 24D: East Asia Market Value (US$ Million) and Volume (kilo tons) Historical Data 2018 to 2022 and Forecast 2023 to 2033 By End Use

Table 24E: East Asia Market Value (US$ Million) and Volume (kilo tons) Historical Data 2018 to 2022 and Forecast 2023 to 2033 By End Use

Table 25: South Asia and Pacific Market Value (US$ Million) and Volume (kilo tons) Historical Data 2018 to 2022 and Forecast 2023 to 2033 By Country

Table 26A: South Asia & Pacific Market Value (US$ Million) and Volume (kilo tons) Historical Data 2018 to 2022 and Forecast 2023 to 2033 By Plastic Type

Table 26B: South Asia & Pacific Market Value (US$ Million) and Volume (kilo tons) Historical Data 2018 to 2022 and Forecast 2023 to 2033 By Plastic Type

Table 26C: South Asia & Pacific Market Value (US$ Million) and Volume (kilo tons) Historical Data 2018 to 2022 and Forecast 2023 to 2033 By Plastic Type

Table 27A: South Asia & Pacific Market Value (US$ Million) and Volume (kilo tons) Historical Data 2018 to 2022 and Forecast 2023 to 2033 By End Use

Table 27B: South Asia & Pacific Market Value (US$ Million) and Volume (kilo tons) Historical Data 2018 to 2022 and Forecast 2023 to 2033 By End Use

Table 27C: South Asia & Pacific Market Value (US$ Million) and Volume (kilo tons) Historical Data 2018 to 2022 and Forecast 2023 to 2033 By End Use

Table 27D: South Asia & Pacific Market Value (US$ Million) and Volume (kilo tons) Historical Data 2018 to 2022 and Forecast 2023 to 2033 By End Use

Table 27E: South Asia & Pacific Market Value (US$ Million) and Volume (kilo tons) Historical Data 2018 to 2022 and Forecast 2023 to 2033 By End Use

Table 28: Middle East & Africa Market Value (US$ Million) and Volume (kilo tons) Historical Data 2018 to 2022 and Forecast 2023 to 2033 By Country

Table 29A: Middle East & Africa Market Value (US$ Million) and Volume (kilo tons) Historical Data 2018 to 2022 and Forecast 2023 to 2033 By Plastic Type

Table 29B: Middle East & Africa Market Value (US$ Million) and Volume (kilo tons) Historical Data 2018 to 2022 and Forecast 2023 to 2033 By Plastic Type

Table 29C: Middle East & Africa Market Value (US$ Million) and Volume (kilo tons) Historical Data 2018 to 2022 and Forecast 2023 to 2033 By Plastic Type

Table 30A: Middle East & Africa Market Value (US$ Million) and Volume (kilo tons) Historical Data 2018 to 2022 and Forecast 2023 to 2033 By End Use

Table 30B: Middle East & Africa Market Value (US$ Million) and Volume (kilo tons) Historical Data 2018 to 2022 and Forecast 2023 to 2033 By End Use

Table 30C: Middle East & Africa Market Value (US$ Million) and Volume (kilo tons) Historical Data 2018 to 2022 and Forecast 2023 to 2033 By End Use

Table 30D: Middle East & Africa Market Value (US$ Million) and Volume (kilo tons) Historical Data 2018 to 2022 and Forecast 2023 to 2033 By End Use

Table 30E: Middle East & Africa Market Value (US$ Million) and Volume (kilo tons) Historical Data 2018 to 2022 and Forecast 2023 to 2033 By End Use

List of Charts

Figure 01: Global Market Volume (kilo tons), 2018 to 2022

Figure 02: Global Market Volume (kilo tons), 2023 to 2033

Figure 03: Global Market Value (US$ Million), 2018 to 2022

Figure 04: Global Market Value (US$ Million) Forecast & Y-o-Y Growth, 2023 to 2033

Figure 05: Global Value, Absolute $ Opportunity Analysis

Figure 06: Global Market Share and BPS Analysis By Plastic Type, 2023 & 2033

Figure 07: Global Market Y-o-Y Growth Projections By Plastic Type, 2023 to 2033

Figure 08: Global Market Attractiveness Analysis By Plastic Type, 2023 to 2033

Figure 09: Global Market Absolute $ Opportunity by Polyvinyl Chloride (PVC) Segment, 2023 to 2033

Figure 10: Global Market Absolute $ Opportunity by Thermoplastic Elastomer (TPE) Segment, 2023 to 2033

Figure 11: Global Market Absolute $ Opportunity by Polyethylene (PE) Segment, 2023 to 2033

Figure 12: Global Market Absolute $ Opportunity by Polycarbonate (PC) Segment, 2023 to 2033

Figure 13: Global Market Absolute $ Opportunity by Polypropylene (PP) Segment, 2023 to 2033

Figure 14: Global Market Absolute $ Opportunity by Polyethylene Terephthalate (PET) Segment, 2023 to 2033

Figure 15: Global Market Absolute $ Opportunity by Polyamides Segment, 2023 to 2033

Figure 16: Global Market Absolute $ Opportunity by Thermoplastic Polyurethane (TPU) Segment, 2023 to 2033

Figure 17: Global Market Absolute $ Opportunity by Polymethyl Methacrylate Segment, 2023 to 2033

Figure 18: Global Market Absolute $ Opportunity by Acrylonitrile Butadiene Styrene (ABS) Segment, 2023 to 2033

Figure 19: Global Market Absolute $ Opportunity by Silicone Segment, 2023 to 2033

Figure 20: Global Market Absolute $ Opportunity by Others Segment, 2023 to 2033

Figure 21: Global Market Share and BPS Analysis By End Use, 2023 & 2033

Figure 22: Global Market Y-o-Y Growth Projections By End Use, 2023 to 2033

Figure 23: Global Market Attractiveness Analysis By End Use, 2023 to 2033

Figure 24: Global Market Absolute $ Opportunity by Medical Parts & Components Segment, 2023 to 2033

Figure 25: Global Market Absolute $ Opportunity by Tubing Segment, 2023 to 2033

Figure 26: Global Market Absolute $ Opportunity by Film and Bags Segment, 2023 to 2033

Figure 27: Global Market Absolute $ Opportunity by Surgical Tools Segment, 2023 to 2033

Figure 28: Global Market Absolute $ Opportunity by Medical Cables and Connectors Segment, 2023 to 2033

Figure 29: Global Market Absolute $ Opportunity by Diagnostic Equipment Segment, 2023 to 2033

Figure 30: Global Market Absolute $ Opportunity by Prosthetics Segment, 2023 to 2033

Figure 31: Global Market Absolute $ Opportunity by Others Segment, 2023 to 2033

Figure 32: Global Market Share and BPS Analysis By Region, 2023 & 2033

Figure 33: Global Market Y-o-Y Growth Projections By Region, 2023 to 2033

Figure 34: Global Market Attractiveness Analysis By Region, 2023 to 2033

Figure 35: Global Market Absolute $ Opportunity by North America Segment

Figure 36: Global Market Absolute $ Opportunity by Latin America Segment

Figure 37: Global Market Absolute $ Opportunity by Western Europe Segment

Figure 38: Global Market Absolute $ Opportunity by Eastern Europe Segment

Figure 39: Global Market Absolute $ Opportunity by East Asia Segment

Figure 40: Global Market Absolute $ Opportunity by South Asia & Pacific Segment

Figure 41: Global Market Absolute $ Opportunity by Central Asia Segment

Figure 42: Global Market Absolute $ Opportunity by Russia & Belarus Segment

Figure 43: Global Market Absolute $ Opportunity by Balkan & Baltic Countries Segment

Figure 44: Global Market Absolute $ Opportunity by Middle East & Africa Segment

Figure 45: North America Market Share and BPS Analysis By Country– 2023 & 2023

Figure 46: North America Market Y-o-Y Growth Projection By Country, 2023 to 2033

Figure 47: North America Market Attractiveness Index By Country, 2023 to 2033

Figure 48: North America Market Share and BPS Analysis By Plastic Type, 2023 & 2033

Figure 49: North America Market Y-o-Y Growth Projections By Plastic Type, 2023 to 2033

Figure 50: North America Market Attractiveness Analysis By Plastic Type, 2023 to 2033

Figure 51: North America Market Share and BPS Analysis By End Use, 2023 & 2033

Figure 52: North America Market Y-o-Y Growth Projections By End Use, 2023 to 2033

Figure 53: North America Market Attractiveness Analysis By End Use, 2023 to 2033

Figure 54: Latin America Market Share and BPS Analysis By Country– 2023 & 2023

Figure 55: Latin America Market Y-o-Y Growth Projection By Country, 2023 to 2033

Figure 56: Latin America Market Attractiveness Index By Country, 2023 to 2033

Figure 57: Latin America Market Share and BPS Analysis By Plastic Type, 2023 & 2033

Figure 58: Latin America Market Y-o-Y Growth Projections By Plastic Type, 2023 to 2033

Figure 59: Latin America Market Attractiveness Analysis By Plastic Type, 2023 to 2033

Figure 60: Latin America Market Share and BPS Analysis By End Use, 2023 & 2033

Figure 61: Latin America Market Y-o-Y Growth Projections By End Use, 2023 to 2033

Figure 62: Latin America Market Attractiveness Analysis By End Use, 2023 to 2033

Figure 63: Western Europe Market Share and BPS Analysis By Country– 2023 & 2023

Figure 64: Western Europe Market Y-o-Y Growth Projection By Country, 2023 to 2033

Figure 65: Western Europe Market Attractiveness Index By Country, 2023 to 2033

Figure 66: Western Europe Market Share and BPS Analysis By Plastic Type, 2023 & 2033

Figure 67: Western Europe Market Y-o-Y Growth Projections By Plastic Type, 2023 to 2033

Figure 68: Western Europe Market Attractiveness Analysis By Plastic Type, 2023 to 2033

Figure 69: Western Europe Market Share and BPS Analysis By End Use, 2023 & 2033

Figure 70: Western Europe Market Y-o-Y Growth Projections By End Use, 2023 to 2033

Figure 71: Western Europe Market Attractiveness Analysis By End Use, 2023 to 2033

Figure 72: Eastern Europe Market Share and BPS Analysis By Country– 2023 & 2023

Figure 73: Eastern Europe Market Y-o-Y Growth Projection By Country, 2023 to 2033

Figure 74: Eastern Europe Market Attractiveness Index By Country, 2023 to 2033

Figure 75: Eastern Europe Market Share and BPS Analysis By Plastic Type, 2023 & 2033

Figure 76: Eastern Europe Market Y-o-Y Growth Projections By Plastic Type, 2023 to 2033

Figure 77: Eastern Europe Market Attractiveness Analysis By Plastic Type, 2023 to 2033

Figure 78: Eastern Europe Market Share and BPS Analysis By End Use, 2023 & 2033

Figure 79: Eastern Europe Market Y-o-Y Growth Projections By End Use, 2023 to 2033

Figure 80: Eastern Europe Market Attractiveness Analysis By End Use, 2023 to 2033

Figure 81: Russia & Belarus Market Share and BPS Analysis By Plastic Type, 2023 & 2033

Figure 82: Russia & Belarus Market Y-o-Y Growth Projections By Plastic Type, 2023 to 2033

Figure 83: Russia & Belarus Market Attractiveness Analysis By Plastic Type, 2023 to 2033

Figure 84: Russia & Belarus Market Share and BPS Analysis By End Use, 2023 & 2033

Figure 85: Russia & Belarus Market Y-o-Y Growth Projections By End Use, 2023 to 2033

Figure 86: Russia & Belarus Market Attractiveness Analysis By End Use, 2023 to 2033

Figure 87: Balkan & Baltic Countries Market Share and BPS Analysis By Plastic Type, 2023 & 2033

Figure 88: Balkan & Baltic Countries Market Y-o-Y Growth Projections By Plastic Type, 2023 to 2033

Figure 89: Balkan & Baltic Countries Market Attractiveness Analysis By Plastic Type, 2023 to 2033

Figure 90: Balkan & Baltic Countries Market Share and BPS Analysis By End Use, 2023 & 2033

Figure 91: Balkan & Baltic Countries Market Y-o-Y Growth Projections By End Use, 2023 to 2033

Figure 92: Balkan & Baltic Countries Market Attractiveness Analysis By End Use, 2023 to 2033

Figure 93: Central Asia Market Share and BPS Analysis By Plastic Type, 2023 & 2033

Figure 94: Central Asia Market Y-o-Y Growth Projections By Plastic Type, 2023 to 2033

Figure 95: Central Asia Market Attractiveness Analysis By Plastic Type, 2023 to 2033

Figure 96: Central Asia Market Share and BPS Analysis By End Use, 2023 & 2033

Figure 97: Central Asia Market Y-o-Y Growth Projections By End Use, 2023 to 2033

Figure 98: Central Asia Market Attractiveness Analysis By End Use, 2023 to 2033

Figure 99: East Asia Market Share and BPS Analysis By Country– 2023 & 2023

Figure 100: East Asia Market Y-o-Y Growth Projection By Country, 2023 to 2033

Figure 101: East Asia Market Attractiveness Index By Country, 2023 to 2033

Figure 102: East Asia Market Share and BPS Analysis By Plastic Type, 2023 & 2033

Figure 103: East Asia Market Y-o-Y Growth Projections By Plastic Type, 2023 to 2033

Figure 104: East Asia Market Attractiveness Analysis By Plastic Type, 2023 to 2033

Figure 105: East Asia Market Share and BPS Analysis By End Use, 2023 & 2033

Figure 106: East Asia Market Y-o-Y Growth Projections By End Use, 2023 to 2033

Figure 107: East Asia Market Attractiveness Analysis By End Use, 2023 to 2033

Figure 108: South Asia and Pacific Market Share and BPS Analysis By Country– 2023 & 2023

Figure 109: South Asia and Pacific Market Y-o-Y Growth Projection By Country, 2023 to 2033

Figure 110: South Asia and Pacific Market Attractiveness Index by Country, 2023 to 2033

Figure 111: South Asia & Pacific Market Share and BPS Analysis By Plastic Type, 2023 & 2033

Figure 112: South Asia & Pacific Market Y-o-Y Growth Projections By Plastic Type, 2023 to 2033

Figure 113: South Asia & Pacific Market Attractiveness Analysis By Plastic Type, 2023 to 2033

Figure 114: South Asia & Pacific Market Share and BPS Analysis By End Use, 2023 & 2033

Figure 115: South Asia & Pacific Market Y-o-Y Growth Projections By End Use, 2023 to 2033

Figure 116: South Asia & Pacific Market Attractiveness Analysis By End Use, 2023 to 2033

Figure 117: Middle East & Africa Market Share and BPS Analysis By Country– 2023 & 2023

Figure 118: Middle East & Africa Market Y-o-Y Growth Projection By Country, 2023 to 2033

Figure 119: Middle East & Africa Market Attractiveness Index By Country, 2023 to 2033

Figure 120: Middle East & Africa Market Share and BPS Analysis By Plastic Type, 2023 & 2033

Figure 121: Middle East & Africa Market Y-o-Y Growth Projections By Plastic Type, 2023 to 2033

Figure 122: Middle East & Africa Market Attractiveness Analysis By Plastic Type, 2023 to 2033

Figure 123: Middle East & Africa Market Share and BPS Analysis By End Use, 2023 & 2033

Figure 124: Middle East & Africa Market Y-o-Y Growth Projections By End Use, 2023 to 2033

Figure 125: Middle East & Africa Market Attractiveness Analysis By End Use, 2023 to 2033

Recommendations

Chemicals & Materials

Plastic Compounding Market

Published : July 2023

Chemicals & Materials

Biophotonics Market

Published : March 2023

Chemicals & Materials

Breathable Membrane Market

Published : January 2023

Chemicals & Materials

Medical Membrane Market

Published : December 2022

Explore Chemicals & Materials Insights

View Reports