Medical Tubing Market Outlook (2023 to 2033)

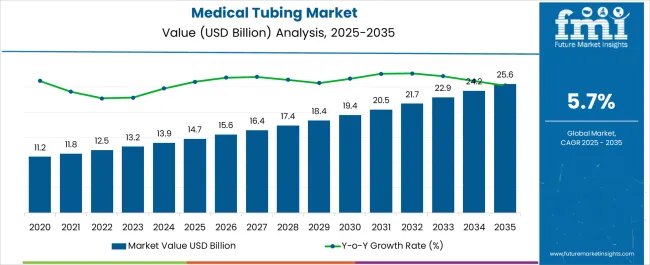
The global medical tubing market size is expected to reach a valuation of US$ 13.1 billion in 2023. It is projected to cross a valuation of about US$ 23.5 billion by 2033. A CAGR of 6.0% is estimated for the global market in the assessment period 2023 to 2033.

As per Future Market Insights (FMI), the medical tubing industry is anticipated to create an absolute dollar opportunity worth US$ 10.4 billion in the forecast period. The market stood at a valuation of US$ 12.2 billion in 2022.

A number of important variables that combined to create the current healthcare business environment have increased medical tubing demand. These include constant global health concerns, demographic shifts, changes in healthcare practices, rising public awareness of infection management, and technological improvements.

Usage of more specialized medical tubing has become necessary due to the quick technological improvements in medical treatments and diagnostic methods. Medical tubing is a crucial component in performing several operations.

They range from minimally invasive surgeries to complex imaging techniques. There is hence a greater need for customized tubing solutions worldwide. This is due to the need for greater precision, mobility, and interoperability with cutting-edge medical equipment.

Need for medical tubing has also been influenced by shifting demographics, including an elderly population in several regions of the world. Elderly people frequently need ongoing medical care, medication delivery, and a range of treatment interventions.

All of these need the extensive use of medical tubing. Medical tubing that aids aged care is likely to be in greater demand as the world's population ages.

Emphasis has changed to the comfort and recuperation of patients as a result of changing healthcare methods. Due to this, innovative medical equipment has been created that require carefully thought-out tubing to assure smooth transport of fluids, gases, and drugs.

Need for medical tubing is further rising with demand for enhanced comfort, decreased risk of problems, and simplicity of usage. Today, both medical personnel and patients are looking for patient-centric care, which might aid demand.

Medical tubing is in greater demand as a result of increased focus on infection prevention and control. Healthcare-associated infections are still a key concern.

It might help in necessitating the development of materials and layouts that are more contaminant- and sterilization-resistant. Need for infection-resistant tubing is especially important in places such as operating rooms, intensive care units, and other high-risk medical settings.

The COVID-19 pandemic and other recent global health issues have highlighted the significance of having a strong and flexible healthcare infrastructure. The pandemic made clear the necessity for quick and effective medical supply distribution.

This included tubing for a wide range of medical uses. This incident might have raised people's awareness of how crucial it is to keep a consistent supply of vital medical supplies. It has further helped in propelling demand for medical tubing worldwide.

Attributes Key Insights
Medical Tubing Market Estimated Size (2023E) US$ 13.1 billion
Projected Market Valuation (2033F) US$ 23.5 billion
Value-based CAGR (2023 to 2033) 6.0%
United States Value-based CAGR (2023 to 2033) 6.0%

Don't pay for what you don't need

Customize your report by selecting specific countries or regions and save 30%!

2018 to 2022 Medical Tubing Market Outlook Compared to Demand Forecast from 2023 to 2033

The global medical tubing market is likely to witness a CAGR of 6.0% in the assessment period. It recorded a CAGR of 7.7% in the historical period between 2018 and 2022.

Growing number of health-related applications that call for tubing solutions is a key motivator in the market. New treatments and procedures are being created as medical research progresses.

They mainly depend on the correct administration of gases, fluids, and drugs. These essential compounds are transported using medical tubing. They might help medical practitioners provide treatments more precisely and effectively.

Surging popularity of medical tubing can be attributed to the movement toward remote monitoring and home healthcare. Necessity for prolonged hospital stays has decreased as a result of technological improvements that allow patients to get health monitoring at home.

In March 2021, for instance, Medicover Hospitals inaugurated home healthcare services in India. It is a Sweden-based chain of hospitals. It aims to provide healthcare and accessibility to nurses & physicians at home for patients who are unable to physically visit the hospital.

Since patients can now maintain an improved standard of life while continuing to receive critical care, there is a greater demand for transportable medical supplies. These might help combine tubing for giving medications, infusion, and other medicinal purposes.

Its rising appeal is also fueled by the integration of tissue engineering and regenerative medicine interface with medical tubing. Medical tubing is set to be crucial in establishing controlled settings for cell cultures and allowing the flow of nutrients & growth hormones.

Researchers and physicians are investigating novel techniques to cultivating and transplanting tissues. Demand for customized tubing solutions made for these applications might rise as these innovative medical treatments gain popularity.

Medical Tubing Market Trends, Hindrances, and Opportunities

Attributes Factors
Latest Trends
  • Increasing integration of digital technologies into medical tubing for real-time monitoring, data collection, and patient care enhancement.
  • Growing trend toward using bioabsorbable materials for medical tubing in minimally invasive procedures and implantable devices.
Key Hindrances
  • Stringent regulatory requirements and standards that manufacturers must adhere to can pose challenges and delays in bringing new medical tubing products to market.
  • Limited availability of materials that simultaneously meet biocompatibility, durability, and cost-effectiveness criteria can restrain product development.
Upcoming Opportunities
  • Aging population worldwide presents an opportunity for medical tubing manufacturers to develop solutions that cater to specific needs of elderly patients.
  • Growing adoption of telemedicine might open doors for innovative medical tubing designs that facilitate remote patient monitoring and diagnostics.
Sabyasachi Ghosh
Sabyasachi Ghosh

Principal Consultant

Talk to Analyst

Find your sweet spots for generating winning opportunities in this market.

Country-wise Insights

Establishment of Medical Training Facilities in South Korea to Push Demand for PVC Medical Tubing

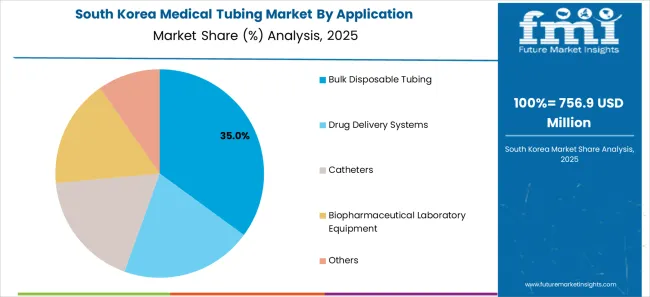
South Korea medical tubing market is projected to witness a CAGR of around 5.6% in the review period 2023 to 2033. It is likely to create an absolute dollar opportunity of US$ 518.6 million in the same period.

Patients travel from every part of the world to South Korea in search of excellent medical treatment, turning the country into a center for medical tourism. Consequently, medical tubing is expected to gain traction across a wide range of businesses, including cosmetic surgery and advanced medical procedures.

South Korea-based health care providers need a consistent supply of premium medical tubing for a variety of operations. This would help them to serve international patients and keep its reputation as a destination for healthcare.

South Korea's aging population and rising chronic diseases are similar to those of several wealthy countries. Patients with chronic illnesses and elderly patients frequently need permanent treatment and medical services.

It might necessitate the application of medical tubing. Need for tubing equipment for observing patients, medication distribution, and other interventions has hence significantly increased.

In May 2023, a Memorandum of Understanding (MoU) was signed by the World Health Organization (WHO) and the Republic of Korea. This would help them to establish a worldwide biomanufacturing training hub.

The international training facility will assist all middle- and low-income countries in producing biological products. These include immunizations glucose, antibodies that are monoclonal, and cancer treatments.
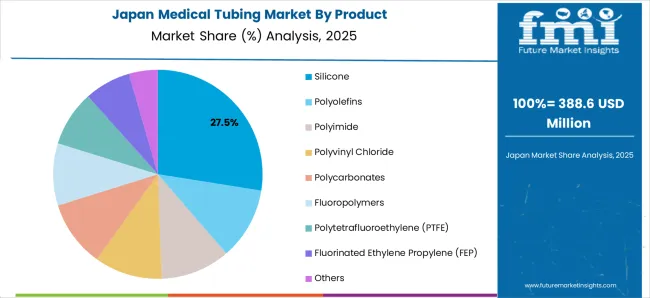
Promotional Programs for Telemedicine in Japan to Fuel Sales of Medical Device Tubing Systems

Japan medical tubing market is expected to rise at a CAGR of 5.9% in the evaluation period. It is estimated to exceed a valuation of about US$ 4.6 billion by 2033.

Due to Japan's vulnerability to earthquakes and tsunamis, healthcare providers are emphasizing the importance of durable and portable medical equipment. Demand is also increasing as medical tubing becomes more recognized as a crucial element of disaster preparedness that can be easily and consistently set up in emergency scenarios.

In order to address issues with an aging population and rising healthcare expenses, the government has been putting money into medical facilities and adopting healthcare reforms. Promotional programs for telemedicine and home healthcare are part of these improvements. These changes might increase the demand for medical tubing systems that can be adapted to patient-centric care models and remote monitoring.

In February 2021, Japan took additional steps to loosen limits on the use of telemedicine, which is likely to enhance the country's healthcare system. Following COVID-19, a number of protective measures were announced.

They included a loosening of limits on online medical treatment and ability for doctors to conduct initial assessments or consultations with patients over the phone or online. Range of ailments that can be addressed virtually, as well as services covered by the national healthcare system were both expanded.

Considering that Japan is known for creating high-quality medical gadgets, the export sector for these products is booming. Increased manufacturing is required to meet both domestic and international demand.

It might be a result of medical tubing producers selling their goods to several international markets. The country's growing interest in the production of medical tubing is a result of this dual demand dynamic.

Category-wise Insights

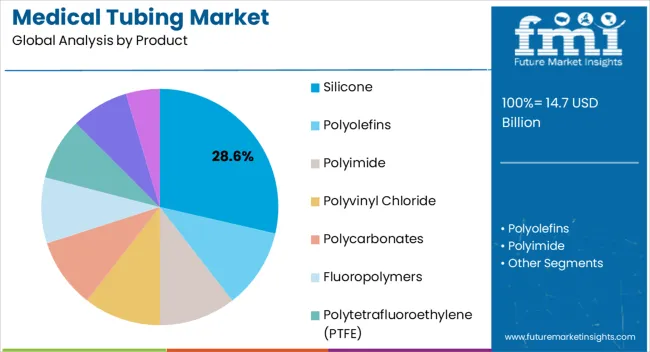
Silicone Medical Tubing to Witness High Demand Backed by its Biocompatibility

In terms of product, the silicone segment is anticipated to witness a CAGR of 5.8% in the forecast period. It recorded a CAGR of around 7.6% in the historical period from 2018 to 2022.

Outstanding biocompatibility of silicone medical tubing is one of the main factors propelling its popularity. Silicone is considered excellent for several medical applications.

They include implanted devices, catheters, and other devices that come into touch with biological fluids or tissues. It is well-tolerated by the human body and does not cause unpleasant responses.

In medical applications, silicone tubing delivers a vital mix of flexibility and toughness. It is simple to work with and might be bent without kinking.

It further helps in enabling precise positioning and simple movement during procedures. Due to its robustness, it can be used repeatedly, sterilized, and exposed to different medical compounds without degrading.

Since silicone tubing is frequently transparent, fluids flowing through the tube can be seen clearly. This openness is especially crucial while performing medical operations and interventions as good outcomes and patient safety depend on correct fluid monitoring and observation.

Integrity and effectiveness of silicone medical tubing are maintained across a broad temperature range owing to its superior temperature resistance. Additionally, it is resistant to a number of common chemicals and disinfectants used in healthcare facilities. Its usefulness for applications involving a range of medical chemicals and sterilizing techniques might be facilitated by this resistance.

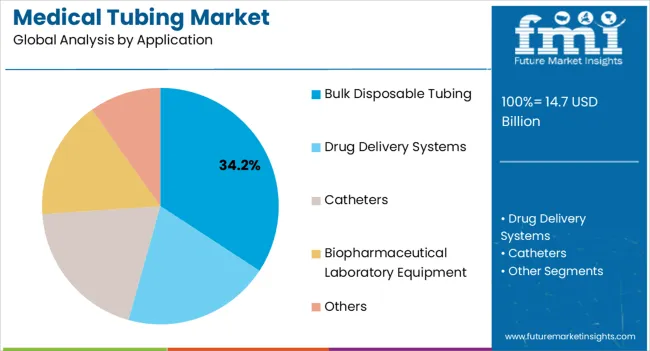
Bulk Disposable Tubing Extrusion to Showcase Immense Popularity through 2033

Based on application, the bulk disposable tubing segment is anticipated to register a CAGR of around 5.7% in the assessment period. It expanded at a CAGR of 7.5% in the historical period.

On a broader scale, bulk disposable tubing offers cost benefits. Bulk tube purchases frequently have lower per-unit costs.

They are hence set to be an affordable option for companies and organizations that need a steady supply. This cost-effectiveness is especially advantageous for businesses that use a lot of tubing such as hospitals, research labs, and manufacturing operations.

Logistics in the supply chain are made simpler by purchasing disposable tubing in bulk. By maintaining a consistent and reliable inventory, businesses might reduce the need for frequent reordering and the risk of operational disruptions. This supply chain management effectiveness might boost productivity.

By decreasing packaging waste and requirement for superfluous packaging materials, bulk disposable tubing supports sustainability initiatives. Bulk packaging might help to lessen the carbon footprint related to single-use products. It is something that businesses are increasingly realizing is important.

Bulk disposable tubing availability guarantees that there will always be a sufficient supply on hand. As a result, there will be less downtime while awaiting new supplies. This seamless availability might benefit companies that depend on perpetual procedures or have time-sensitive demands, increasing operational efficiency.

Beyond the healthcare sector, bulk disposable tubing is used in different fields such as beverages, food, drug manufacturing, and research. Due to its adaptability, it is a desirable alternative for a diverse range of uses, including fluid transfer, sampling, and transportation of gases & chemicals.
Get the data you need at a Fraction of the cost

Personalize your report by choosing insights you need
and save 40%!

Competitive Landscape

Leading medical tubing manufacturers are exploring international markets to tap into growing healthcare sectors around the world. By expanding their reach beyond their home markets, they can reach new opportunities for growth and broaden their customer base.

Collaboration with other healthcare sector participants is on the rise, including hospitals, research institutions, and producers of medical devices. Manufacturers can learn about new demands and trends by collaborating and co-developing creative solutions. This might also help in ensuring that their products seamlessly interface with other medical devices.

Medical tubing producers are integrating sustainable principles into their business models as environmental concerns rise. This entails the use of environmentally friendly materials, reduction of waste during production, and design of goods that can be recycled properly. Sustainability efforts not only support global environmental goals but also enhance a company's standing in the marketplace.

For instance:

  • In July 2022, at the Cooper River Site in South Carolina, DuPont opened a new production facility for DuPont Liveo Healthcare Solutions. In order to accommodate growing demand from Liveo clients, the new plant will boost its ability to cater to biopharmaceutical tubing extrusion.
  • In May 2022, HelixFlex, an exceptionally pure thermoplastic elastomer TPE tubing, was launched by Freudenberg Medical. It is a renowned producer of healthcare and pharmacological devices, components, and tubing. The new product was developed for utilization in medicinal and biopharmaceutical applications.

Scope of the Report

Attribute Details
Estimated Market Size (2023) US$ 13.1 billion
Projected Market Valuation (2033) US$ 23.5 billion
Value-based CAGR (2023 to 2033) 6.0%
Forecast Period 2023 to 2033
Historical Data Available for 2018 to 2022
Market Analysis Value (US$ billion)
Key Countries Covered United States, Canada, Brazil, Mexico, Germany, Italy, France, United Kingdom, Spain, Russia, GCC Countries, India, China, Japan, Australia
Key Segments Covered Product, Application, Region
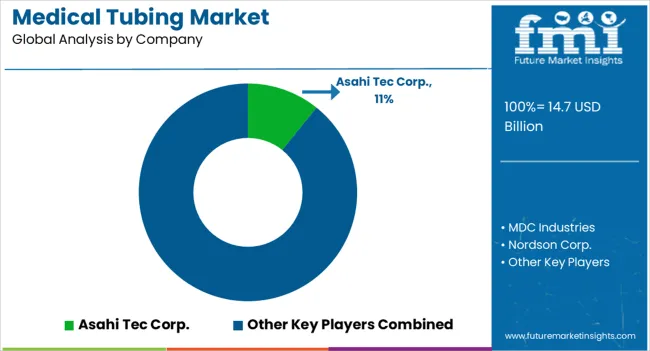
Key Companies Profiled Asahi Tec Corp.; MDC Industries; Nordson Corp.; ZARYS International Group; Hitachi Cable America, Inc.

Medical Tubing Market Outlook by Category

By Product:

  • Silicone
  • Polyolefins
  • Polyimide
  • Polyvinyl Chloride
  • Polycarbonates
  • Fluoropolymers
  • Polytetrafluoroethylene (PTFE)
  • Fluorinated Ethylene Propylene (FEP)
  • Others

By Application:

  • Bulk Disposable Tubing
  • Drug Delivery Systems
  • Catheters
  • Biopharmaceutical Laboratory Equipment
  • Others

By Region:

  • North America
  • Latin America
  • Western Europe
  • Eastern Europe
  • South Asia and Pacific
  • East Asia
  • Middle East and Africa

Frequently Asked Questions

How big is the medical tubing market?

The medical tubing industry is likely to top US$ 23.5 billion in 2033.

At what CAGR would the market expand from 2023 to 2033?

The market is set to expand at 6.0% CAGR from 2023 to 2033.

At what CAGR did the market surge between 2018 and 2022?

The market exhibited a CAGR of 7.7% between 2018 and 2022.

At what CAGR will China market expand through 2033?

China market is estimated to expand at a CAGR of 5.9% through 2033.

Which is the dominant product segment in the market?

Silicone segment might witness a CAGR of 5.8% from 2023 to 2033.

What is the United Kingdom market outlook?

The United Kingdom might exceed a valuation of US$ 340.6 million by 2033.

Table of Content
1. Executive Summary
    1.1. Global Market Outlook
    1.2. Demand-side Trends
    1.3. Supply-side Trends
    1.4. Technology Roadmap Analysis
    1.5. Analysis and Recommendations
2. Market Overview
    2.1. Market Coverage / Taxonomy
    2.2. Market Definition / Scope / Limitations
3. Market Background
    3.1. Market Dynamics
        3.1.1. Drivers
        3.1.2. Restraints
        3.1.3. Opportunity
        3.1.4. Trends
    3.2. Scenario Forecast
        3.2.1. Demand in Optimistic Scenario
        3.2.2. Demand in Likely Scenario
        3.2.3. Demand in Conservative Scenario
    3.3. Opportunity Map Analysis
    3.4. Product Life Cycle Analysis
    3.5. Supply Chain Analysis
        3.5.1. Supply Side Participants and their Roles
            3.5.1.1. Producers
            3.5.1.2. Mid-Level Participants (Traders/ Agents/ Brokers)
            3.5.1.3. Wholesalers and Distributors
        3.5.2. Value Added and Value Created at Node in the Supply Chain
        3.5.3. List of Raw Material Suppliers
        3.5.4. List of Existing and Potential Buyer’s
    3.6. Investment Feasibility Matrix
    3.7. Value Chain Analysis
        3.7.1. Profit Margin Analysis
        3.7.2. Wholesalers and Distributors
        3.7.3. Retailers
    3.8. PESTLE and Porter’s Analysis
    3.9. Regulatory Landscape
        3.9.1. By Key Regions
        3.9.2. By Key Countries
    3.10. Regional Parent Market Outlook
    3.11. Production and Consumption Statistics
    3.12. Import and Export Statistics
4. Global Market Analysis 2018 to 2022 and Forecast, 2023 to 2033
    4.1. Historical Market Size Value (US$ billion) & Volume (Units) Analysis, 2018 to 2022
    4.2. Current and Future Market Size Value (US$ billion) & Volume (Units) Projections, 2023 to 2033
        4.2.1. Y-o-Y Growth Trend Analysis
        4.2.2. Absolute $ Opportunity Analysis
5. Global Market Analysis 2018 to 2022 and Forecast 2023 to 2033, By Product
    5.1. Introduction / Key Findings
    5.2. Historical Market Size Value (US$ billion) & Volume (Units) Analysis By Product, 2018 to 2022
    5.3. Current and Future Market Size Value (US$ billion) & Volume (Units) Analysis and Forecast By Product, 2023 to 2033
        5.3.1. Silicone
        5.3.2. Polyolefins
        5.3.3. Polyimide
        5.3.4. Polyvinyl Chloride
        5.3.5. Polycarbonates
        5.3.6. Fluoropolymers
            5.3.6.1. Polytetrafluoroethylene (PTFE)
            5.3.6.2. Fluorinated Ethylene Propylene (FEP)
        5.3.7. Others
    5.4. Y-o-Y Growth Trend Analysis By Product, 2018 to 2022
    5.5. Absolute $ Opportunity Analysis By Product, 2023 to 2033
6. Global Market Analysis 2018 to 2022 and Forecast 2023 to 2033, By Application 
    6.1. Introduction / Key Findings
    6.2. Historical Market Size Value (US$ billion) & Volume (Units) Analysis By Application, 2018 to 2022
    6.3. Current and Future Market Size Value (US$ billion) & Volume (Units) Analysis and Forecast By Application, 2023 to 2033
        6.3.1. Bulk Disposable Tubing
        6.3.2. Drug Delivery Systems
        6.3.3. Catheters
        6.3.4. Biopharmaceutical Laboratory Equipment
        6.3.5. Others
    6.4. Y-o-Y Growth Trend Analysis By Application, 2018 to 2022
    6.5. Absolute $ Opportunity Analysis By Application, 2023 to 2033
7. Global Market Analysis 2018 to 2022 and Forecast 2023 to 2033, By Region
    7.1. Introduction
    7.2. Historical Market Size Value (US$ billion) & Volume (Units) Analysis By Region, 2018 to 2022
    7.3. Current Market Size Value (US$ billion) & Volume (Units) Analysis and Forecast By Region, 2023 to 2033
        7.3.1. North America
        7.3.2. Latin America
        7.3.3. Western Europe
        7.3.4. Eastern Europe
        7.3.5. South Asia and Pacific
        7.3.6. East Asia
        7.3.7. Middle East and Africa
    7.4. Market Attractiveness Analysis By Region
8. North America Market Analysis 2018 to 2022 and Forecast 2023 to 2033, By Country
    8.1. Historical Market Size Value (US$ billion) & Volume (Units) Trend Analysis By Market Taxonomy, 2018 to 2022
    8.2. Market Size Value (US$ billion) & Volume (Units) Forecast By Market Taxonomy, 2023 to 2033
        8.2.1. By Country
            8.2.1.1. United States
            8.2.1.2. Canada
        8.2.2. By Product
        8.2.3. By Application
    8.3. Market Attractiveness Analysis
        8.3.1. By Country
        8.3.2. By Product
        8.3.3. By Application
    8.4. Key Takeaways
9. Latin America Market Analysis 2018 to 2022 and Forecast 2023 to 2033, By Country
    9.1. Historical Market Size Value (US$ billion) & Volume (Units) Trend Analysis By Market Taxonomy, 2018 to 2022
    9.2. Market Size Value (US$ billion) & Volume (Units) Forecast By Market Taxonomy, 2023 to 2033
        9.2.1. By Country
            9.2.1.1. Brazil
            9.2.1.2. Mexico
            9.2.1.3. Rest of Latin America
        9.2.2. By Product
        9.2.3. By Application
    9.3. Market Attractiveness Analysis
        9.3.1. By Country
        9.3.2. By Product
        9.3.3. By Application
    9.4. Key Takeaways
10. Western Europe Market Analysis 2018 to 2022 and Forecast 2023 to 2033, By Country
    10.1. Historical Market Size Value (US$ billion) & Volume (Units) Trend Analysis By Market Taxonomy, 2018 to 2022
    10.2. Market Size Value (US$ billion) & Volume (Units) Forecast By Market Taxonomy, 2023 to 2033
        10.2.1. By Country
            10.2.1.1. Germany
            10.2.1.2. United Kingdom
            10.2.1.3. France
            10.2.1.4. Spain
            10.2.1.5. Italy
            10.2.1.6. Rest of Western Europe
        10.2.2. By Product
        10.2.3. By Application
    10.3. Market Attractiveness Analysis
        10.3.1. By Country
        10.3.2. By Product
        10.3.3. By Application
    10.4. Key Takeaways
11. Eastern Europe Market Analysis 2018 to 2022 and Forecast 2023 to 2033, By Country
    11.1. Historical Market Size Value (US$ billion) & Volume (Units) Trend Analysis By Market Taxonomy, 2018 to 2022
    11.2. Market Size Value (US$ billion) & Volume (Units) Forecast By Market Taxonomy, 2023 to 2033
        11.2.1. By Country
            11.2.1.1. Poland
            11.2.1.2. Russia
            11.2.1.3. Czech Republic
            11.2.1.4. Romania
            11.2.1.5. Rest of Eastern Europe
        11.2.2. By Product
        11.2.3. By Application
    11.3. Market Attractiveness Analysis
        11.3.1. By Country
        11.3.2. By Product
        11.3.3. By Application
    11.4. Key Takeaways
12. South Asia and Pacific Market Analysis 2018 to 2022 and Forecast 2023 to 2033, By Country
    12.1. Historical Market Size Value (US$ billion) & Volume (Units) Trend Analysis By Market Taxonomy, 2018 to 2022
    12.2. Market Size Value (US$ billion) & Volume (Units) Forecast By Market Taxonomy, 2023 to 2033
        12.2.1. By Country
            12.2.1.1. India
            12.2.1.2. Bangladesh
            12.2.1.3. Australia
            12.2.1.4. New Zealand
            12.2.1.5. Rest of South Asia and Pacific
        12.2.2. By Product
        12.2.3. By Application
    12.3. Market Attractiveness Analysis
        12.3.1. By Country
        12.3.2. By Product
        12.3.3. By Application
    12.4. Key Takeaways
13. East Asia Market Analysis 2018 to 2022 and Forecast 2023 to 2033, By Country
    13.1. Historical Market Size Value (US$ billion) & Volume (Units) Trend Analysis By Market Taxonomy, 2018 to 2022
    13.2. Market Size Value (US$ billion) & Volume (Units) Forecast By Market Taxonomy, 2023 to 2033
        13.2.1. By Country
            13.2.1.1. China
            13.2.1.2. Japan
            13.2.1.3. South Korea
        13.2.2. By Product
        13.2.3. By Application
    13.3. Market Attractiveness Analysis
        13.3.1. By Country
        13.3.2. By Product
        13.3.3. By Application
    13.4. Key Takeaways
14. Middle East and Africa Market Analysis 2018 to 2022 and Forecast 2023 to 2033, By Country
    14.1. Historical Market Size Value (US$ billion) & Volume (Units) Trend Analysis By Market Taxonomy, 2018 to 2022
    14.2. Market Size Value (US$ billion) & Volume (Units) Forecast By Market Taxonomy, 2023 to 2033
        14.2.1. By Country
            14.2.1.1. GCC Countries
            14.2.1.2. South Africa
            14.2.1.3. Israel
            14.2.1.4. Rest of Middle East and Africa
        14.2.2. By Product
        14.2.3. By Application
    14.3. Market Attractiveness Analysis
        14.3.1. By Country
        14.3.2. By Product
        14.3.3. By Application
    14.4. Key Takeaways
15. Key Countries Market Analysis
    15.1. United States
        15.1.1. Pricing Analysis
        15.1.2. Market Share Analysis, 2022
            15.1.2.1. By Product
            15.1.2.2. By Application
    15.2. Canada
        15.2.1. Pricing Analysis
        15.2.2. Market Share Analysis, 2022
            15.2.2.1. By Product
            15.2.2.2. By Application
    15.3. Brazil
        15.3.1. Pricing Analysis
        15.3.2. Market Share Analysis, 2022
            15.3.2.1. By Product
            15.3.2.2. By Application
    15.4. Mexico
        15.4.1. Pricing Analysis
        15.4.2. Market Share Analysis, 2022
            15.4.2.1. By Product
            15.4.2.2. By Application
    15.5. Germany
        15.5.1. Pricing Analysis
        15.5.2. Market Share Analysis, 2022
            15.5.2.1. By Product
            15.5.2.2. By Application
    15.6. United Kingdom
        15.6.1. Pricing Analysis
        15.6.2. Market Share Analysis, 2022
            15.6.2.1. By Product
            15.6.2.2. By Application
    15.7. France
        15.7.1. Pricing Analysis
        15.7.2. Market Share Analysis, 2022
            15.7.2.1. By Product
            15.7.2.2. By Application
    15.8. Spain
        15.8.1. Pricing Analysis
        15.8.2. Market Share Analysis, 2022
            15.8.2.1. By Product
            15.8.2.2. By Application
    15.9. Italy
        15.9.1. Pricing Analysis
        15.9.2. Market Share Analysis, 2022
            15.9.2.1. By Product
            15.9.2.2. By Application
    15.10. Poland
        15.10.1. Pricing Analysis
        15.10.2. Market Share Analysis, 2022
            15.10.2.1. By Product
            15.10.2.2. By Application
    15.11. Russia
        15.11.1. Pricing Analysis
        15.11.2. Market Share Analysis, 2022
            15.11.2.1. By Product
            15.11.2.2. By Application
    15.12. Czech Republic
        15.12.1. Pricing Analysis
        15.12.2. Market Share Analysis, 2022
            15.12.2.1. By Product
            15.12.2.2. By Application
    15.13. Romania
        15.13.1. Pricing Analysis
        15.13.2. Market Share Analysis, 2022
            15.13.2.1. By Product
            15.13.2.2. By Application
    15.14. India
        15.14.1. Pricing Analysis
        15.14.2. Market Share Analysis, 2022
            15.14.2.1. By Product
            15.14.2.2. By Application
    15.15. Bangladesh
        15.15.1. Pricing Analysis
        15.15.2. Market Share Analysis, 2022
            15.15.2.1. By Product
            15.15.2.2. By Application
    15.16. Australia
        15.16.1. Pricing Analysis
        15.16.2. Market Share Analysis, 2022
            15.16.2.1. By Product
            15.16.2.2. By Application
    15.17. New Zealand
        15.17.1. Pricing Analysis
        15.17.2. Market Share Analysis, 2022
            15.17.2.1. By Product
            15.17.2.2. By Application
    15.18. China
        15.18.1. Pricing Analysis
        15.18.2. Market Share Analysis, 2022
            15.18.2.1. By Product
            15.18.2.2. By Application
    15.19. Japan
        15.19.1. Pricing Analysis
        15.19.2. Market Share Analysis, 2022
            15.19.2.1. By Product
            15.19.2.2. By Application
    15.20. South Korea
        15.20.1. Pricing Analysis
        15.20.2. Market Share Analysis, 2022
            15.20.2.1. By Product
            15.20.2.2. By Application
    15.21. GCC Countries
        15.21.1. Pricing Analysis
        15.21.2. Market Share Analysis, 2022
            15.21.2.1. By Product
            15.21.2.2. By Application
    15.22. South Africa
        15.22.1. Pricing Analysis
        15.22.2. Market Share Analysis, 2022
            15.22.2.1. By Product
            15.22.2.2. By Application
    15.23. Israel
        15.23.1. Pricing Analysis
        15.23.2. Market Share Analysis, 2022
            15.23.2.1. By Product
            15.23.2.2. By Application
16. Market Structure Analysis
    16.1. Competition Dashboard
    16.2. Competition Benchmarking
    16.3. Market Share Analysis of Top Players
        16.3.1. By Regional
        16.3.2. By Product
        16.3.3. By Application
17. Competition Analysis
    17.1. Competition Deep Dive
        17.1.1. Asahi Tec Corp.
            17.1.1.1. Overview
            17.1.1.2. Product Portfolio
            17.1.1.3. Profitability by Market Segments
            17.1.1.4. Sales Footprint
            17.1.1.5. Strategy Overview
                17.1.1.5.1. Marketing Strategy
                17.1.1.5.2. Product Strategy
                17.1.1.5.3. Channel Strategy
        17.1.2. MDC Industries
            17.1.2.1. Overview
            17.1.2.2. Product Portfolio
            17.1.2.3. Profitability by Market Segments
            17.1.2.4. Sales Footprint
            17.1.2.5. Strategy Overview
                17.1.2.5.1. Marketing Strategy
                17.1.2.5.2. Product Strategy
                17.1.2.5.3. Channel Strategy
        17.1.3. Nordson Corp.
            17.1.3.1. Overview
            17.1.3.2. Product Portfolio
            17.1.3.3. Profitability by Market Segments
            17.1.3.4. Sales Footprint
            17.1.3.5. Strategy Overview
                17.1.3.5.1. Marketing Strategy
                17.1.3.5.2. Product Strategy
                17.1.3.5.3. Channel Strategy
        17.1.4. ZARYS International Group
            17.1.4.1. Overview
            17.1.4.2. Product Portfolio
            17.1.4.3. Profitability by Market Segments
            17.1.4.4. Sales Footprint
            17.1.4.5. Strategy Overview
                17.1.4.5.1. Marketing Strategy
                17.1.4.5.2. Product Strategy
                17.1.4.5.3. Channel Strategy
        17.1.5. Hitachi Cable America Inc.
            17.1.5.1. Overview
            17.1.5.2. Product Portfolio
            17.1.5.3. Profitability by Market Segments
            17.1.5.4. Sales Footprint
            17.1.5.5. Strategy Overview
                17.1.5.5.1. Marketing Strategy
                17.1.5.5.2. Product Strategy
                17.1.5.5.3. Channel Strategy
        17.1.6. NewAge Industries, Inc.
            17.1.6.1. Overview
            17.1.6.2. Product Portfolio
            17.1.6.3. Profitability by Market Segments
            17.1.6.4. Sales Footprint
            17.1.6.5. Strategy Overview
                17.1.6.5.1. Marketing Strategy
                17.1.6.5.2. Product Strategy
                17.1.6.5.3. Channel Strategy
        17.1.7. TE Connectivity
            17.1.7.1. Overview
            17.1.7.2. Product Portfolio
            17.1.7.3. Profitability by Market Segments
            17.1.7.4. Sales Footprint
            17.1.7.5. Strategy Overview
                17.1.7.5.1. Marketing Strategy
                17.1.7.5.2. Product Strategy
                17.1.7.5.3. Channel Strategy
        17.1.8. Freudenberg & Co. KG
            17.1.8.1. Overview
            17.1.8.2. Product Portfolio
            17.1.8.3. Profitability by Market Segments
            17.1.8.4. Sales Footprint
            17.1.8.5. Strategy Overview
                17.1.8.5.1. Marketing Strategy
                17.1.8.5.2. Product Strategy
                17.1.8.5.3. Channel Strategy
        17.1.9. Spectrum Plastics Group
            17.1.9.1. Overview
            17.1.9.2. Product Portfolio
            17.1.9.3. Profitability by Market Segments
            17.1.9.4. Sales Footprint
            17.1.9.5. Strategy Overview
                17.1.9.5.1. Marketing Strategy
                17.1.9.5.2. Product Strategy
                17.1.9.5.3. Channel Strategy
        17.1.10. ATAG SpA
            17.1.10.1. Overview
            17.1.10.2. Product Portfolio
            17.1.10.3. Profitability by Market Segments
            17.1.10.4. Sales Footprint
            17.1.10.5. Strategy Overview
                17.1.10.5.1. Marketing Strategy
                17.1.10.5.2. Product Strategy
                17.1.10.5.3. Channel Strategy
18. Assumptions & Acronyms Used
19. Research Methodology
Recommendations

Healthcare

Cosmetology Market

August 2023

REP-GB-4203

342 pages

Healthcare

Cholesterol Monitors Market

August 2023

REP-GB-5400

342 pages

Healthcare

Companion Diagnostics Market

August 2023

REP-GB-1255

342 pages

Healthcare

Oncology Information Systems Market

August 2023

REP-GB-15150

333 pages

Explore Healthcare Insights

View Reports
Future Market Insights

Medical Tubing Market

Schedule a Call