Reports

- Global Locations -

Headquarters

Future Market Insights, Inc.

Christiana Corporate, 200
Continental Drive, Suite 401,
Newark, Delaware - 19713,
United States

T: +1-845-579-5705

Americas

Future Market Insights, Inc.

616 Corporate Way, Suite 2-9018,
Valley Cottage, NY 10989, United States

T: +1-347-918-3531

MEA

Future Market Insights

1602-6 Jumeirah Bay X2 Tower, Plot No: JLT-PH2-X2A,
Jumeirah Lakes Towers, Dubai,
United Arab Emirates

Europe

Future Market Insights

3rd Floor, 207 Regent Street,
W1B 3HH London
United Kingdom

T: + 44 (0) 20 8123 9659
D: +44 (0) 20 3287 4268

Asia Pacific

Future Market Insights

IndiaLand Global Tech Park, Unit UG-1, Behind Grand HighStreet, Phase 1, Hinjawadi, MH, Pune – 411057, India

Medical Polyetheretherketone Market Outlook (2022-2032)

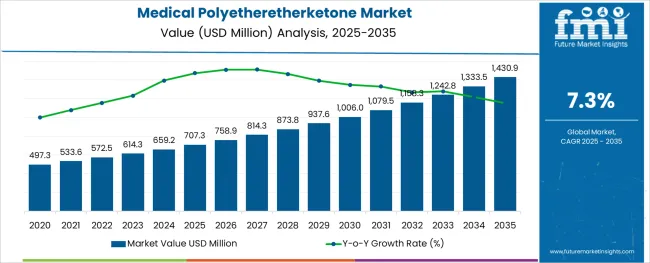
[324 Pages Report] The global medical polyetheretherketone market is expected to reach a market valuation of US$ 572.54 Mn by 2022, and it is anticipated to be valued at about US$ 1158.26 Mn by 2032. The demand for medical polyetheretherketone is anticipated to grow at a CAGR of 7.3% from 2022 and 2032.

The medical polyetheretherketone market share is anticipated to grow as it is utilized in many end use sectors due to the good qualities that make it useful in transportation, semiconductors, industrial, food, and clinical areas. Over the next few years, the manufacturers of medical polyetheretherketone are expected to enter new markets and look for opportunities in untapped markets.

In the medical industry, the overall medical polyetheretherketone market is also expected to have a wide range of uses over the next few years. At the moment, it is used in spinal surgery, but it is likely to be used in more clinical settings and commercial medical products in the future. Due to this, the sales of medical polyetheretherketone are projected to grow at a rapid pace during 2022-2032.

Attributes Value
Medical Polyetheretherketone Market Size (2022) US$ 572.54 Million
Medical Polyetheretherketone Market Projected Size (2032) US$ 1158.26 Million
Medical Polyetheretherketone Market Value CAGR (2022-2032) 7.3%

There is a rising need for research and development to find new clinical applications which propel the medical polyetheretherketone market growth. Due to a lack of long-term clinical data, medical polyetheretherketone products have limited uses in the field right now. However, medical polyetheretherketone uses are expected to grow over the next few years because they have a lot of potential as a replacement.

Medical polyetheretherketone is one of the most expensive polymer-based products. As a result, pricing is one of the major factors limiting the medical polyetheretherketone market growth. Over the next few years, it is expected that the high price is likely to result in decreased sales of medical polyetheretherketone.

Don't pay for what you don't need

Customize your report by selecting specific countries or regions and save 30%!

What are the Major Driving Factors for the Medical Polyetheretherketone Market?

The medical polyetheretherketone market share is anticipated to be bolstered by an increase in the adoption of medical polyetheretherketone as a replacement for metals. Aluminium, carbon steel, bronze, stainless steel, brass, titanium, and magnesium are just a few of the metals that medical polyetheretherketone has begun to replace in large quantities.

Medical and automotive manufacturers are forced to improve fuel efficiency, reduce maintenance requirements, and reduce noise levels due to stringent environmental regulations. As a result of these regulations, automobile light-weighting is driving the preference for lighter vehicles. For both reducing emissions and increasing fuel efficiency, polyetheretherketone is a significant upgrade over metals.

Various Application of Polyetheretherketone Dominating Multiple End Use Sectors

  • The global polyetheretherketone market size is anticipated to grow as polyetheretherketone is also utilized in the automobile and aerospace sectors to make a variety of interior and exterior components. Furthermore, polyetheretherketone is highly valued for its intense heat resistance, lightweight, dimensional stability, and chemical resistance.
  • In the aircraft industry, it is critical to employ fire retardant materials that generate less smoke and harmful gases in the event of a fire. PEEK meets these critical characteristics, which explains the rising demand for polyetheretherketone in the aerospace industry.
  • Polyetheretherketone is also favoured by manufacturers of medical equipment since it minimizes device weight.
  • Polyetheretherketone is preferred due to its radiopacity, as certain scanning instruments cannot scan through metallic parts. Finally, owing to their great temperature resistance, PEEK tools may be easily sanitised and reused several times.
Sabyasachi Ghosh
Sabyasachi Ghosh

Principal Consultant

Talk to Analyst

Find your sweet spots for generating winning opportunities in this market.

What are the Growth Restraining Factors in the Medical Polyetheretherketone Market?

The demand for medical polyetheretherketone is likely to decline as medical polyetheretherketone is more expensive than other medical-grade polymers. However, these plastics can't replace medical polyetheretherketone as it is a high-performance polymer with better qualities like high flexural strength, resistance to impact, resistance to chemicals and heat, and compatibility with living organisms.

Furthermore, strict rules about medical devices also make it hard to use medical polyetheretherketone in medical devices and implants. As a result, these factors are anticipated to impede the growth of the medical polyetheretherketone market share.

Comparative View of Adjacent Medical Polyetheretherketone Market

Medical Polyetheretherketone Market:

Attributes Medical Polyetheretherketone Market
CAGR (2022 to 2032) 7.3%
Market Value (2022) US$ 572.54 million
Growth Factor Demand for PEEK in high-end applications like medical, aerospace, and automotive has been fueled by its unique properties, such as chemical resistance and greater dimensional stability over conventional materials.
Future Opportunities PEEK polymers are increasingly being used in place of more traditional materials like steel, aluminium, and wood due to their unique set of properties.
Market Trends An obstacle to mass production is the high cost of PEEK, which is increasingly being challenged by hybrid polymers and composite materials.

Polyphenylene Sulphide Market:

Attributes Polyphenylene Sulphide Market
CAGR (2022 to 2032) 9.6%
Market Value (2022) US$ 1,574.7 million
Growth Factor The PPS business is likely to benefit from advancements in newer technology.
Future Opportunities Automotive applications of polyphenylene sulphide (PPS) are being driven by the growing industrialization in Asia-Pacific.
Market Trends Asia-filter Pacific's bag market is boosted by improving economies and rising demand from the automotive, electrical & electronics, and filter bag application sectors.

Industrial PU Elastomer Market:

Attributes Industrial PU Elastomer Market
CAGR (2022 to 2032) 6.3%
Market Value (2022) US$ 7.7 billion
Growth Factor An increase in the use of PU elastomers in the transportation industry and strict emission regulations by governments around the world have led to a significant increase in elastomer demand.
Future Opportunities Minimally invasive surgery is becoming increasingly popular.
Market Trends Because of the rising global population, the industrial PU elastomer market is expected to be driven by the rapidly expanding building and construction applications.

The rising demand for clinical applications is projected to be a critical medical polyetheretherketone market driver. Polyether ether ketone is emerging as an efficient product for implantable devices, primarily for spinal surgery, and is gradually replacing titanium, which was formerly utilized for such purposes. Carbon-filled PEEK is favored for such medicinal applications. To meet the growing demand for dental implants and dentures, the sales of medical polyetheretherketone denture base materials are expected to increase during 2022-2032.

Get the data you need at a Fraction of the cost

Personalize your report by choosing insights you need
and save 40%!

Category-wise Insights for Global Medical Polyetheretherketone Market

Which Segment of the Medical Polyetheretherketone Market on the Basis of Application is Performing Better?

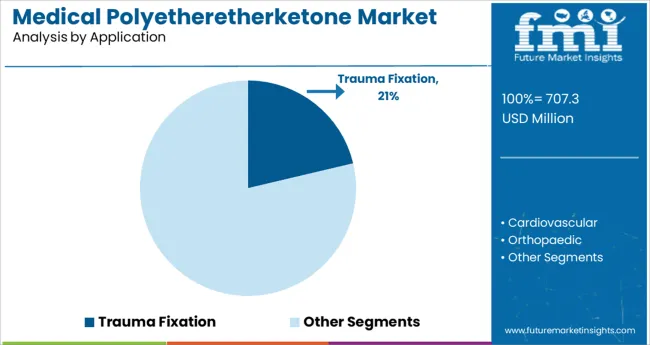
More than 30 percent of medical polyetheretherketone market revenue is anticipated to be generated in 2021 by the spine implantation segment. To track changes in the spinal cord and soft tissue structures, diagnostic imaging like MRI or CT scans is critical. As a result, the sales of medical polyetheretherketone are increasing as they are being used in spine implants instead of stainless steel or titanium because these metals do not work well with these imaging techniques. These devices are used in the treatment of degenerative spine conditions like spondylolisthesis, degenerative disc disease, spinal narrowing, and scoliosis.

During the forecast period, the cardiovascular segment of the medical polyetheretherketone market is expected to grow at the fastest rate in revenue. Flexible modulus, high temperature and electrical resistance, biocompatibility and sterilization ease are just some of the advantages of medical polyetheretherketone. Melt processing allows it to be formed into vascular catheter tubes with a small inner diameter.

With the rise of medical polyetheretherketone as an alternative to polyimides, tubes and catheters are becoming more commonplace in vascular medical devices. Stent implantation, transfemoral heart valve implantation and ablation catheters are all examples of procedures with high adoption of medical polyetheretherketone.
Regional Analysis of the Medical Polyetheretherketone Market

What is the North America Medical Polyetheretherketone Market Growth Outlook?

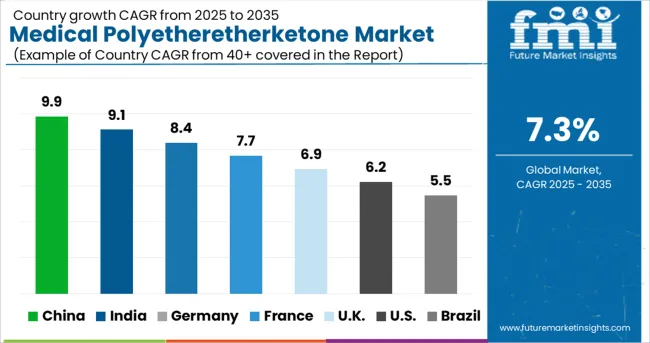
The medical polyetheretherketone market in the United States is projected to rise rapidly during the projected period, owing to an increase in the number of healthcare institutions and medical device advances. The expanding population in the United States is predicted to raise the demand for spine implants, stents, heart valves, and knee and hip implants, which is likely to drive the use of medical-grade plastics even further.

Furthermore, the United States has a large number of medical component and device manufacturers who are progressively incorporating PEEK into their products. Another major element boosting the medical polyether ether ketone market in the country is the presence of key manufacturers.

How is Europe Contributing to the Medical Polyetheretherketone Market?

Due to Europe's strict regulations, the global medical polyetheretherketone market is anticipated to be dominated by Europe. In turn, this increased demand for transportation services led to regional dominance as a result of the strict environmental and fuel consumption guidelines.

In 2021, Europe held the largest share of 45 per cent in the medical polyetheretherketone market. The adoption of medical polyetheretherketone is primarily in the automotive, insulation, electronics & electrical, industrial, and general engineering sectors in Europe and the U.S.A.

What is the Performance of Medical Polyetheretherketone Market in Asia Pacific Region?

In terms of revenue, the Asia Pacific region is expected to grow at a rate of 8.7 per cent over the forecast period. With a medical polyetheretherketone market share of USD 36.17 Mn in APAC in 2021, cardiovascular application emerged as the largest segment in the region. Sedentary lifestyles among young and elderly populations in countries like China and India are to blame for this. To meet the growing demand for dental implants and dentures in the region, medical polyetheretherketone denture base material is expected to increase in popularity. Dental implants and fixtures are predicted to grow at a 9.3% CAGR in the Asia Pacific region over the forecast period.
Competitive Landscape for the Medical Polyetheretherketone Market

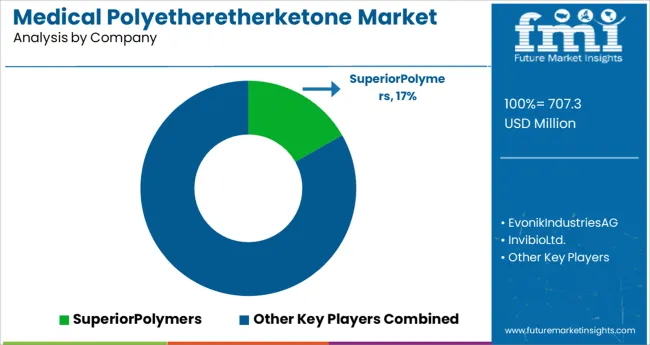
As a result of a small number of regional players, the global medical polyetheretherketone market is consolidated. Panjin Zhongrun High-Performance Polymers Co. Ltd., Victrex Plc., Jrlon Inc., and Quadrant EPP Surlon India Ltd. are major key participants in the market.

The widening industry service provider business is a result of increasing overall application in a variety of fields, including medical, aerospace, and automotive. Prototype & Plastic Mold Co. Inc., Parkway Products Inc., A. Schulman AG and Stern Industries Inc. are just some of the major service providers that use the item for injection moulding and other purposes across a variety of different industries.

Many industries, including healthcare, aerospace, electronics, packaging, and automobiles, are expected to benefit from the growing product application scope of the market. Medical polyetheretherketone -based end-use technologies are being patented by the industries themselves in order to gain a competitive edge over others.

Recent Developments in the Medical Polyetheretherketone Market

  • In November 2020, In2Bones USA, a subsidiary of In2Bones Global, Inc. and a global maker of implants for the upper and lower extremities, announced that it had reached an exclusive agreement with Invibio Ltd. With the help of the latter's PEEK-OPTIMA Ultra Reinforced (POUR) carbon fibre technology, research and development will be done on lower extremity implants.
  • Celanese Corporation agreed to buy SO.F.TER Group (Italy), one of the world's major thermoplastic compounder makers. This acquisition aided the company in acquiring technical expertise, manufacturing, and compounding capabilities for its goods, as well as expanding its reach in Mexico, Brazil, Italy, and the United States.
  • Solvay S.A. launched KetaSpire KT-825, a novel high stiffness grade of KetaSpire Polyether Ether Ketone (PEEK) that gives 50% more modulus/stiffness than regular plain PEEK grades.

Startup Ecosystem in the Global Medical Polyetheretherketone Market

Startups in the medical polyetheretherketone market are focusing on making new products and working together as their main ways to grow in the global market. In May 2021, the FDA approved a new Creed Cannulated Screw System made by Carbon22 from Solvay's Zeniva (PEEK) for foot and ankle surgery. Since there are already well-known players in the market, competition is high. The companies that make medical polyetheretherketone work with other market players to increase their market share.

Global Medical Polyetheretherketone Market Key Players

Medical Polyetheretherketone Market by Segmentation

By Application:

  • Trauma Fixation
  • Cardiovascular
  • Orthopaedic
    • Spine Implantation
    • Knee & Hip Implantation
  • Dental Implants & Fixtures
  • Others

By Region:

  • North America
  • Latin America
  • Europe
  • Asia Pacific
  • Middle East and Africa

Frequently Asked Questions

What is the Growth Outlook for Medical Polyetheretherketone Market?

The medical polyetheretherketone market is expected to grow at 7.3% CAGR over 2022-2032.

What is the Net Worth of the Global Medical Polyetheretherketone Market?

The medical polyetheretherketone market is estimated to be around US$ 572.54 Mn in 2022.

What is the Projected Value of the Medical Polyetheretherketone Market?

The medical polyetheretherketone market is anticipated to reach a valuation of US$ 1158.26 Mn by 2032.

Which Application Type is Dominating the Medical Polyetheretherketone Market?

The spine implantation segment is estimated to dominate the market during 2022-2032.

Table of Content

1. Executive Summary

    1.1. Global Market Outlook

    1.2. Demand-side Trends

    1.3. Supply-side Trends

    1.4. Technology Roadmap Analysis

    1.5. Analysis and Recommendations

2. Market Overview

    2.1. Market Coverage / Taxonomy

    2.2. Market Definition / Scope / Limitations

3. Market Background

    3.1. Market Dynamics

        3.1.1. Drivers

        3.1.2. Restraints

        3.1.3. Opportunity

        3.1.4. Trends

    3.2. Scenario Forecast

        3.2.1. Demand in Optimistic Scenario

        3.2.2. Demand in Likely Scenario

        3.2.3. Demand in Conservative Scenario

    3.3. Opportunity Map Analysis

    3.4. Product Life Cycle Analysis

    3.5. Supply Chain Analysis

        3.5.1. Supply Side Participants and their Roles

            3.5.1.1. Producers

            3.5.1.2. Mid-Level Participants (Traders/ Agents/ Brokers)

            3.5.1.3. Wholesalers and Distributors

        3.5.2. Value Added and Value Created at Node in the Supply Chain

        3.5.3. List of Raw Material Suppliers

        3.5.4. List of Existing and Potential Buyer’s

    3.6. Investment Feasibility Matrix

    3.7. Value Chain Analysis

        3.7.1. Profit Margin Analysis

        3.7.2. Wholesalers and Distributors

        3.7.3. Retailers

    3.8. PESTLE and Porter’s Analysis

    3.9. Regulatory Landscape

        3.9.1. By Key Regions

        3.9.2. By Key Countries

    3.10. Regional Parent Market Outlook

    3.11. Production and Consumption Statistics

    3.12. Import and Export Statistics

4. Global Market Analysis 2017-2021 and Forecast, 2022-2032

    4.1. Historical Market Size Value (US$ Bn) & Volume (Tons) Analysis, 2017-2021

    4.2. Current and Future Market Size Value (US$ Bn) & Volume (Tons) Projections, 2022-2032

        4.2.1. Y-o-Y Growth Trend Analysis

        4.2.2. Absolute $ Opportunity Analysis

5. Global Market Analysis 2017-2021 and Forecast 2022-2032, By Application

    5.1. Introduction / Key Findings

    5.2. Historical Market Size Value (US$ Bn) & Volume (Tons) Analysis By Application, 2017-2021

    5.3. Current and Future Market Size Value (US$ Bn) & Volume (Tons) Analysis and Forecast By Application, 2022-2032

        5.3.1. Trauma Fixation

        5.3.2. Cardiovascular

        5.3.3. Orthopedic

            5.3.3.1. Spine Implantation

            5.3.3.2. Knee & Hip Implantation

        5.3.4. Dental Implants & Fixtures

        5.3.5. Other Applications

    5.4. Y-o-Y Growth Trend Analysis By Application, 2017-2021

    5.5. Absolute $ Opportunity Analysis By Application, 2022-2032

6. Global Market Analysis 2017-2021 and Forecast 2022-2032, By Region

    6.1. Introduction

    6.2. Historical Market Size Value (US$ Bn) & Volume (Tons) Analysis By Region, 2017-2021

    6.3. Current Market Size Value (US$ Bn) & Volume (Tons) Analysis and Forecast By Region, 2022-2032

        6.3.1. North America

        6.3.2. Latin America

        6.3.3. Europe

        6.3.4. Asia Pacific

        6.3.5. MEA

    6.4. Market Attractiveness Analysis By Region

7. North America Market Analysis 2017-2021 and Forecast 2022-2032, By Country

    7.1. Historical Market Size Value (US$ Bn) & Volume (Tons) Trend Analysis By Market Taxonomy, 2017-2021

    7.2. Market Size Value (US$ Bn) & Volume (Tons) Forecast By Market Taxonomy, 2022-2032

        7.2.1. By Country

            7.2.1.1. U.S.

            7.2.1.2. Canada

        7.2.2. By Application

    7.3. Market Attractiveness Analysis

        7.3.1. By Country

        7.3.2. By Application

    7.4. Key Takeaways

8. Latin America Market Analysis 2017-2021 and Forecast 2022-2032, By Country

    8.1. Historical Market Size Value (US$ Bn) & Volume (Tons) Trend Analysis By Market Taxonomy, 2017-2021

    8.2. Market Size Value (US$ Bn) & Volume (Tons) Forecast By Market Taxonomy, 2022-2032

        8.2.1. By Country

            8.2.1.1. Brazil

            8.2.1.2. Mexico

            8.2.1.3. Rest of Latin America

        8.2.2. By Application

    8.3. Market Attractiveness Analysis

        8.3.1. By Country

        8.3.2. By Application

    8.4. Key Takeaways

9. Europe Market Analysis 2017-2021 and Forecast 2022-2032, By Country

    9.1. Historical Market Size Value (US$ Bn) & Volume (Tons) Trend Analysis By Market Taxonomy, 2017-2021

    9.2. Market Size Value (US$ Bn) & Volume (Tons) Forecast By Market Taxonomy, 2022-2032

        9.2.1. By Country

            9.2.1.1. Germany

            9.2.1.2. U.K.

            9.2.1.3. France

            9.2.1.4. Spain

            9.2.1.5. Italy

            9.2.1.6. Russia

            9.2.1.7. Rest of Europe

        9.2.2. By Application

    9.3. Market Attractiveness Analysis

        9.3.1. By Country

        9.3.2. By Application

    9.4. Key Takeaways

10. Asia Pacific Market Analysis 2017-2021 and Forecast 2022-2032, By Country

    10.1. Historical Market Size Value (US$ Bn) & Volume (Tons) Trend Analysis By Market Taxonomy, 2017-2021

    10.2. Market Size Value (US$ Bn) & Volume (Tons) Forecast By Market Taxonomy, 2022-2032

        10.2.1. By Country

            10.2.1.1. China

            10.2.1.2. Japan

            10.2.1.3. India

            10.2.1.4. South Korea

            10.2.1.5. Australia

            10.2.1.6. Rest of APAC

        10.2.2. By Application

    10.3. Market Attractiveness Analysis

        10.3.1. By Country

        10.3.2. By Application

    10.4. Key Takeaways

11. MEA Market Analysis 2017-2021 and Forecast 2022-2032, By Country

    11.1. Historical Market Size Value (US$ Bn) & Volume (Tons) Trend Analysis By Market Taxonomy, 2017-2021

    11.2. Market Size Value (US$ Bn) & Volume (Tons) Forecast By Market Taxonomy, 2022-2032

        11.2.1. By Country

            11.2.1.1. South Africa

            11.2.1.2. Saudi Arabia

            11.2.1.3. UAE

            11.2.1.4. Israel

            11.2.1.5. Rest of MEA

        11.2.2. By Application

    11.3. Market Attractiveness Analysis

        11.3.1. By Country

        11.3.2. By Application

    11.4. Key Takeaways

12. Key Countries Market Analysis

    12.1. U.S.

        12.1.1. Pricing Analysis

        12.1.2. Market Share Analysis, 2021

            12.1.2.1. By Application

    12.2. Canada

        12.2.1. Pricing Analysis

        12.2.2. Market Share Analysis, 2021

            12.2.2.1. By Application

    12.3. Brazil

        12.3.1. Pricing Analysis

        12.3.2. Market Share Analysis, 2021

            12.3.2.1. By Application

    12.4. Mexico

        12.4.1. Pricing Analysis

        12.4.2. Market Share Analysis, 2021

            12.4.2.1. By Application

    12.5. Germany

        12.5.1. Pricing Analysis

        12.5.2. Market Share Analysis, 2021

            12.5.2.1. By Application

    12.6. U.K.

        12.6.1. Pricing Analysis

        12.6.2. Market Share Analysis, 2021

            12.6.2.1. By Application

    12.7. France

        12.7.1. Pricing Analysis

        12.7.2. Market Share Analysis, 2021

            12.7.2.1. By Application

    12.8. Spain

        12.8.1. Pricing Analysis

        12.8.2. Market Share Analysis, 2021

            12.8.2.1. By Application

    12.9. Italy

        12.9.1. Pricing Analysis

        12.9.2. Market Share Analysis, 2021

            12.9.2.1. By Application

    12.10. Russia

        12.10.1. Pricing Analysis

        12.10.2. Market Share Analysis, 2021

            12.10.2.1. By Application

    12.11. China

        12.11.1. Pricing Analysis

        12.11.2. Market Share Analysis, 2021

            12.11.2.1. By Application

    12.12. Japan

        12.12.1. Pricing Analysis

        12.12.2. Market Share Analysis, 2021

            12.12.2.1. By Application

    12.13. India

        12.13.1. Pricing Analysis

        12.13.2. Market Share Analysis, 2021

            12.13.2.1. By Application

    12.14. South Korea

        12.14.1. Pricing Analysis

        12.14.2. Market Share Analysis, 2021

            12.14.2.1. By Application

    12.15. Australia

        12.15.1. Pricing Analysis

        12.15.2. Market Share Analysis, 2021

            12.15.2.1. By Application

    12.16. South Africa

        12.16.1. Pricing Analysis

        12.16.2. Market Share Analysis, 2021

            12.16.2.1. By Application

    12.17. Saudi Arabia

        12.17.1. Pricing Analysis

        12.17.2. Market Share Analysis, 2021

            12.17.2.1. By Application

    12.18. UAE

        12.18.1. Pricing Analysis

        12.18.2. Market Share Analysis, 2021

            12.18.2.1. By Application

    12.19. Israel

        12.19.1. Pricing Analysis

        12.19.2. Market Share Analysis, 2021

            12.19.2.1. By Application

13. Market Structure Analysis

    13.1. Competition Dashboard

    13.2. Competition Benchmarking

    13.3. Market Share Analysis of Top Players

        13.3.1. By Regional

        13.3.2. By Application

14. Competition Analysis

    14.1. Competition Deep Dive

        14.1.1. Superior Polymers

            14.1.1.1. Overview

            14.1.1.2. Product Portfolio

            14.1.1.3. Profitability by Market Segments

            14.1.1.4. Sales Footprint

            14.1.1.5. Strategy Overview

                14.1.1.5.1. Marketing Strategy

                14.1.1.5.2. Product Strategy

                14.1.1.5.3. Channel Strategy

        14.1.2. Evonik Industries AG

            14.1.2.1. Overview

            14.1.2.2. Product Portfolio

            14.1.2.3. Profitability by Market Segments

            14.1.2.4. Sales Footprint

            14.1.2.5. Strategy Overview

                14.1.2.5.1. Marketing Strategy

                14.1.2.5.2. Product Strategy

                14.1.2.5.3. Channel Strategy

        14.1.3. Invibio Ltd.

            14.1.3.1. Overview

            14.1.3.2. Product Portfolio

            14.1.3.3. Profitability by Market Segments

            14.1.3.4. Sales Footprint

            14.1.3.5. Strategy Overview

                14.1.3.5.1. Marketing Strategy

                14.1.3.5.2. Product Strategy

                14.1.3.5.3. Channel Strategy

        14.1.4. Solvay

            14.1.4.1. Overview

            14.1.4.2. Product Portfolio

            14.1.4.3. Profitability by Market Segments

            14.1.4.4. Sales Footprint

            14.1.4.5. Strategy Overview

                14.1.4.5.1. Marketing Strategy

                14.1.4.5.2. Product Strategy

                14.1.4.5.3. Channel Strategy

        14.1.5. Medtronic

            14.1.5.1. Overview

            14.1.5.2. Product Portfolio

            14.1.5.3. Profitability by Market Segments

            14.1.5.4. Sales Footprint

            14.1.5.5. Strategy Overview

                14.1.5.5.1. Marketing Strategy

                14.1.5.5.2. Product Strategy

                14.1.5.5.3. Channel Strategy

        14.1.6. Semadeni AG

            14.1.6.1. Overview

            14.1.6.2. Product Portfolio

            14.1.6.3. Profitability by Market Segments

            14.1.6.4. Sales Footprint

            14.1.6.5. Strategy Overview

                14.1.6.5.1. Marketing Strategy

                14.1.6.5.2. Product Strategy

                14.1.6.5.3. Channel Strategy

        14.1.7. Huang Liang Biomedical Technology

            14.1.7.1. Overview

            14.1.7.2. Product Portfolio

            14.1.7.3. Profitability by Market Segments

            14.1.7.4. Sales Footprint

            14.1.7.5. Strategy Overview

                14.1.7.5.1. Marketing Strategy

                14.1.7.5.2. Product Strategy

                14.1.7.5.3. Channel Strategy

        14.1.8. Dentallabor Bernhardt

            14.1.8.1. Overview

            14.1.8.2. Product Portfolio

            14.1.8.3. Profitability by Market Segments

            14.1.8.4. Sales Footprint

            14.1.8.5. Strategy Overview

                14.1.8.5.1. Marketing Strategy

                14.1.8.5.2. Product Strategy

                14.1.8.5.3. Channel Strategy

        14.1.9. Apium Additive Technologies GmbH

            14.1.9.1. Overview

            14.1.9.2. Product Portfolio

            14.1.9.3. Profitability by Market Segments

            14.1.9.4. Sales Footprint

            14.1.9.5. Strategy Overview

                14.1.9.5.1. Marketing Strategy

                14.1.9.5.2. Product Strategy

                14.1.9.5.3. Channel Strategy

        14.1.10. Goodfellow GmbH

            14.1.10.1. Overview

            14.1.10.2. Product Portfolio

            14.1.10.3. Profitability by Market Segments

            14.1.10.4. Sales Footprint

            14.1.10.5. Strategy Overview

                14.1.10.5.1. Marketing Strategy

                14.1.10.5.2. Product Strategy

                14.1.10.5.3. Channel Strategy

15. Assumptions & Acronyms Used

16. Research Methodology

Don't pay for what you don't need

Customize your report by selecting specific countries or regions and save 30%!

List of Tables

Table 1: Global Market Value (US$ Bn) Forecast by Region, 2017-2032

Table 2: Global Market Volume (Tons) Forecast by Region, 2017-2032

Table 3: Global Market Value (US$ Bn) Forecast by Application, 2017-2032

Table 4: Global Market Volume (Tons) Forecast by Application, 2017-2032

Table 5: North America Market Value (US$ Bn) Forecast by Country, 2017-2032

Table 6: North America Market Volume (Tons) Forecast by Country, 2017-2032

Table 7: North America Market Value (US$ Bn) Forecast by Application, 2017-2032

Table 8: North America Market Volume (Tons) Forecast by Application, 2017-2032

Table 9: Latin America Market Value (US$ Bn) Forecast by Country, 2017-2032

Table 10: Latin America Market Volume (Tons) Forecast by Country, 2017-2032

Table 11: Latin America Market Value (US$ Bn) Forecast by Application, 2017-2032

Table 12: Latin America Market Volume (Tons) Forecast by Application, 2017-2032

Table 13: Europe Market Value (US$ Bn) Forecast by Country, 2017-2032

Table 14: Europe Market Volume (Tons) Forecast by Country, 2017-2032

Table 15: Europe Market Value (US$ Bn) Forecast by Application, 2017-2032

Table 16: Europe Market Volume (Tons) Forecast by Application, 2017-2032

Table 17: Asia Pacific Market Value (US$ Bn) Forecast by Country, 2017-2032

Table 18: Asia Pacific Market Volume (Tons) Forecast by Country, 2017-2032

Table 19: Asia Pacific Market Value (US$ Bn) Forecast by Application, 2017-2032

Table 20: Asia Pacific Market Volume (Tons) Forecast by Application, 2017-2032

Table 21: MEA Market Value (US$ Bn) Forecast by Country, 2017-2032

Table 22: MEA Market Volume (Tons) Forecast by Country, 2017-2032

Table 23: MEA Market Value (US$ Bn) Forecast by Application, 2017-2032

Table 24: MEA Market Volume (Tons) Forecast by Application, 2017-2032
Sabyasachi Ghosh
Sabyasachi Ghosh

Principal Consultant

Talk to Analyst

Find your sweet spots for generating winning opportunities in this market.

List of Charts

Figure 1: Global Market Value (US$ Bn) by Application, 2022-2032

Figure 2: Global Market Value (US$ Bn) by Region, 2022-2032

Figure 3: Global Market Value (US$ Bn) Analysis by Region, 2017-2032

Figure 4: Global Market Volume (Tons) Analysis by Region, 2017-2032

Figure 5: Global Market Value Share (%) and BPS Analysis by Region, 2022-2032

Figure 6: Global Market Y-o-Y Growth (%) Projections by Region, 2022-2032

Figure 7: Global Market Value (US$ Bn) Analysis by Application, 2017-2032

Figure 8: Global Market Volume (Tons) Analysis by Application, 2017-2032

Figure 9: Global Market Value Share (%) and BPS Analysis by Application, 2022-2032

Figure 10: Global Market Y-o-Y Growth (%) Projections by Application, 2022-2032

Figure 11: Global Market Attractiveness by Application, 2022-2032

Figure 12: Global Market Attractiveness by Region, 2022-2032

Figure 13: North America Market Value (US$ Bn) by Application, 2022-2032

Figure 14: North America Market Value (US$ Bn) by Country, 2022-2032

Figure 15: North America Market Value (US$ Bn) Analysis by Country, 2017-2032

Figure 16: North America Market Volume (Tons) Analysis by Country, 2017-2032

Figure 17: North America Market Value Share (%) and BPS Analysis by Country, 2022-2032

Figure 18: North America Market Y-o-Y Growth (%) Projections by Country, 2022-2032

Figure 19: North America Market Value (US$ Bn) Analysis by Application, 2017-2032

Figure 20: North America Market Volume (Tons) Analysis by Application, 2017-2032

Figure 21: North America Market Value Share (%) and BPS Analysis by Application, 2022-2032

Figure 22: North America Market Y-o-Y Growth (%) Projections by Application, 2022-2032

Figure 23: North America Market Attractiveness by Application, 2022-2032

Figure 24: North America Market Attractiveness by Country, 2022-2032

Figure 25: Latin America Market Value (US$ Bn) by Application, 2022-2032

Figure 26: Latin America Market Value (US$ Bn) by Country, 2022-2032

Figure 27: Latin America Market Value (US$ Bn) Analysis by Country, 2017-2032

Figure 28: Latin America Market Volume (Tons) Analysis by Country, 2017-2032

Figure 29: Latin America Market Value Share (%) and BPS Analysis by Country, 2022-2032

Figure 30: Latin America Market Y-o-Y Growth (%) Projections by Country, 2022-2032

Figure 31: Latin America Market Value (US$ Bn) Analysis by Application, 2017-2032

Figure 32: Latin America Market Volume (Tons) Analysis by Application, 2017-2032

Figure 33: Latin America Market Value Share (%) and BPS Analysis by Application, 2022-2032

Figure 34: Latin America Market Y-o-Y Growth (%) Projections by Application, 2022-2032

Figure 35: Latin America Market Attractiveness by Application, 2022-2032

Figure 36: Latin America Market Attractiveness by Country, 2022-2032

Figure 37: Europe Market Value (US$ Bn) by Application, 2022-2032

Figure 38: Europe Market Value (US$ Bn) by Country, 2022-2032

Figure 39: Europe Market Value (US$ Bn) Analysis by Country, 2017-2032

Figure 40: Europe Market Volume (Tons) Analysis by Country, 2017-2032

Figure 41: Europe Market Value Share (%) and BPS Analysis by Country, 2022-2032

Figure 42: Europe Market Y-o-Y Growth (%) Projections by Country, 2022-2032

Figure 43: Europe Market Value (US$ Bn) Analysis by Application, 2017-2032

Figure 44: Europe Market Volume (Tons) Analysis by Application, 2017-2032

Figure 45: Europe Market Value Share (%) and BPS Analysis by Application, 2022-2032

Figure 46: Europe Market Y-o-Y Growth (%) Projections by Application, 2022-2032

Figure 47: Europe Market Attractiveness by Application, 2022-2032

Figure 48: Europe Market Attractiveness by Country, 2022-2032

Figure 49: Asia Pacific Market Value (US$ Bn) by Application, 2022-2032

Figure 50: Asia Pacific Market Value (US$ Bn) by Country, 2022-2032

Figure 51: Asia Pacific Market Value (US$ Bn) Analysis by Country, 2017-2032

Figure 52: Asia Pacific Market Volume (Tons) Analysis by Country, 2017-2032

Figure 53: Asia Pacific Market Value Share (%) and BPS Analysis by Country, 2022-2032

Figure 54: Asia Pacific Market Y-o-Y Growth (%) Projections by Country, 2022-2032

Figure 55: Asia Pacific Market Value (US$ Bn) Analysis by Application, 2017-2032

Figure 56: Asia Pacific Market Volume (Tons) Analysis by Application, 2017-2032

Figure 57: Asia Pacific Market Value Share (%) and BPS Analysis by Application, 2022-2032

Figure 58: Asia Pacific Market Y-o-Y Growth (%) Projections by Application, 2022-2032

Figure 59: Asia Pacific Market Attractiveness by Application, 2022-2032

Figure 60: Asia Pacific Market Attractiveness by Country, 2022-2032

Figure 61: MEA Market Value (US$ Bn) by Application, 2022-2032

Figure 62: MEA Market Value (US$ Bn) by Country, 2022-2032

Figure 63: MEA Market Value (US$ Bn) Analysis by Country, 2017-2032

Figure 64: MEA Market Volume (Tons) Analysis by Country, 2017-2032

Figure 65: MEA Market Value Share (%) and BPS Analysis by Country, 2022-2032

Figure 66: MEA Market Y-o-Y Growth (%) Projections by Country, 2022-2032

Figure 67: MEA Market Value (US$ Bn) Analysis by Application, 2017-2032

Figure 68: MEA Market Volume (Tons) Analysis by Application, 2017-2032

Figure 69: MEA Market Value Share (%) and BPS Analysis by Application, 2022-2032

Figure 70: MEA Market Y-o-Y Growth (%) Projections by Application, 2022-2032

Figure 71: MEA Market Attractiveness by Application, 2022-2032

Figure 72: MEA Market Attractiveness by Country, 2022-2032

Recommendations

Healthcare

Medical Automation Market

Published : October 2023

Healthcare

Medical Waste Management System Market

Published : June 2023

Healthcare

Medical Cyclotron Market

Published : June 2022

Explore Healthcare Insights

View Reports

Medical Polyetheretherketone Market