Medical Supplies Market Size, Share, and Forecast Outlook 2025 to 2035

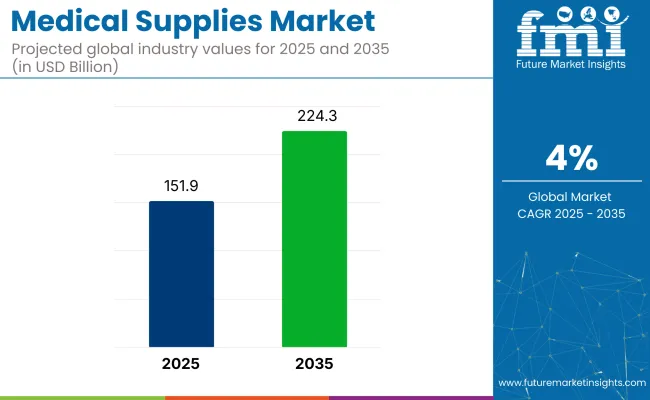
The medical supplies market is projected to grow from USD 151.9 billion in 2025 to USD 224.3 billion by 2035, reflecting a CAGR of 4% over the forecast period. Consistent hospital demand, rising outpatient care, and continued investment in diagnostic laboratories are key enablers of this growth.
Quick Stats of the Medical Supplies Market

  • Industry Value (2025): USD 151.9 billion
  • Industry Forecast Value (2035): USD 224.3 billion
  • Forecast CAGR: 4%
  • Leading Segment in 2035: Pulp & Paper (~43.6% share)
  • Key Growth Region: America (United States)
  • Key Players: Medtronic, Johnson & Johnson MedTech, Abbott Laboratories, Siemens Healthineers, Medline Industries

Medical Supplies Market

Global supply chains have become more resilient following COVID-19 disruptions, prompting greater emphasis on stockpiling essential supplies, particularly personal protective equipment (PPE), sterilization consumables, and diagnostic kits.

Innovations in material science, infection-resistant coatings, and single-use devices are transforming how suppliers serve hospitals, clinics, and specialty care centers. Companies like Medtronic, BD, and Cardinal Health are leading investment in new sterilization technologies and integrated delivery systems to reduce the risk of hospital-acquired infections.

The industry holds a significant but specialized share within its parent markets. In the healthcare market, it accounts for approximately 5-7%, as medical supplies are critical to healthcare delivery, but they represent just one aspect of the broader healthcare sector.

Within the pharmaceuticals market, the share is around 2-3%, with supplies like IV sets and drug delivery devices being used alongside pharmaceuticals. In the medical devices market, its share is approximately 8-10%, as these supplies complement devices like diagnostic instruments and surgical tools.

Within the hospital supplies market, the share is higher, around 15-20%, as hospitals rely heavily on medical consumables and disposables. In the laboratory equipment and supplies market, the share is around 6-8%, with these supplies supporting diagnostic testing and research.

Analyzing Medical Supplies Market by Top Investment Segments

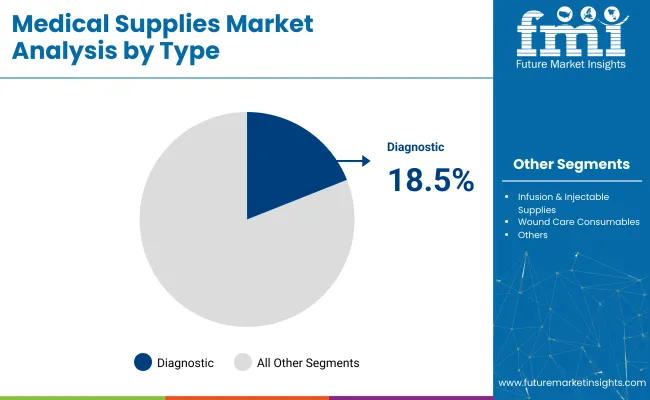
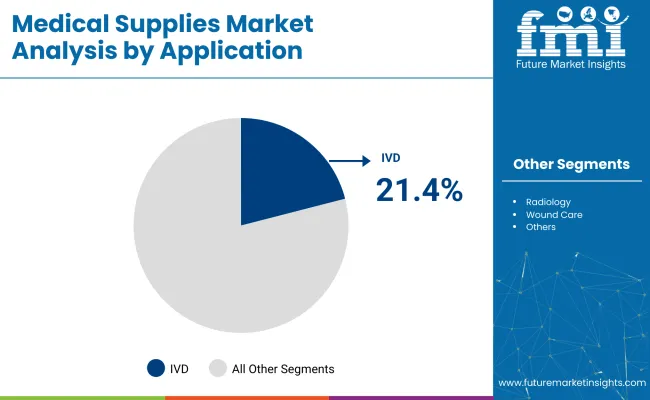
The industry is experiencing growth, driven by diagnostic innovation and infection control needs. Diagnostic supplies are expected to lead the product segment with 18.5% industry share, while in vitro diagnostics (IVD) will dominate the application segment with 21.4% industry share in 2025.

Diagnostic Supplies lead product type segment in 2025

Diagnostic supplies are expected to capture 18.5% of the global industry in 2025. This category includes test kits, reagents, and consumables commonly used in hospitals, laboratories, and point-of-care settings. The segment’s growth is driven by the increasing demand for early disease detection, particularly for infectious diseases, cancer, and chronic conditions.

Companies such as Thermo Fisher Scientific, Abbott, and Roche Diagnostics are expanding their offerings through R&D and strategic distribution deals. Thermo Fisher's launch of faster immunoassay kits for respiratory virus detection in 2024 reflects ongoing innovation. Government programs in regions like India, China, and Latin America are promoting the adoption of rapid diagnostic tests.
  • Key drivers include the need for early detection of infectious diseases and chronic conditions
  • Companies expanding offerings through R&D and distribution agreements
  • Government programs in emerging industries supporting rapid test adoption

Medical Supplies Market Analysis By Type

IVD dominates the application segment with 21.4% industry share in 2025

In vitro diagnostics (IVD) are projected to capture 21.4% of the industry share in 2025, reflecting their critical role in modern healthcare. IVD tools are essential for identifying infections, metabolic disorders, and cancer, and their adoption has increased post-COVID-19, driven by the rise in preventive screening and home testing.

Companies like BD, Siemens Healthineers, and Bio-Rad are expanding their molecular and immunoassay portfolios to meet growing demand. National health programs in countries like India, South Korea, and the United Kingdom are funding decentralized diagnostic systems. Hospitals are integrating IVD tools into both centralized labs and near-patient settings, while mobile diagnostics and wearable health tools are accelerating data-driven healthcare.
  • Post-COVID-19 surge in preventive screening and home testing
  • National health programs supporting decentralized diagnostic systems
  • Mobile diagnostics and wearables further drive data-driven healthcare

Medical Supplies Market Analysis By Application

Top Medical Supplies Market Dynamics

The industry is growing due to the rising prevalence of chronic and infectious diseases, driving demand for advanced diagnostic and treatment products. However, challenges such as regulatory complexities, supply chain instability, and high operational costs are hindering industry expansion, particularly for smaller firms.

Rising Disease Prevalence and Diagnostic Investments Driving Industry Growth

The industry is expanding due to the increasing global burden of chronic and infectious diseases, which is driving higher demand for advanced medical supplies. Diagnostics, wound care, and infusion products are in high demand, fueled by early screening and surgical procedures.

Governments are investing in diagnostic laboratories and decentralized testing, particularly in rural areas. Companies like Medtronic, BD, and Thermo Fisher are enhancing R&D for faster, more accurate products, further supporting industry growth through advancements in digital integration and AI-assisted diagnostics.

  • Rising prevalence of chronic and infectious diseases is increasing demand for these supplies.
  • Diagnostic and wound care products are in high demand, driven by early screening and surgical procedures.
  • Increased government funding and private-sector innovation are enhancing diagnostic capabilities.

Supply Chain Constraints and Compliance Complexity Restrain Industry Expansion

Despite strong demand, the industry is constrained by supply chain instability and regulatory complexities. Compliance with varying regional standards, such as those from the FDA, EMA, and CDSCO, often leads to delayed product approvals and higher operational costs.

Fluctuations in raw material costs and reliance on imported components contribute to price instability and inventory gaps. Smaller manufacturers face difficulties in scaling due to tight profit margins and fragmented supply systems, which slow down the availability of essential supplies in underserved regions.
  • Compliance with diverse regional medical standards delays approvals and raises costs.
  • Raw material price fluctuations and reliance on imports lead to supply chain instability.
  • Smaller firms struggle to scale due to high operational costs and fragmented supply systems.

Analyzing Top Countries Expanding, Distributing, and Utilizing Medical Supplies

Country Wise Analysis Of Medical Supplies Market Cagr 2025 To 2035

Countries CAGR (2025 to 2035)
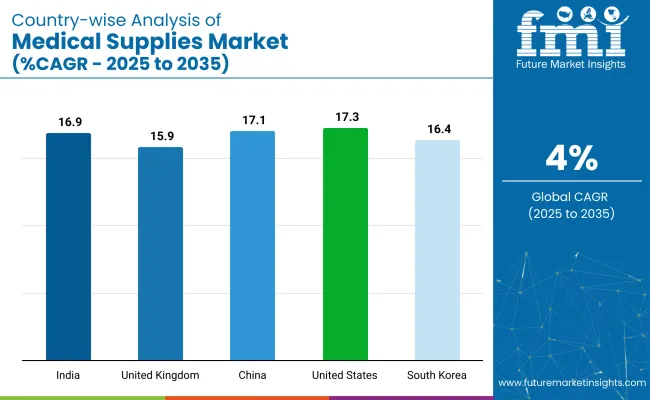
United States 17.3%
United Kingdom 15.9%
China 17.1%
India 16.9%
South Korea 16.4%

The industry demand is projected to rise at a 4% CAGR from 2025 to 2035. Of the five profiled countries out of 40 covered, the United States leads at 17.3%, followed by China at 17.1% and India at 16.9%, while the United Kingdom records 15.9% and South Korea posts 16.4%.

These rates translate to a growth premium of +333% for the United States, +328% for China, and +322% for India versus the baseline, while South Korea and the United Kingdom show strong but slightly slower growth.

Divergence reflects local catalysts: robust healthcare spending and technological advancements in the United States, increasing demand for these supplies driven by a growing population in China and India, and continued healthcare modernization and infrastructure development in South Korea and the UK

Growth Analysis of Medical Supplies Market in the United States

The industry in the United States is set to record a CAGR of 17.3% through 2035. High-volume procurement and next-gen innovation define industry expansion, supported by robust healthcare infrastructure and federal-level strategic stockpiling. Companies such as 3M, Medtronic, and Stryker dominate supply of PPE, infusion kits, and infection control products across hospitals and outpatient networks.

In 2024, Cardinal Health invested USD 150 million to expand PPE manufacturing in Ohio. AI-integrated diagnostics and remote monitoring tools are increasingly deployed in private healthcare settings. A strong regulatory framework allows rapid industry access for advanced consumables, positioning the USA as a hub for smart, compliant medical technologies.

  • FDA fast-tracks accelerate the rollout of novel wearable diagnostics and AI-enabled testing tools.
  • Government contracts under HHS support long-term demand for sterilization and emergency response gear.
  • Telemedicine-linked supply chains favor home-delivery models for wound care and consumables.

Future Outlook for Medical Supplies Market in the United Kingdom

Sales of medical supplies in the United Kingdom are projected to grow at a CAGR of 15.9% through 2035. NHS reform, procurement decentralization, and diagnostic innovation are key growth drivers. Companies like ConvaTec and Smith & Nephew are scaling recyclable, single-use devices that meet carbon-reduction mandates.

In 2024, BD expanded diagnostic manufacturing in the UK to address rising demand in cancer screening. NHS supply frameworks now encourage participation from SMEs offering digital supply tracking and predictive inventory tools. The Life Sciences Vision program is guiding biosensor rollout and at-home diagnostic access across regional care systems.

  • Ecological requirements mandate the use of low-impact materials in sterile packaging.
  • SME access to NHS procurement portals is expanding the supplier base for diagnostics.
  • Home testing kits are being reimbursed for chronic disease monitoring under public health pilots.

Demand Forecast for Medical Supplies Market in China

Demand for medical supplies in China is estimated to grow at a CAGR of 17.1% through 2035. Large-scale domestic manufacturing, MIIT-backed policy, and e-health expansion are shaping China’s rise as both a consumer and exporter of compliant medical consumables.

Firms like Mindray, Weigao, and Lepu Medical are investing in automated production of surgical kits, IVDs, and wound care items. Public-sector investment in rural health infrastructure is stimulating demand for low-cost, compliant supplies. Growth in online pharmacy platforms has fueled uptake of wearable respiratory and home-use devices. Cold-chain and smart-distribution systems are being scaled to manage biologics and temperature-sensitive kits.

  • MIIT’s 2024 policy expanded licensing access for Class III consumables and IVD exports.
  • Tier 3 hospitals are prioritizing locally produced surgical and diagnostic kits under provincial mandates.
  • Cross-border e-commerce drives global sales of ISO-aligned Chinese wound care brands.

Analysis of Medical Supplies Market in India

The industry in India is projected to grow at a CAGR of 16.9% through 2035. Policy-backed manufacturing incentives and rising healthcare access are driving category expansion. Under the PLI scheme, local firms such as Poly Medicure and Trivitron Healthcare are scaling catheter, dialysis, and PPE production.

In 2025, the Ministry of Health launched a national diagnostics push targeting rural IVD integration. Digital programs like Ayushman Bharat and NDHM are incorporating consumables into e-claims frameworks. Low-cost respiratory and infection control items are being positioned for both domestic and export industries, making India a scalable and cost-effective global source.

  • IVD expansion schemes target health-center integration across tier-2 and tier-3 rural belts.
  • PLI grants incentivize backward integration of wound dressing and sterilization material inputs.
  • AI-based screening platforms now bundle test kits for decentralized diagnostics distribution.

Medical Supplies Market Growth Outlook in South Korea

Sales of medical supplies in South Korea are forecasted to grow at a CAGR of 16.4% through 2035. Digital innovation and global regulatory alignment are key industry enablers. Seegene, Osang Healthcare, and JW Medical are developing cloud-enabled diagnostics and robotic consumables.

In 2024, public funding supported production of smart wound dressings and home self-testing kits. Hospitals are integrating automated inventory systems with EMRs to improve procurement accuracy. South Korea’s exports of CE- and FDA-compliant surgical kits, radiology disposables, and lab reagents are expanding across Southeast Asia and the Middle East.

  • Ministry-backed trials are validating digital wound-care tools with real-time healing analytics.
  • Surgical consumables exported under CE registration are gaining traction in Gulf and ASEAN markets.
  • Robotics-linked diagnostics and consumable packaging are reducing hospital labor strain.

Leading Medical Supplies Suppliers

Leading Company - Medtronic Industry Share - 12%
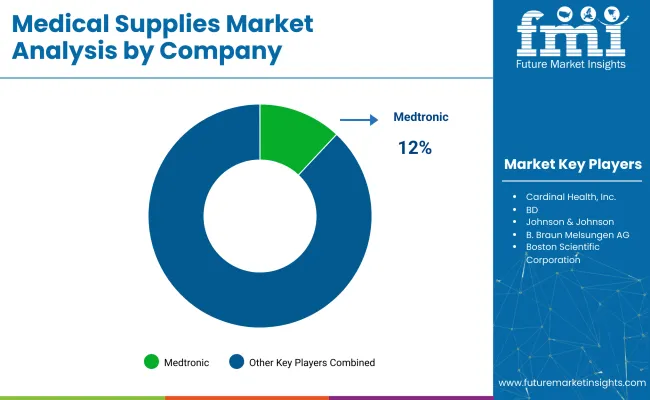
Medical Supplies Market Analysis By Company

The global industry features a competitive landscape with dominant players, key players, and emerging players. Dominant players such as Medtronic, Johnson & Johnson, and Baxter International lead the industry with extensive product portfolios, strong R&D capabilities, and robust distribution networks across healthcare, diagnostics, and surgical sectors.

Key players including B. Braun Melsungen AG, Boston Scientific Corporation, and Thermo Fisher Scientific offer specialized solutions tailored to specific applications and regional industries. Emerging players, such as Avanos Medical, ConvaTec Group Plc., and Fresenius Medical Care, focus on innovative technologies and cost-effective solutions, expanding their presence in the global industry.

Recent Industry News

  • In November 2024, Medline Industries confidentially filed for a USD 5 billion IPO, potentially valuing the company at USD 50 billion. This move highlights the company’s financial growth and its efforts to expand its industry presence in the sector.
  • In May 2025, Boston Scientific CEO Michael Mahoney emphasized the company's success, stating, “We’ve built a medical technology company that leads through investment, agility, and purpose.” This statement followed the company’s impressive revenue growth to USD 16.7 billion from USD 7.3 billion in 2012.
  • In May 2025, Zimmer Biomet revised its 2025 profit outlook, citing cost pressures and the ongoing integration of the Paragon 28 acquisition. This adjustment underscores the company’s focus on managing costs and integrating new acquisitions within the competitive industry.

Report Scope of the Medical Supplies Market

Report Attributes Details
Current Total Industry Size (2025) USD 151.9 billion
Projected Industry Size (2035) USD 224.3 billion
CAGR (2025 to 2035) 4%
Base Year for Estimation 2024
Historical Period 2020 to 2024
Projections Period 2025 to 2035
Quantitative Units USD billion for value and million units for volume
Segments Analyzed - By Type Diagnostic Supplies, Infusion & Injectable Supplies, Disinfectants, PPE, Sterilization Consumables, Wound Care Consumables, Dialysis Consumables, Catheters, Radiology Consumables, Others
Segments Analyzed - By Application Radiology, Wound Care, Cardiology, Urology, Respiratory, Infection Control, IVD, Others
Segments Analyzed - By End User Hospitals, Clinics, Others
Regions Covered North America, Europe, Asia-Pacific, Latin America, the Middle East and Africa
Countries Covered United States, Canada, Mexico, Brazil, Argentina, Germany, France, United Kingdom, Italy, Spain, Netherlands, China, India, Japan, South Korea, Australia, New Zealand, GCC Countries, South Africa
Key Players Influencing the Industry Medtronic, Cardinal Health, Inc., BD, Johnson & Johnson, B. Braun Melsungen AG, Boston Scientific Corporation, Thermo Fisher Scientific, Inc., Baxter International, Inc., Avanos Medical, Inc., 3M, Smith & Nephew, ConvaTec Group Plc., Abbott, Teleflex Incorporated, Fresenius Medical Care AG & Co. KGaA, Coloplast Group, Cook Medical, Merit Medical Systems, Stryker, Terumo Corporation
Additional Attributes Dollar sales by product type, application, and end user, growing demand for infection control and wound care products, technological advancements in diagnostic and infusion supplies, increasing adoption of digital and automated medical supplies, regulatory impact on safety and quality standards, and demand for eco-friendly medical products.

Key Players of the Medical Supplies Market

  • Medtronic
  • Cardinal Health, Inc.
  • BD
  • Johnson & Johnson
  • B. Braun Melsungen AG
  • Boston Scientific Corporation
  • Thermo Fisher Scientific, Inc.
  • Baxter International, Inc.
  • Avanos Medical, Inc.
  • 3M
  • Smith & Nephew
  • ConvaTec Group Plc.
  • Abbott
  • Teleflex Incorporated
  • Fresenius Medical Care AG & Co. KGaA
  • Coloplast Group
  • Cook Medical
  • Merit Medical Systems
  • Stryker
  • Terumo Corporation

Segments Studied in the Medical Supplies Market

By Type:

The industry is segmented by type into diagnostic supplies, infusion and injectable supplies, disinfectants, personal protective equipment (PPE), sterilization consumables, wound care consumables, dialysis consumables, catheters, radiology consumables, and others.

By Application:

By application, the industry includes radiology, wound care, cardiology, urology, respiratory, infection control, in vitro diagnostics (IVD), and others.

By End User:

In terms of end users, the industry is segmented into hospitals, clinics, and others.

By Region:

The regional analysis covers North America, Europe, Asia-Pacific, Latin America, the Middle East and Africa.

Table of Content

  1. Executive Summary
    • Global Market Outlook
    • Demand-side Trends
    • Supply-side Trends
    • Technology Roadmap Analysis
    • Analysis and Recommendations
  2. Market Overview
    • Market Coverage / Taxonomy
    • Market Definition / Scope / Limitations
  3. Market Background
    • Market Dynamics
      • Drivers
      • Restraints
      • Opportunity
      • Trends
    • Scenario Forecast
      • Demand in Optimistic Scenario
      • Demand in Likely Scenario
      • Demand in Conservative Scenario
    • Opportunity Map Analysis
    • Product Life Cycle Analysis
    • Supply Chain Analysis
      • Supply Side Participants and their Roles
        • Producers
        • Mid-Level Participants (Traders/ Agents/ Brokers)
        • Wholesalers and Distributors
      • Value Added and Value Created at Node in the Supply Chain
      • List of Raw Material Suppliers
      • List of Existing and Potential Buyer’s
    • Investment Feasibility Matrix
    • Value Chain Analysis
      • Profit Margin Analysis
      • Wholesalers and Distributors
      • Retailers
    • PESTLE and Porter’s Analysis
    • Regulatory Landscape
      • By Key Regions
      • By Key Countries
    • Regional Parent Market Outlook
    • Production and Consumption Statistics
    • Import and Export Statistics
  4. Global Market Analysis 2020 to 2024 and Forecast, 2025 to 2035
    • Historical Market Size Value (USD Billion) & Volume (Million Units) Analysis, 2020 to 2024
    • Current and Future Market Size Value (USD Billion) & Volume (Million Units) Projections, 2025 to 2035
      • Y-o-Y Growth Trend Analysis
      • Absolute $ Opportunity Analysis
  5. Global Market Pricing Analysis 2020 to 2024 and Forecast 2025 to 2035
  6. Global Market Analysis 2020 to 2024 and Forecast 2025 to 2035, By Type
    • Introduction / Key Findings
    • Historical Market Size Value (USD Billion) & Volume (Million Units) Analysis By Type, 2020 to 2024
    • Current and Future Market Size Value (USD Billion) & Volume (Million Units) Analysis and Forecast By Type, 2025 to 2035
      • Diagnostic Supplies
      • Infusion & Injectable Supplies
      • Disinfectants
      • PPE
      • Sterilization Consumables
      • Wound Care Consumables
      • Dialysis Consumables
      • Catheters
      • Radiology Consumables
      • Others
    • Y-o-Y Growth Trend Analysis By Type, 2020 to 2024
    • Absolute $ Opportunity Analysis By Type, 2025 to 2035
  7. Global Market Analysis 2020 to 2024 and Forecast 2025 to 2035, By Application
    • Introduction / Key Findings
    • Historical Market Size Value (USD Billion) & Volume (Million Units) Analysis By Application, 2020 to 2024
    • Current and Future Market Size Value (USD Billion) & Volume (Million Units) Analysis and Forecast By Application, 2025 to 2035
      • Radiology
      • Wound Care
      • Cardiology
      • Urology
      • Respiratory
      • Infection Control
      • IVD
      • Others
    • Y-o-Y Growth Trend Analysis By Application, 2020 to 2024
    • Absolute $ Opportunity Analysis By Application, 2025 to 2035
  8. Global Market Analysis 2020 to 2024 and Forecast 2025 to 2035, By End User
    • Introduction / Key Findings
    • Historical Market Size Value (USD Billion) & Volume (Million Units) Analysis By End User, 2020 to 2024
    • Current and Future Market Size Value (USD Billion) & Volume (Million Units) Analysis and Forecast By End User, 2025 to 2035
      • Hospitals
      • Clinics
      • Others
    • Y-o-Y Growth Trend Analysis By End User, 2020 to 2024
    • Absolute $ Opportunity Analysis By End User, 2025 to 2035
  9. Global Market Analysis 2020 to 2024 and Forecast 2025 to 2035, By Region
    • Introduction
    • Historical Market Size Value (USD Billion) & Volume (Million Units) Analysis By Region, 2020 to 2024
    • Current Market Size Value (USD Billion) & Volume (Million Units) Analysis and Forecast By Region, 2025 to 2035
      • North America
      • Latin America
      • Western Europe
      • Eastern Europe
      • East Asia
      • South Asia & Pacific
      • Middle East and Africa
    • Market Attractiveness Analysis By Region
  10. North America Market Analysis 2020 to 2024 and Forecast 2025 to 2035, By Country
    • Historical Market Size Value (USD Billion) & Volume (Million Units) Trend Analysis By Market Taxonomy, 2020 to 2024
    • Market Size Value (USD Billion) & Volume (Million Units) Forecast By Market Taxonomy, 2025 to 2035
      • By Country
        • USA
        • Canada
        • Mexico
      • By Type
      • By Application
      • By End User
    • Market Attractiveness Analysis
      • By Country
      • By Type
      • By Application
      • By End User
    • Key Takeaways
  11. Latin America Market Analysis 2020 to 2024 and Forecast 2025 to 2035, By Country
    • Historical Market Size Value (USD Billion) & Volume (Million Units) Trend Analysis By Market Taxonomy, 2020 to 2024
    • Market Size Value (USD Billion) & Volume (Million Units) Forecast By Market Taxonomy, 2025 to 2035
      • By Country
        • Brazil
        • Argentina
        • Rest of LATAM
      • By Type
      • By Application
      • By End User
    • Market Attractiveness Analysis
      • By Country
      • By Type
      • By Application
      • By End User
    • Key Takeaways
  12. Western Europe Market Analysis 2020 to 2024 and Forecast 2025 to 2035, By Country
    • Historical Market Size Value (USD Billion) & Volume (Million Units) Trend Analysis By Market Taxonomy, 2020 to 2024
    • Market Size Value (USD Billion) & Volume (Million Units) Forecast By Market Taxonomy, 2025 to 2035
      • By Country
        • Germany
        • Italy
        • France
        • UK
        • Spain
        • BENELUX
        • Nordic
        • Rest of W.Europe
      • By Type
      • By Application
      • By End User
    • Market Attractiveness Analysis
      • By Country
      • By Type
      • By Application
      • By End User
    • Key Takeaways
  13. Eastern Europe Market Analysis 2020 to 2024 and Forecast 2025 to 2035, By Country
    • Historical Market Size Value (USD Billion) & Volume (Million Units) Trend Analysis By Market Taxonomy, 2020 to 2024
    • Market Size Value (USD Billion) & Volume (Million Units) Forecast By Market Taxonomy, 2025 to 2035
      • By Country
        • Russia
        • Hungary
        • Poland
        • Balkan & Baltics
        • Rest of E. Europe
      • By Type
      • By Application
      • By End User
    • Market Attractiveness Analysis
      • By Country
      • By Type
      • By Application
      • By End User
    • Key Takeaways
  14. East Asia Market Analysis 2020 to 2024 and Forecast 2025 to 2035, By Country
    • Historical Market Size Value (USD Billion) & Volume (Million Units) Trend Analysis By Market Taxonomy, 2020 to 2024
    • Market Size Value (USD Billion) & Volume (Million Units) Forecast By Market Taxonomy, 2025 to 2035
      • By Country
        • China
        • Japan
        • South Korea
      • By Type
      • By Application
      • By End User
    • Market Attractiveness Analysis
      • By Country
      • By Type
      • By Application
      • By End User
    • Key Takeaways
  15. South Asia & Pacific Market Analysis 2020 to 2024 and Forecast 2025 to 2035, By Country
    • Historical Market Size Value (USD Billion) & Volume (Million Units) Trend Analysis By Market Taxonomy, 2020 to 2024
    • Market Size Value (USD Billion) & Volume (Million Units) Forecast By Market Taxonomy, 2025 to 2035
      • By Country
        • India
        • Australia & New Zealand
        • ASEAN
        • Rest of SAP
      • By Type
      • By Application
      • By End User
    • Market Attractiveness Analysis
      • By Country
      • By Type
      • By Application
      • By End User
    • Key Takeaways
  16. Middle East and Africa Market Analysis 2020 to 2024 and Forecast 2025 to 2035, By Country
    • Historical Market Size Value (USD Billion) & Volume (Million Units) Trend Analysis By Market Taxonomy, 2020 to 2024
    • Market Size Value (USD Billion) & Volume (Million Units) Forecast By Market Taxonomy, 2025 to 2035
      • By Country
        • GCC Countries
        • Northern Africa
        • South Africa
        • Turkiye
        • Rest of MEA
      • By Type
      • By Application
      • By End User
    • Market Attractiveness Analysis
      • By Country
      • By Type
      • By Application
      • By End User
    • Key Takeaways
  17. Key Countries Market Analysis
    • USA
      • Pricing Analysis
      • Market Share Analysis, 2024
        • By Type
        • By Application
        • By End User
    • Canada
      • Pricing Analysis
      • Market Share Analysis, 2024
        • By Type
        • By Application
        • By End User
    • Brazil
      • Pricing Analysis
      • Market Share Analysis, 2024
        • By Type
        • By Application
        • By End User
    • Mexico
      • Pricing Analysis
      • Market Share Analysis, 2024
        • By Type
        • By Application
        • By End User
    • Argentina
      • Pricing Analysis
      • Market Share Analysis, 2024
        • By Type
        • By Application
        • By End User
  18. Market Structure Analysis
    • Competition Dashboard
    • Competition Benchmarking
    • Market Share Analysis of Top Players
      • By Regional
      • By Type
      • By Application
      • By End User
  19. Competition Analysis
    • Competition Deep Dive
      • Medtronic
        • Overview
        • Product Portfolio
        • Profitability by Market Segments (Product/Age /Sales Channel/Region)
        • Sales Footprint
        • Strategy Overview
          • Marketing Strategy
          • Product Strategy
          • Channel Strategy
      • Cardinal Health, Inc.
        • Overview
        • Product Portfolio
        • Profitability by Market Segments (Product/Age /Sales Channel/Region)
        • Sales Footprint
        • Strategy Overview
          • Marketing Strategy
          • Product Strategy
          • Channel Strategy
      • BD
        • Overview
        • Product Portfolio
        • Profitability by Market Segments (Product/Age /Sales Channel/Region)
        • Sales Footprint
        • Strategy Overview
          • Marketing Strategy
          • Product Strategy
          • Channel Strategy
      • Johnson & Johnson
        • Overview
        • Product Portfolio
        • Profitability by Market Segments (Product/Age /Sales Channel/Region)
        • Sales Footprint
        • Strategy Overview
          • Marketing Strategy
          • Product Strategy
          • Channel Strategy
      • B. Braun Melsungen AG
        • Overview
        • Product Portfolio
        • Profitability by Market Segments (Product/Age /Sales Channel/Region)
        • Sales Footprint
        • Strategy Overview
          • Marketing Strategy
          • Product Strategy
          • Channel Strategy
      • Boston Scientific Corporation
        • Overview
        • Product Portfolio
        • Profitability by Market Segments (Product/Age /Sales Channel/Region)
        • Sales Footprint
        • Strategy Overview
          • Marketing Strategy
          • Product Strategy
          • Channel Strategy
      • Thermo Fisher Scientific, Inc.
        • Overview
        • Product Portfolio
        • Profitability by Market Segments (Product/Age /Sales Channel/Region)
        • Sales Footprint
        • Strategy Overview
          • Marketing Strategy
          • Product Strategy
          • Channel Strategy
      • Baxter International, Inc.
        • Overview
        • Product Portfolio
        • Profitability by Market Segments (Product/Age /Sales Channel/Region)
        • Sales Footprint
        • Strategy Overview
          • Marketing Strategy
          • Product Strategy
          • Channel Strategy
      • Avanos Medical, Inc.
        • Overview
        • Product Portfolio
        • Profitability by Market Segments (Product/Age /Sales Channel/Region)
        • Sales Footprint
        • Strategy Overview
          • Marketing Strategy
          • Product Strategy
          • Channel Strategy
      • 3M
        • Overview
        • Product Portfolio
        • Profitability by Market Segments (Product/Age /Sales Channel/Region)
        • Sales Footprint
        • Strategy Overview
          • Marketing Strategy
          • Product Strategy
          • Channel Strategy
      • Smith & Nephew
        • Overview
        • Product Portfolio
        • Profitability by Market Segments (Product/Age /Sales Channel/Region)
        • Sales Footprint
        • Strategy Overview
          • Marketing Strategy
          • Product Strategy
          • Channel Strategy
      • ConvaTec Group Plc.
        • Overview
        • Product Portfolio
        • Profitability by Market Segments (Product/Age /Sales Channel/Region)
        • Sales Footprint
        • Strategy Overview
          • Marketing Strategy
          • Product Strategy
          • Channel Strategy
      • Abbott
        • Overview
        • Product Portfolio
        • Profitability by Market Segments (Product/Age /Sales Channel/Region)
        • Sales Footprint
        • Strategy Overview
          • Marketing Strategy
          • Product Strategy
          • Channel Strategy
      • Teleflex Incorporated
        • Overview
        • Product Portfolio
        • Profitability by Market Segments (Product/Age /Sales Channel/Region)
        • Sales Footprint
        • Strategy Overview
          • Marketing Strategy
          • Product Strategy
          • Channel Strategy
      • Fresenius Medical Care AG & Co. KGaA
        • Overview
        • Product Portfolio
        • Profitability by Market Segments (Product/Age /Sales Channel/Region)
        • Sales Footprint
        • Strategy Overview
          • Marketing Strategy
          • Product Strategy
          • Channel Strategy
      • Coloplast Group
        • Overview
        • Product Portfolio
        • Profitability by Market Segments (Product/Age /Sales Channel/Region)
        • Sales Footprint
        • Strategy Overview
          • Marketing Strategy
          • Product Strategy
          • Channel Strategy
      • Cook Medical
        • Overview
        • Product Portfolio
        • Profitability by Market Segments (Product/Age /Sales Channel/Region)
        • Sales Footprint
        • Strategy Overview
          • Marketing Strategy
          • Product Strategy
          • Channel Strategy
      • Merit Medical Systems
        • Overview
        • Product Portfolio
        • Profitability by Market Segments (Product/Age /Sales Channel/Region)
        • Sales Footprint
        • Strategy Overview
          • Marketing Strategy
          • Product Strategy
          • Channel Strategy
      • Stryker
        • Overview
        • Product Portfolio
        • Profitability by Market Segments (Product/Age /Sales Channel/Region)
        • Sales Footprint
        • Strategy Overview
          • Marketing Strategy
          • Product Strategy
          • Channel Strategy
      • Terumo Corporation
        • Overview
        • Product Portfolio
        • Profitability by Market Segments (Product/Age /Sales Channel/Region)
        • Sales Footprint
        • Strategy Overview
          • Marketing Strategy
          • Product Strategy
          • Channel Strategy
  20. Assumptions & Acronyms Used
  21. Research Methodology

List of Tables

  • Table 1: Global Market Value (USD Billion) Forecast by Region, 2020 to 2035
  • Table 2: Global Market Volume (Million Units) Forecast by Region, 2020 to 2035
  • Table 3: Global Market Value (USD Billion) Forecast by Type, 2020 to 2035
  • Table 4: Global Market Volume (Million Units) Forecast by Type, 2020 to 2035
  • Table 5: Global Market Value (USD Billion) Forecast by Application, 2020 to 2035
  • Table 6: Global Market Volume (Million Units) Forecast by Application, 2020 to 2035
  • Table 7: Global Market Value (USD Billion) Forecast by End User, 2020 to 2035
  • Table 8: Global Market Volume (Million Units) Forecast by End User, 2020 to 2035
  • Table 9: North America Market Value (USD Billion) Forecast by Country, 2020 to 2035
  • Table 10: North America Market Volume (Million Units) Forecast by Country, 2020 to 2035
  • Table 11: North America Market Value (USD Billion) Forecast by Type, 2020 to 2035
  • Table 12: North America Market Volume (Million Units) Forecast by Type, 2020 to 2035
  • Table 13: North America Market Value (USD Billion) Forecast by Application, 2020 to 2035
  • Table 14: North America Market Volume (Million Units) Forecast by Application, 2020 to 2035
  • Table 15: North America Market Value (USD Billion) Forecast by End User, 2020 to 2035
  • Table 16: North America Market Volume (Million Units) Forecast by End User, 2020 to 2035
  • Table 17: Latin America Market Value (USD Billion) Forecast by Country, 2020 to 2035
  • Table 18: Latin America Market Volume (Million Units) Forecast by Country, 2020 to 2035
  • Table 19: Latin America Market Value (USD Billion) Forecast by Type, 2020 to 2035
  • Table 20: Latin America Market Volume (Million Units) Forecast by Type, 2020 to 2035
  • Table 21: Latin America Market Value (USD Billion) Forecast by Application, 2020 to 2035
  • Table 22: Latin America Market Volume (Million Units) Forecast by Application, 2020 to 2035
  • Table 23: Latin America Market Value (USD Billion) Forecast by End User, 2020 to 2035
  • Table 24: Latin America Market Volume (Million Units) Forecast by End User, 2020 to 2035
  • Table 25: Western Europe Market Value (USD Billion) Forecast by Country, 2020 to 2035
  • Table 26: Western Europe Market Volume (Million Units) Forecast by Country, 2020 to 2035
  • Table 27: Western Europe Market Value (USD Billion) Forecast by Type, 2020 to 2035
  • Table 28: Western Europe Market Volume (Million Units) Forecast by Type, 2020 to 2035
  • Table 29: Western Europe Market Value (USD Billion) Forecast by Application, 2020 to 2035
  • Table 30: Western Europe Market Volume (Million Units) Forecast by Application, 2020 to 2035
  • Table 31: Western Europe Market Value (USD Billion) Forecast by End User, 2020 to 2035
  • Table 32: Western Europe Market Volume (Million Units) Forecast by End User, 2020 to 2035
  • Table 33: Eastern Europe Market Value (USD Billion) Forecast by Country, 2020 to 2035
  • Table 34: Eastern Europe Market Volume (Million Units) Forecast by Country, 2020 to 2035
  • Table 35: Eastern Europe Market Value (USD Billion) Forecast by Type, 2020 to 2035
  • Table 36: Eastern Europe Market Volume (Million Units) Forecast by Type, 2020 to 2035
  • Table 37: Eastern Europe Market Value (USD Billion) Forecast by Application, 2020 to 2035
  • Table 38: Eastern Europe Market Volume (Million Units) Forecast by Application, 2020 to 2035
  • Table 39: Eastern Europe Market Value (USD Billion) Forecast by End User, 2020 to 2035
  • Table 40: Eastern Europe Market Volume (Million Units) Forecast by End User, 2020 to 2035
  • Table 41: East Asia Market Value (USD Billion) Forecast by Country, 2020 to 2035
  • Table 42: East Asia Market Volume (Million Units) Forecast by Country, 2020 to 2035
  • Table 43: East Asia Market Value (USD Billion) Forecast by Type, 2020 to 2035
  • Table 44: East Asia Market Volume (Million Units) Forecast by Type, 2020 to 2035
  • Table 45: East Asia Market Value (USD Billion) Forecast by Application, 2020 to 2035
  • Table 46: East Asia Market Volume (Million Units) Forecast by Application, 2020 to 2035
  • Table 47: East Asia Market Value (USD Billion) Forecast by End User, 2020 to 2035
  • Table 48: East Asia Market Volume (Million Units) Forecast by End User, 2020 to 2035
  • Table 49: South Asia & Pacific Market Value (USD Billion) Forecast by Country, 2020 to 2035
  • Table 50: South Asia & Pacific Market Volume (Million Units) Forecast by Country, 2020 to 2035
  • Table 51: South Asia & Pacific Market Value (USD Billion) Forecast by Type, 2020 to 2035
  • Table 52: South Asia & Pacific Market Volume (Million Units) Forecast by Type, 2020 to 2035
  • Table 53: South Asia & Pacific Market Value (USD Billion) Forecast by Application, 2020 to 2035
  • Table 54: South Asia & Pacific Market Volume (Million Units) Forecast by Application, 2020 to 2035
  • Table 55: South Asia & Pacific Market Value (USD Billion) Forecast by End User, 2020 to 2035
  • Table 56: South Asia & Pacific Market Volume (Million Units) Forecast by End User, 2020 to 2035
  • Table 57: Middle East and Africa Market Value (USD Billion) Forecast by Country, 2020 to 2035
  • Table 58: Middle East and Africa Market Volume (Million Units) Forecast by Country, 2020 to 2035
  • Table 59: Middle East and Africa Market Value (USD Billion) Forecast by Type, 2020 to 2035
  • Table 60: Middle East and Africa Market Volume (Million Units) Forecast by Type, 2020 to 2035
  • Table 61: Middle East and Africa Market Value (USD Billion) Forecast by Application, 2020 to 2035
  • Table 62: Middle East and Africa Market Volume (Million Units) Forecast by Application, 2020 to 2035
  • Table 63: Middle East and Africa Market Value (USD Billion) Forecast by End User, 2020 to 2035
  • Table 64: Middle East and Africa Market Volume (Million Units) Forecast by End User, 2020 to 2035

List of Figures

  • Figure 1: Global Market Volume (Million Units) Forecast 2020 to 2035
  • Figure 2: Global Market Pricing Analysis
  • Figure 3: Global Market Value (USD Billion) Forecast 2020 to 2035
  • Figure 4: Global Market Value Share and BPS Analysis by Type, 2025 and 2035
  • Figure 5: Global Market Y-o-Y Growth Comparison by Type, 2025 to 2035
  • Figure 6: Global Market Attractiveness Analysis by Type
  • Figure 7: Global Market Value Share and BPS Analysis by Application, 2025 and 2035
  • Figure 8: Global Market Y-o-Y Growth Comparison by Application, 2025 to 2035
  • Figure 9: Global Market Attractiveness Analysis by Application
  • Figure 10: Global Market Value Share and BPS Analysis by End User, 2025 and 2035
  • Figure 11: Global Market Y-o-Y Growth Comparison by End User, 2025 to 2035
  • Figure 12: Global Market Attractiveness Analysis by End User
  • Figure 13: Global Market Value (USD Billion) Share and BPS Analysis by Region, 2025 and 2035
  • Figure 14: Global Market Y-o-Y Growth Comparison by Region, 2025 to 2035
  • Figure 15: Global Market Attractiveness Analysis by Region
  • Figure 16: North America Market Incremental $ Opportunity, 2025 to 2035
  • Figure 17: Latin America Market Incremental $ Opportunity, 2025 to 2035
  • Figure 18: Western Europe Market Incremental $ Opportunity, 2025 to 2035
  • Figure 19: Eastern Europe Market Incremental $ Opportunity, 2025 to 2035
  • Figure 20: East Asia Market Incremental $ Opportunity, 2025 to 2035
  • Figure 21: South Asia & Pacific Market Incremental $ Opportunity, 2025 to 2035
  • Figure 22: Middle East and Africa Market Incremental $ Opportunity, 2025 to 2035
  • Figure 23: North America Market Value Share and BPS Analysis by Country, 2025 and 2035
  • Figure 24: North America Market Value Share and BPS Analysis by Type, 2025 and 2035
  • Figure 25: North America Market Y-o-Y Growth Comparison by Type, 2025 to 2035
  • Figure 26: North America Market Attractiveness Analysis by Type
  • Figure 27: North America Market Value Share and BPS Analysis by Application, 2025 and 2035
  • Figure 28: North America Market Y-o-Y Growth Comparison by Application, 2025 to 2035
  • Figure 29: North America Market Attractiveness Analysis by Application
  • Figure 30: North America Market Value Share and BPS Analysis by End User, 2025 and 2035
  • Figure 31: North America Market Y-o-Y Growth Comparison by End User, 2025 to 2035
  • Figure 32: North America Market Attractiveness Analysis by End User
  • Figure 33: Latin America Market Value Share and BPS Analysis by Country, 2025 and 2035
  • Figure 34: Latin America Market Value Share and BPS Analysis by Type, 2025 and 2035
  • Figure 35: Latin America Market Y-o-Y Growth Comparison by Type, 2025 to 2035
  • Figure 36: Latin America Market Attractiveness Analysis by Type
  • Figure 37: Latin America Market Value Share and BPS Analysis by Application, 2025 and 2035
  • Figure 38: Latin America Market Y-o-Y Growth Comparison by Application, 2025 to 2035
  • Figure 39: Latin America Market Attractiveness Analysis by Application
  • Figure 40: Latin America Market Value Share and BPS Analysis by End User, 2025 and 2035
  • Figure 41: Latin America Market Y-o-Y Growth Comparison by End User, 2025 to 2035
  • Figure 42: Latin America Market Attractiveness Analysis by End User
  • Figure 43: Western Europe Market Value Share and BPS Analysis by Country, 2025 and 2035
  • Figure 44: Western Europe Market Value Share and BPS Analysis by Type, 2025 and 2035
  • Figure 45: Western Europe Market Y-o-Y Growth Comparison by Type, 2025 to 2035
  • Figure 46: Western Europe Market Attractiveness Analysis by Type
  • Figure 47: Western Europe Market Value Share and BPS Analysis by Application, 2025 and 2035
  • Figure 48: Western Europe Market Y-o-Y Growth Comparison by Application, 2025 to 2035
  • Figure 49: Western Europe Market Attractiveness Analysis by Application
  • Figure 50: Western Europe Market Value Share and BPS Analysis by End User, 2025 and 2035
  • Figure 51: Western Europe Market Y-o-Y Growth Comparison by End User, 2025 to 2035
  • Figure 52: Western Europe Market Attractiveness Analysis by End User
  • Figure 53: Eastern Europe Market Value Share and BPS Analysis by Country, 2025 and 2035
  • Figure 54: Eastern Europe Market Value Share and BPS Analysis by Type, 2025 and 2035
  • Figure 55: Eastern Europe Market Y-o-Y Growth Comparison by Type, 2025 to 2035
  • Figure 56: Eastern Europe Market Attractiveness Analysis by Type
  • Figure 57: Eastern Europe Market Value Share and BPS Analysis by Application, 2025 and 2035
  • Figure 58: Eastern Europe Market Y-o-Y Growth Comparison by Application, 2025 to 2035
  • Figure 59: Eastern Europe Market Attractiveness Analysis by Application
  • Figure 60: Eastern Europe Market Value Share and BPS Analysis by End User, 2025 and 2035
  • Figure 61: Eastern Europe Market Y-o-Y Growth Comparison by End User, 2025 to 2035
  • Figure 62: Eastern Europe Market Attractiveness Analysis by End User
  • Figure 63: East Asia Market Value Share and BPS Analysis by Country, 2025 and 2035
  • Figure 64: East Asia Market Value Share and BPS Analysis by Type, 2025 and 2035
  • Figure 65: East Asia Market Y-o-Y Growth Comparison by Type, 2025 to 2035
  • Figure 66: East Asia Market Attractiveness Analysis by Type
  • Figure 67: East Asia Market Value Share and BPS Analysis by Application, 2025 and 2035
  • Figure 68: East Asia Market Y-o-Y Growth Comparison by Application, 2025 to 2035
  • Figure 69: East Asia Market Attractiveness Analysis by Application
  • Figure 70: East Asia Market Value Share and BPS Analysis by End User, 2025 and 2035
  • Figure 71: East Asia Market Y-o-Y Growth Comparison by End User, 2025 to 2035
  • Figure 72: East Asia Market Attractiveness Analysis by End User
  • Figure 73: South Asia & Pacific Market Value Share and BPS Analysis by Country, 2025 and 2035
  • Figure 74: South Asia & Pacific Market Value Share and BPS Analysis by Type, 2025 and 2035
  • Figure 75: South Asia & Pacific Market Y-o-Y Growth Comparison by Type, 2025 to 2035
  • Figure 76: South Asia & Pacific Market Attractiveness Analysis by Type
  • Figure 77: South Asia & Pacific Market Value Share and BPS Analysis by Application, 2025 and 2035
  • Figure 78: South Asia & Pacific Market Y-o-Y Growth Comparison by Application, 2025 to 2035
  • Figure 79: South Asia & Pacific Market Attractiveness Analysis by Application
  • Figure 80: South Asia & Pacific Market Value Share and BPS Analysis by End User, 2025 and 2035
  • Figure 81: South Asia & Pacific Market Y-o-Y Growth Comparison by End User, 2025 to 2035
  • Figure 82: South Asia & Pacific Market Attractiveness Analysis by End User
  • Figure 83: Middle East and Africa Market Value Share and BPS Analysis by Country, 2025 and 2035
  • Figure 84: Middle East and Africa Market Value Share and BPS Analysis by Type, 2025 and 2035
  • Figure 85: Middle East and Africa Market Y-o-Y Growth Comparison by Type, 2025 to 2035
  • Figure 86: Middle East and Africa Market Attractiveness Analysis by Type
  • Figure 87: Middle East and Africa Market Value Share and BPS Analysis by Application, 2025 and 2035
  • Figure 88: Middle East and Africa Market Y-o-Y Growth Comparison by Application, 2025 to 2035
  • Figure 89: Middle East and Africa Market Attractiveness Analysis by Application
  • Figure 90: Middle East and Africa Market Value Share and BPS Analysis by End User, 2025 and 2035
  • Figure 91: Middle East and Africa Market Y-o-Y Growth Comparison by End User, 2025 to 2035
  • Figure 92: Middle East and Africa Market Attractiveness Analysis by End User
  • Figure 93: Global Market - Tier Structure Analysis
  • Figure 94: Global Market - Company Share Analysis

Frequently Asked Questions

What is the projected size of the medical supplies market in 2025 and 2035?

The industry size is projected to be USD 151.9 billion in 2025 and USD 224.3 billion by 2035.

What is the expected CAGR for the medical supplies market from 2025 to 2035?

The expected CAGR is 4% from 2025 to 2035.

Which company is the industry leader in medical supplies?

Medtronic is the leading company in the industry with a 12% industry share.

Which segment is expected to dominate the medical supplies market in 2025?

The IVD (In Vitro Diagnostics) segment is expected to dominate with a 21.4% industry share in 2025.

Which country is expected to grow the fastest in the medical supplies market?

The United States is expected to grow the fastest with a projected CAGR of 17.3% from 2025 to 2035.

Explore Similar Insights

Future Market Insights

Medical Supplies Market