Medical Cleaning Devices Market Size and Share Forecast Outlook 2025 to 2035

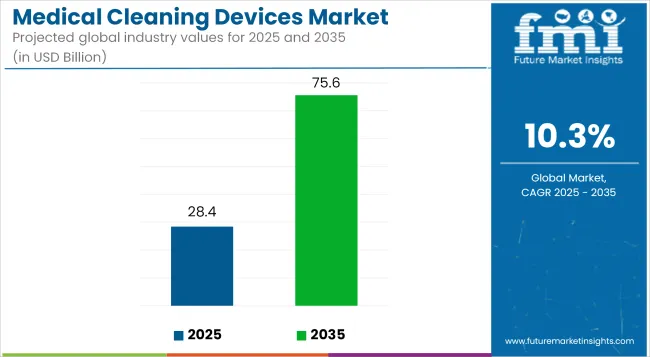
The global medical cleaning devices market is estimated to be valued at USD 28.4 billion in 2025 and is projected to reach USD 75.6 billion by 2035, registering a compound annual growth rate of 10.3% over the forecast period.
Quick Stats for Medical Cleaning Devices Market

  • Industry Value (2025): USD 28.4 billion
  • Forecast Value (2035): USD 75.6 billion
  • Forecast CAGR: 10.3%
  • Leading Segment in 2025: Washer Disinfectors
  • Key Growth Region: Asia-Pacific (China, India, Japan, South Korea)
  • Top Key Players: STERIS plc, Getinge AB, Ecolab Inc., 3M Company, Metrex Research LLC, Ruhof Corporation, Cantel Medical Corporation, Advanced Sterilization Products (ASP), Sklar Surgical Instruments, Oro Clean Chemie AG.

Medical Cleaning Devices Market Industry Value Analysis

Metric Value
Industry Size (2025E) USD 28.4 billion
Industry Value (2035F) USD 75.6 billion
CAGR (2025 to 2035) 10.3%

The Medical Cleaning Devices Market is witnessing steady growth due to rising concerns over hospital-acquired infections (HAIs), stringent regulatory norms, and the global focus on patient safety. Healthcare providers are increasingly adopting advanced cleaning technologies such as washer-disinfectors and endoscope reprocessors to comply with hygiene standards.

Regulatory bodies like the FDA and WHO have intensified pressure on facilities to improve sterilization processes. Additionally, technological advancements such as smart monitoring are enhancing cleaning efficacy and reducing manual effort.

With the ongoing expansion of healthcare infrastructure in both developed and emerging markets, and growing surgical volumes, the demand for reliable, automated cleaning solutions is expected to strengthen, making this market critical to future healthcare delivery and operational excellence.

Analyzing Medical Cleaning Devices Market by Top Investment Segments

Washer Disinfectors Lead the Market Due to Stringent Infection Control Standards in Surgical Settings

Washer disinfectors have emerged as the dominant product type in the medical cleaning devices market, accounting for approximately 41.0% of total revenue in 2025. Their growth has been driven primarily by stringent infection prevention protocols in hospitals and surgical centers. Enhanced global emphasis on surgical site infection (SSI) control has necessitated validated, automated cleaning cycles for reusable instruments.

As a result, washer disinfectors have been widely adopted to meet regulatory benchmarks set by institutions such as the FDA and WHO. Their ability to deliver high thermal disinfection, coupled with standardized and reproducible cleaning outcomes, has been widely favored over manual processes.

The growing volume of minimally invasive surgeries has also necessitated the cleaning of complex, delicate instruments, further reinforcing demand for programmable washer disinfectors. Adoption has also been encouraged by hospital administrators seeking to reduce human error and improve cleaning consistency across departments.
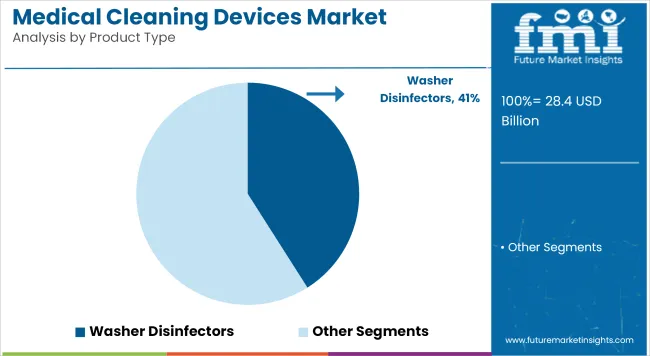
Medical Cleaning Devices Market Analysis By Product Type

Automated Cleaning Systems Dominate the Market Due to Demand for Standardized Sterilization and Labor Efficiency

Automated cleaning systems have held the leading position in the market by technology type, commanding nearly 60.0% of revenue share in 2025. Their dominance has been attributed to the healthcare industry’s shift toward standardized sterilization and operational efficiency. As healthcare infrastructure expands, the need for fast, scalable, and reliable cleaning solutions has intensified, especially in high-volume hospital environments.

Automated systems have been preferred for their ability to reduce reliance on manual labor, mitigate cross-contamination risks, and ensure regulatory compliance. Clinical guidelines favoring validated reprocessing protocols have also reinforced their uptake.

The global labor shortage in healthcare settings has further encouraged medical institutions to invest in automated workflows. As infection control becomes more data-driven, automated cleaning systems have been positioned as indispensable assets for ensuring sterilization accountability and audit readiness.
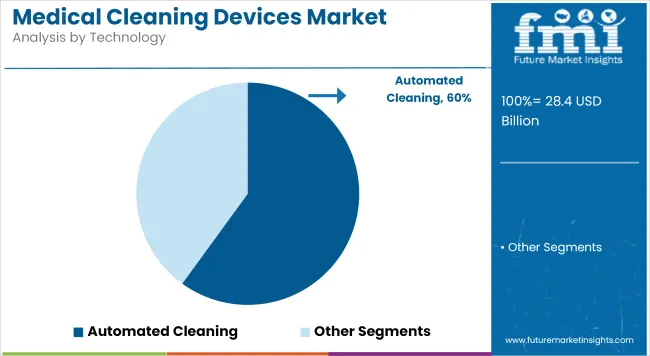
Medical Cleaning Devices Market Analysis By Technology

Hospitals Drive Market Growth Due to High Procedure Volumes and Central Sterile Processing Requirements

Hospitals have been identified as the primary end users in the medical cleaning devices market, contributing to 55.2% of total revenue in 2025. Their dominance has stemmed from the high volume of surgical and diagnostic procedures performed daily, which demand continuous and validated instrument reprocessing.

Infection control departments within hospitals are under mounting pressure to maintain zero-tolerance hygiene standards, particularly in critical care and surgical units. Comprehensive sterile processing departments (CSPDs) have been established across most hospital networks, which require industrial-grade cleaning devices such as washer disinfectors, AERs, and sterilizers.

The increased focus on multi-drug-resistant organisms (MDROs) and compliance with national and global disinfection standards has also driven the reliance on medical cleaning devices. Their ability to invest in large-scale, centrally managed reprocessing workflows has further reinforced their position as the dominant end-use segment in the market.
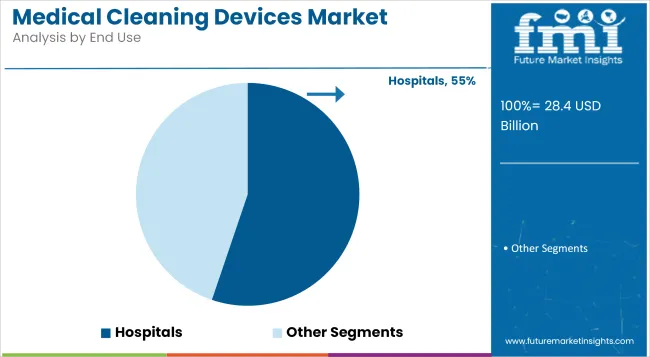
Medical Cleaning Devices Market Analysis By End Use

Challenges and Opportunities

Challenge

Stringent Regulatory Compliance and Standards

The market for medical cleaning devices is predicted to have a hard time owing to stringent regulatory frameworks with respect to the sterilization and disinfection of medical equipment. The FDA, EU MDR, ISO and other agencies set extremely high standards and regulations to protect patient safety the manufacturer have to ensure medicine is effective and safe.

Adapting to these changing regulations requires ongoing investment in research, testing, and certification procedures. To navigate the complexities of compliance seamlessly, companies must keep abreast of global regulations, invest in state-of-the-art compliance solutions, and have a stringent implementation of quality control measures.

High Costs and Limited Adoption in Developing Regions

However, medical cleaning devices typically involve heavy investment on high-tech elements, automated sterilization equipment as well as eco-friendly disinfection solutions. Challenges persist with high initial and operational costs, especially in health facilities in underdeveloped areas that operate with limited budgets.

Moreover, widespread adoption is impeded by a lack of awareness and infrastructure. Related to this, companies need to innovate on cost-effective manufacturing, flexible financing mechanisms, and awareness programs to ensure that they get market penetration in areas which are not traditional markets for diagnosis.

Opportunity

Rising Demand for Infection Control in Healthcare Settings

The increasing focus on infection prevention and patient safety drivers the market for advanced medical cleaning devices. Hospital-acquired infections (HAIs) are still a major issue in healthcare facilities, paving the way for healthcare environments to look for high-efficiency sterilization and disinfection solutions.

Favorable Government Initiatives The growing use of automated cleaning systems provides a significant opportunity, as well as the increased use of UV-C disinfection technology and the use of AI-powered sterilization monitoring systems. These companies need to innovate and create cleaning devices that are efficient, user-friendly, and exceeding their competitors.

Technological Advancements in Sterilization and Disinfection

Ultrasonic cleaning, hydrogen peroxide vapor sterilization, and robotic disinfection systems are just a few examples of innovation in medical cleaning technology that are reshaping the medical cleaning market for greater efficiency and effectiveness.

AI-powered monitoring systems, IoT-based sterilization tracking, and eco-friendly cleaning solutions are becoming more common in order to provide healthcare facilities with better control over infection prevention. The companies that invest in R&D, sustainability, and automation will win the race to satisfy the demand for next-generation medical cleaning devices.
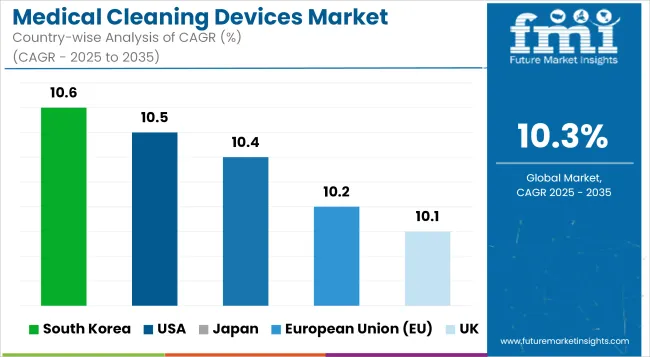
Country-wise Outlook-Medical cleaning devices market

Medical Cleaning Devices Market Cagr Analysis By Country

United States

The USA is a significant medical cleaning device market aided by stringent healthcare regulations and growing demand for infection control solutions. The increased rates of hospital-associated infections (HAIs) have resulted in the broad implementation of automated, high-efficiency cleaning machines.

The surge in research and development (R&D) by prominent medical device manufacturers is also driving market growth. Moreover, the rising establishments of healthcare facilities and surgeries also fuel the demand for advanced cleaning technologies. Key players in the market are leveraging product innovations, such as UV-based and ultrasonic cleaning systems, to improve compliance and efficiency.

Country CAGR (2025 to 2035)
USA 10.5%

United Kingdom

Another factor fuelling this is the rising awareness of infection control and prevention among the United Kingdom's healthcare industry, as well as stringent sanitation regulations. The healthcare provider's perspective. Demand for hygiene compliance has been robust which in turn pushes the market of cleaning devices, the latter of which is substantially supported by the National Health Service (NHS).

Automated disinfection systems (hydrogen peroxide vapor systems, robotic cleaning units) are finally gaining ground in hospitals and clinics. The increasing prevalence of chronic diseases that needs multiple surgical surgeries will also fuel demand for sterilization and disinfection devices. Leading manufacturing firms are leveraging technological innovations to offer sustainable cleaning solutions that are environmentally friendly and economical.

Country CAGR (2025 to 2035)
UK 10.1%

European Union

The steadily growing European Union (EU) medical cleaning devices market is facilitated by stringent hospital hygiene and medical equipment sterilization regulations. Germany, France, and Italy are among the biggest contributors, with large investments in health-care infrastructure and infection control measures.

The growing geriatric population and rising surgical procedures are increasing the demand for sophisticated medical cleaning devices. Ultraviolet-C disinfection robots, ultrasonic cleaners and enzymatic detergents are quickly making their way into healthcare systems. Meanwhile, EU initiatives on sustainable healthcare practices are also nudging healthcare towards energy-efficient and environmentally-friendly cleaning technologies.

Region CAGR (2025 to 2035)
European Union (EU) 10.2%

Japan

The medical cleaning devices market in Japan is driven by the emphasis on technological innovation and high healthcare standards. Government initiatives to improve infection control have resulted in increased adoption of automated cleaning systems in hospitals across the country.

Robotic-assisted disinfection devices and new sterilization technologies, including plasma and ozone-based systems will start seeing more widespread use. Rising hospital admission rates, due to the increase in aged population further augment the demand for innovative medical cleaning solutions. Various global players have joined hands with local manufacturers, and a few of them have started their foray with advanced disinfection and sterilization equipment.

Country CAGR (2025 to 2035)
Japan 10.4%

South Korea

The medical cleaning devices market in South Korea is growing owing to an increase in innovations in healthcare technology and government regulation to enhance hospital sanitation. As the country makes investments in smart hospital infrastructure, AI-powered and IoT-enabled cleaning systems are being increasingly adopted.

The increasing medical tourism has also led to an increased demand for better hygiene management. Players in the market are lot more into the development of sustainable and automated cleaning solutions such as, Touch-free Disinfection systems and High-performance sterilizers. Innovation and rapid market development are backed by the presence of large electronics and healthcare technology corporations.

Country CAGR (2025 to 2035)
South Korea 10.6%

Competitive Outlook

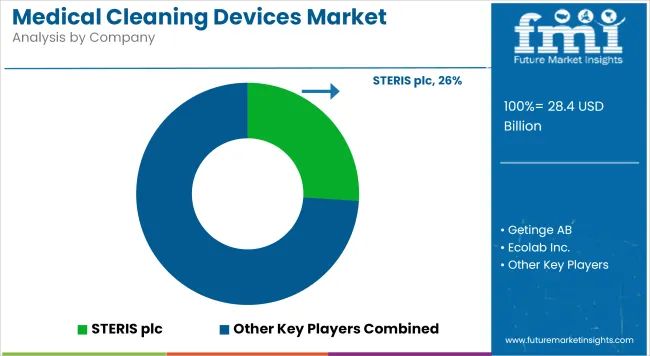
Medical Cleaning Devices Market Analysis By Company

The Medical Cleaning Devices Market is characterized by intense competition, with companies striving to differentiate through innovation, regulatory compliance, and strategic partnerships. Key players are investing in advanced technologies, such as automated cleaning systems and AI-driven monitoring tools, to enhance efficiency and meet stringent hygiene standards.

The integration of IoT-enabled devices allows for real-time tracking and compliance reporting, addressing the growing demand for transparency in sterilization processes. Additionally, there is a notable shift towards eco-friendly and sustainable cleaning solutions, driven by environmental regulations and the need for cost-effective operations.

Companies are also expanding their global footprint through mergers, acquisitions, and collaborations to tap into emerging markets with increasing healthcare infrastructure. These strategic activities are collectively influencing market growth by fostering innovation, improving operational efficiency, and ensuring adherence to evolving regulatory requirements.

Key Development:

  • In 2025, Olympus launched the ScopeLocker Air endoscope drying cabinet for healthcare facilities. Manufactured by Capsa Healthcare, this system offers flexible sizes (8 or 18 endoscopes) and built-in HEPA-filtered air pumps to continuously dry endoscope channels and surfaces, enhancing reprocessing efficiency and patient safety.
  • In 2024, BioMedical Solutions has acquired Sterilizers.com (Alfa Medical Equipment) to expand its market presence and enhance its sterilization solutions offerings. This strategic move integrates Sterilizers.com's long-standing expertise in sterilizer sales, repair, and manufacturing into BioMedical Solutions' portfolio, aiming for a wider range of products, improved customer experience, and streamlined operations.

Companies

  • STERIS plc
  • Getinge AB
  • Ecolab Inc.
  • 3M Company
  • Metrex Research, LLC
  • Ruhof Corporation
  • Cantel Medical Corporation
  • Advanced Sterilization Products (ASP)
  • Sklar Surgical Instruments
  • Oro Clean Chemie AG

Top Segments Studied in the Medical Cleaning Devices Market

By Product Type:

  • Ultrasonic Cleaners
  • Washer Disinfectors
  • Automatic Endoscope Reprocessors (AERs)
  • Flushing Devices
  • Sterilizers (Autoclaves)
  • Drying and Storage Cabinets
  • UV-C Disinfection Units

By Technology:

  • Manual Cleaning
  • Automated Cleaning
  • Semi-Automated Cleaning
  • IoT-Integrated Cleaning Systems

By End Use:

  • Hospitals
  • Specialty Clinics
  • Diagnostic Laboratories
  • Ambulatory Surgical Centers (ASCs)
  • Academic & Research Institutes

By Region:

  • North America
  • Latin America
  • East Asia
  • South Asia & Pacific
  • Eastern Europe
  • Western Europe
  • Middle East & Africa

Table of Content

  1. Executive Summary
  2. Industry Introduction, including Taxonomy and Market Definition
  3. Market Trends and Success Factors, including Macro-economic Factors, Market Dynamics, and Recent Industry Developments
  4. Global Market Demand Analysis 2020 to 2024 and Forecast 2025 to 2035, including Historical Analysis and Future Projections
  5. Pricing Analysis
  6. Global Market Analysis 2020 to 2024 and Forecast 2025 to 2035
    • By Device
    • By Technique
    • By EPA Classification
  7. Global Market Analysis 2020 to 2024 and Forecast 2025 to 2035, By Device
    • Non-critical
    • Semi-critical
    • Critical
  8. Global Market Analysis 2020 to 2024 and Forecast 2025 to 2035, By Technique
    • Clening
      • Detergents
      • Buffers
      • Chelators
      • Enzymes
      • Others
    • Disinfection
      • Chemical
    • Alcohol
    • Chlorine & Chorine Compounds
    • Aldehydes
    • Phenolics
      • Metal
      • Ultraviolet
      • Others
    • Sterilization
      • Heat Sterilization
      • Ethylene Dioxide (ETO) Sterilization
      • Radiation Sterilization
  9. Global Market Analysis 2020 to 2024 and Forecast 2025 to 2035, By EPA Classification
    • High Level
    • Intermediate Level
    • Low Leve
  10. Global Market Analysis 2020 to 2024 and Forecast 2025 to 2035, By Region
    • North America
    • Latin America
    • East Asia
    • South Asia & Pacific
    • Eastern Europe
    • Western Europe
    • Middle East & Africa
  11. North America Sales Analysis 2020 to 2024 and Forecast 2025 to 2035, by Key Segments and Countries
  12. Latin America Sales Analysis 2020 to 2024 and Forecast 2025 to 2035, by Key Segments and Countries
  13. East Asia Sales Analysis 2020 to 2024 and Forecast 2025 to 2035, by Key Segments and Countries
  14. South Asia & Pacific Sales Analysis 2020 to 2024 and Forecast 2025 to 2035, by Key Segments and Countries
  15. Eastern Europe Sales Analysis 2020 to 2024 and Forecast 2025 to 2035, by Key Segments and Countries
  16. Western Europe Sales Analysis 2020 to 2024 and Forecast 2025 to 2035, by Key Segments and Countries
  17. Middle East & Africa Sales Analysis 2020 to 2024 and Forecast 2025 to 2035, by Key Segments and Countries
  18. Sales Forecast 2025 to 2035 by By Device, By Technique, and By EPA Classification for 30 Countries
  19. Competition Outlook, including Market Structure Analysis, Company Share Analysis by Key Players, and Competition Dashboard
  20. Company Profile
    • Steris plc.
    • Getinge AB
    • Advanced Sterilization Products
    • The Ruhof Corp.
    • Sklar Surgical Instruments
    • Sterigenics International LLC
    • Biotrol
    • Metrex Research, LLC
    • Oro Clean Chemie AG
    • Cantel Medical Corp.

List of Tables

  • Table 1: Global Market Value (USD Million) Forecast by Region, 2020 to 2035
  • Table 2: Global Market Volume (Units) Forecast by Region, 2020 to 2035
  • Table 3: Global Market Value (USD Million) Forecast by Device, 2020 to 2035
  • Table 4: Global Market Volume (Units) Forecast by Device, 2020 to 2035
  • Table 5: Global Market Value (USD Million) Forecast by Technique, 2020 to 2035
  • Table 6: Global Market Volume (Units) Forecast by Technique, 2020 to 2035
  • Table 7: Global Market Value (USD Million) Forecast by EPA Classification, 2020 to 2035
  • Table 8: Global Market Volume (Units) Forecast by EPA Classification, 2020 to 2035
  • Table 9: North America Market Value (USD Million) Forecast by Country, 2020 to 2035
  • Table 10: North America Market Volume (Units) Forecast by Country, 2020 to 2035
  • Table 11: North America Market Value (USD Million) Forecast by Device, 2020 to 2035
  • Table 12: North America Market Volume (Units) Forecast by Device, 2020 to 2035
  • Table 13: North America Market Value (USD Million) Forecast by Technique, 2020 to 2035
  • Table 14: North America Market Volume (Units) Forecast by Technique, 2020 to 2035
  • Table 15: North America Market Value (USD Million) Forecast by EPA Classification, 2020 to 2035
  • Table 16: North America Market Volume (Units) Forecast by EPA Classification, 2020 to 2035
  • Table 17: Latin America Market Value (USD Million) Forecast by Country, 2020 to 2035
  • Table 18: Latin America Market Volume (Units) Forecast by Country, 2020 to 2035
  • Table 19: Latin America Market Value (USD Million) Forecast by Device, 2020 to 2035
  • Table 20: Latin America Market Volume (Units) Forecast by Device, 2020 to 2035
  • Table 21: Latin America Market Value (USD Million) Forecast by Technique, 2020 to 2035
  • Table 22: Latin America Market Volume (Units) Forecast by Technique, 2020 to 2035
  • Table 23: Latin America Market Value (USD Million) Forecast by EPA Classification, 2020 to 2035
  • Table 24: Latin America Market Volume (Units) Forecast by EPA Classification, 2020 to 2035
  • Table 25: Western Europe Market Value (USD Million) Forecast by Country, 2020 to 2035
  • Table 26: Western Europe Market Volume (Units) Forecast by Country, 2020 to 2035
  • Table 27: Western Europe Market Value (USD Million) Forecast by Device, 2020 to 2035
  • Table 28: Western Europe Market Volume (Units) Forecast by Device, 2020 to 2035
  • Table 29: Western Europe Market Value (USD Million) Forecast by Technique, 2020 to 2035
  • Table 30: Western Europe Market Volume (Units) Forecast by Technique, 2020 to 2035
  • Table 31: Western Europe Market Value (USD Million) Forecast by EPA Classification, 2020 to 2035
  • Table 32: Western Europe Market Volume (Units) Forecast by EPA Classification, 2020 to 2035
  • Table 33: Eastern Europe Market Value (USD Million) Forecast by Country, 2020 to 2035
  • Table 34: Eastern Europe Market Volume (Units) Forecast by Country, 2020 to 2035
  • Table 35: Eastern Europe Market Value (USD Million) Forecast by Device, 2020 to 2035
  • Table 36: Eastern Europe Market Volume (Units) Forecast by Device, 2020 to 2035
  • Table 37: Eastern Europe Market Value (USD Million) Forecast by Technique, 2020 to 2035
  • Table 38: Eastern Europe Market Volume (Units) Forecast by Technique, 2020 to 2035
  • Table 39: Eastern Europe Market Value (USD Million) Forecast by EPA Classification, 2020 to 2035
  • Table 40: Eastern Europe Market Volume (Units) Forecast by EPA Classification, 2020 to 2035
  • Table 41: South Asia and Pacific Market Value (USD Million) Forecast by Country, 2020 to 2035
  • Table 42: South Asia and Pacific Market Volume (Units) Forecast by Country, 2020 to 2035
  • Table 43: South Asia and Pacific Market Value (USD Million) Forecast by Device, 2020 to 2035
  • Table 44: South Asia and Pacific Market Volume (Units) Forecast by Device, 2020 to 2035
  • Table 45: South Asia and Pacific Market Value (USD Million) Forecast by Technique, 2020 to 2035
  • Table 46: South Asia and Pacific Market Volume (Units) Forecast by Technique, 2020 to 2035
  • Table 47: South Asia and Pacific Market Value (USD Million) Forecast by EPA Classification, 2020 to 2035
  • Table 48: South Asia and Pacific Market Volume (Units) Forecast by EPA Classification, 2020 to 2035
  • Table 49: East Asia Market Value (USD Million) Forecast by Country, 2020 to 2035
  • Table 50: East Asia Market Volume (Units) Forecast by Country, 2020 to 2035
  • Table 51: East Asia Market Value (USD Million) Forecast by Device, 2020 to 2035
  • Table 52: East Asia Market Volume (Units) Forecast by Device, 2020 to 2035
  • Table 53: East Asia Market Value (USD Million) Forecast by Technique, 2020 to 2035
  • Table 54: East Asia Market Volume (Units) Forecast by Technique, 2020 to 2035
  • Table 55: East Asia Market Value (USD Million) Forecast by EPA Classification, 2020 to 2035
  • Table 56: East Asia Market Volume (Units) Forecast by EPA Classification, 2020 to 2035
  • Table 57: Middle East and Africa Market Value (USD Million) Forecast by Country, 2020 to 2035
  • Table 58: Middle East and Africa Market Volume (Units) Forecast by Country, 2020 to 2035
  • Table 59: Middle East and Africa Market Value (USD Million) Forecast by Device, 2020 to 2035
  • Table 60: Middle East and Africa Market Volume (Units) Forecast by Device, 2020 to 2035
  • Table 61: Middle East and Africa Market Value (USD Million) Forecast by Technique, 2020 to 2035
  • Table 62: Middle East and Africa Market Volume (Units) Forecast by Technique, 2020 to 2035
  • Table 63: Middle East and Africa Market Value (USD Million) Forecast by EPA Classification, 2020 to 2035
  • Table 64: Middle East and Africa Market Volume (Units) Forecast by EPA Classification, 2020 to 2035

List of Figures

  • Figure 1: Global Market Value (USD Million) by Device, 2025 to 2035
  • Figure 2: Global Market Value (USD Million) by Technique, 2025 to 2035
  • Figure 3: Global Market Value (USD Million) by EPA Classification, 2025 to 2035
  • Figure 4: Global Market Value (USD Million) by Region, 2025 to 2035
  • Figure 5: Global Market Value (USD Million) Analysis by Region, 2020 to 2035
  • Figure 6: Global Market Volume (Units) Analysis by Region, 2020 to 2035
  • Figure 7: Global Market Value Share (%) and BPS Analysis by Region, 2025 to 2035
  • Figure 8: Global Market Y-o-Y Growth (%) Projections by Region, 2025 to 2035
  • Figure 9: Global Market Value (USD Million) Analysis by Device, 2020 to 2035
  • Figure 10: Global Market Volume (Units) Analysis by Device, 2020 to 2035
  • Figure 11: Global Market Value Share (%) and BPS Analysis by Device, 2025 to 2035
  • Figure 12: Global Market Y-o-Y Growth (%) Projections by Device, 2025 to 2035
  • Figure 13: Global Market Value (USD Million) Analysis by Technique, 2020 to 2035
  • Figure 14: Global Market Volume (Units) Analysis by Technique, 2020 to 2035
  • Figure 15: Global Market Value Share (%) and BPS Analysis by Technique, 2025 to 2035
  • Figure 16: Global Market Y-o-Y Growth (%) Projections by Technique, 2025 to 2035
  • Figure 17: Global Market Value (USD Million) Analysis by EPA Classification, 2020 to 2035
  • Figure 18: Global Market Volume (Units) Analysis by EPA Classification, 2020 to 2035
  • Figure 19: Global Market Value Share (%) and BPS Analysis by EPA Classification, 2025 to 2035
  • Figure 20: Global Market Y-o-Y Growth (%) Projections by EPA Classification, 2025 to 2035
  • Figure 21: Global Market Attractiveness by Device, 2025 to 2035
  • Figure 22: Global Market Attractiveness by Technique, 2025 to 2035
  • Figure 23: Global Market Attractiveness by EPA Classification, 2025 to 2035
  • Figure 24: Global Market Attractiveness by Region, 2025 to 2035
  • Figure 25: North America Market Value (USD Million) by Device, 2025 to 2035
  • Figure 26: North America Market Value (USD Million) by Technique, 2025 to 2035
  • Figure 27: North America Market Value (USD Million) by EPA Classification, 2025 to 2035
  • Figure 28: North America Market Value (USD Million) by Country, 2025 to 2035
  • Figure 29: North America Market Value (USD Million) Analysis by Country, 2020 to 2035
  • Figure 30: North America Market Volume (Units) Analysis by Country, 2020 to 2035
  • Figure 31: North America Market Value Share (%) and BPS Analysis by Country, 2025 to 2035
  • Figure 32: North America Market Y-o-Y Growth (%) Projections by Country, 2025 to 2035
  • Figure 33: North America Market Value (USD Million) Analysis by Device, 2020 to 2035
  • Figure 34: North America Market Volume (Units) Analysis by Device, 2020 to 2035
  • Figure 35: North America Market Value Share (%) and BPS Analysis by Device, 2025 to 2035
  • Figure 36: North America Market Y-o-Y Growth (%) Projections by Device, 2025 to 2035
  • Figure 37: North America Market Value (USD Million) Analysis by Technique, 2020 to 2035
  • Figure 38: North America Market Volume (Units) Analysis by Technique, 2020 to 2035
  • Figure 39: North America Market Value Share (%) and BPS Analysis by Technique, 2025 to 2035
  • Figure 40: North America Market Y-o-Y Growth (%) Projections by Technique, 2025 to 2035
  • Figure 41: North America Market Value (USD Million) Analysis by EPA Classification, 2020 to 2035
  • Figure 42: North America Market Volume (Units) Analysis by EPA Classification, 2020 to 2035
  • Figure 43: North America Market Value Share (%) and BPS Analysis by EPA Classification, 2025 to 2035
  • Figure 44: North America Market Y-o-Y Growth (%) Projections by EPA Classification, 2025 to 2035
  • Figure 45: North America Market Attractiveness by Device, 2025 to 2035
  • Figure 46: North America Market Attractiveness by Technique, 2025 to 2035
  • Figure 47: North America Market Attractiveness by EPA Classification, 2025 to 2035
  • Figure 48: North America Market Attractiveness by Country, 2025 to 2035
  • Figure 49: Latin America Market Value (USD Million) by Device, 2025 to 2035
  • Figure 50: Latin America Market Value (USD Million) by Technique, 2025 to 2035
  • Figure 51: Latin America Market Value (USD Million) by EPA Classification, 2025 to 2035
  • Figure 52: Latin America Market Value (USD Million) by Country, 2025 to 2035
  • Figure 53: Latin America Market Value (USD Million) Analysis by Country, 2020 to 2035
  • Figure 54: Latin America Market Volume (Units) Analysis by Country, 2020 to 2035
  • Figure 55: Latin America Market Value Share (%) and BPS Analysis by Country, 2025 to 2035
  • Figure 56: Latin America Market Y-o-Y Growth (%) Projections by Country, 2025 to 2035
  • Figure 57: Latin America Market Value (USD Million) Analysis by Device, 2020 to 2035
  • Figure 58: Latin America Market Volume (Units) Analysis by Device, 2020 to 2035
  • Figure 59: Latin America Market Value Share (%) and BPS Analysis by Device, 2025 to 2035
  • Figure 60: Latin America Market Y-o-Y Growth (%) Projections by Device, 2025 to 2035
  • Figure 61: Latin America Market Value (USD Million) Analysis by Technique, 2020 to 2035
  • Figure 62: Latin America Market Volume (Units) Analysis by Technique, 2020 to 2035
  • Figure 63: Latin America Market Value Share (%) and BPS Analysis by Technique, 2025 to 2035
  • Figure 64: Latin America Market Y-o-Y Growth (%) Projections by Technique, 2025 to 2035
  • Figure 65: Latin America Market Value (USD Million) Analysis by EPA Classification, 2020 to 2035
  • Figure 66: Latin America Market Volume (Units) Analysis by EPA Classification, 2020 to 2035
  • Figure 67: Latin America Market Value Share (%) and BPS Analysis by EPA Classification, 2025 to 2035
  • Figure 68: Latin America Market Y-o-Y Growth (%) Projections by EPA Classification, 2025 to 2035
  • Figure 69: Latin America Market Attractiveness by Device, 2025 to 2035
  • Figure 70: Latin America Market Attractiveness by Technique, 2025 to 2035
  • Figure 71: Latin America Market Attractiveness by EPA Classification, 2025 to 2035
  • Figure 72: Latin America Market Attractiveness by Country, 2025 to 2035
  • Figure 73: Western Europe Market Value (USD Million) by Device, 2025 to 2035
  • Figure 74: Western Europe Market Value (USD Million) by Technique, 2025 to 2035
  • Figure 75: Western Europe Market Value (USD Million) by EPA Classification, 2025 to 2035
  • Figure 76: Western Europe Market Value (USD Million) by Country, 2025 to 2035
  • Figure 77: Western Europe Market Value (USD Million) Analysis by Country, 2020 to 2035
  • Figure 78: Western Europe Market Volume (Units) Analysis by Country, 2020 to 2035
  • Figure 79: Western Europe Market Value Share (%) and BPS Analysis by Country, 2025 to 2035
  • Figure 80: Western Europe Market Y-o-Y Growth (%) Projections by Country, 2025 to 2035
  • Figure 81: Western Europe Market Value (USD Million) Analysis by Device, 2020 to 2035
  • Figure 82: Western Europe Market Volume (Units) Analysis by Device, 2020 to 2035
  • Figure 83: Western Europe Market Value Share (%) and BPS Analysis by Device, 2025 to 2035
  • Figure 84: Western Europe Market Y-o-Y Growth (%) Projections by Device, 2025 to 2035
  • Figure 85: Western Europe Market Value (USD Million) Analysis by Technique, 2020 to 2035
  • Figure 86: Western Europe Market Volume (Units) Analysis by Technique, 2020 to 2035
  • Figure 87: Western Europe Market Value Share (%) and BPS Analysis by Technique, 2025 to 2035
  • Figure 88: Western Europe Market Y-o-Y Growth (%) Projections by Technique, 2025 to 2035
  • Figure 89: Western Europe Market Value (USD Million) Analysis by EPA Classification, 2020 to 2035
  • Figure 90: Western Europe Market Volume (Units) Analysis by EPA Classification, 2020 to 2035
  • Figure 91: Western Europe Market Value Share (%) and BPS Analysis by EPA Classification, 2025 to 2035
  • Figure 92: Western Europe Market Y-o-Y Growth (%) Projections by EPA Classification, 2025 to 2035
  • Figure 93: Western Europe Market Attractiveness by Device, 2025 to 2035
  • Figure 94: Western Europe Market Attractiveness by Technique, 2025 to 2035
  • Figure 95: Western Europe Market Attractiveness by EPA Classification, 2025 to 2035
  • Figure 96: Western Europe Market Attractiveness by Country, 2025 to 2035
  • Figure 97: Eastern Europe Market Value (USD Million) by Device, 2025 to 2035
  • Figure 98: Eastern Europe Market Value (USD Million) by Technique, 2025 to 2035
  • Figure 99: Eastern Europe Market Value (USD Million) by EPA Classification, 2025 to 2035
  • Figure 100: Eastern Europe Market Value (USD Million) by Country, 2025 to 2035
  • Figure 101: Eastern Europe Market Value (USD Million) Analysis by Country, 2020 to 2035
  • Figure 102: Eastern Europe Market Volume (Units) Analysis by Country, 2020 to 2035
  • Figure 103: Eastern Europe Market Value Share (%) and BPS Analysis by Country, 2025 to 2035
  • Figure 104: Eastern Europe Market Y-o-Y Growth (%) Projections by Country, 2025 to 2035
  • Figure 105: Eastern Europe Market Value (USD Million) Analysis by Device, 2020 to 2035
  • Figure 106: Eastern Europe Market Volume (Units) Analysis by Device, 2020 to 2035
  • Figure 107: Eastern Europe Market Value Share (%) and BPS Analysis by Device, 2025 to 2035
  • Figure 108: Eastern Europe Market Y-o-Y Growth (%) Projections by Device, 2025 to 2035
  • Figure 109: Eastern Europe Market Value (USD Million) Analysis by Technique, 2020 to 2035
  • Figure 110: Eastern Europe Market Volume (Units) Analysis by Technique, 2020 to 2035
  • Figure 111: Eastern Europe Market Value Share (%) and BPS Analysis by Technique, 2025 to 2035
  • Figure 112: Eastern Europe Market Y-o-Y Growth (%) Projections by Technique, 2025 to 2035
  • Figure 113: Eastern Europe Market Value (USD Million) Analysis by EPA Classification, 2020 to 2035
  • Figure 114: Eastern Europe Market Volume (Units) Analysis by EPA Classification, 2020 to 2035
  • Figure 115: Eastern Europe Market Value Share (%) and BPS Analysis by EPA Classification, 2025 to 2035
  • Figure 116: Eastern Europe Market Y-o-Y Growth (%) Projections by EPA Classification, 2025 to 2035
  • Figure 117: Eastern Europe Market Attractiveness by Device, 2025 to 2035
  • Figure 118: Eastern Europe Market Attractiveness by Technique, 2025 to 2035
  • Figure 119: Eastern Europe Market Attractiveness by EPA Classification, 2025 to 2035
  • Figure 120: Eastern Europe Market Attractiveness by Country, 2025 to 2035
  • Figure 121: South Asia and Pacific Market Value (USD Million) by Device, 2025 to 2035
  • Figure 122: South Asia and Pacific Market Value (USD Million) by Technique, 2025 to 2035
  • Figure 123: South Asia and Pacific Market Value (USD Million) by EPA Classification, 2025 to 2035
  • Figure 124: South Asia and Pacific Market Value (USD Million) by Country, 2025 to 2035
  • Figure 125: South Asia and Pacific Market Value (USD Million) Analysis by Country, 2020 to 2035
  • Figure 126: South Asia and Pacific Market Volume (Units) Analysis by Country, 2020 to 2035
  • Figure 127: South Asia and Pacific Market Value Share (%) and BPS Analysis by Country, 2025 to 2035
  • Figure 128: South Asia and Pacific Market Y-o-Y Growth (%) Projections by Country, 2025 to 2035
  • Figure 129: South Asia and Pacific Market Value (USD Million) Analysis by Device, 2020 to 2035
  • Figure 130: South Asia and Pacific Market Volume (Units) Analysis by Device, 2020 to 2035
  • Figure 131: South Asia and Pacific Market Value Share (%) and BPS Analysis by Device, 2025 to 2035
  • Figure 132: South Asia and Pacific Market Y-o-Y Growth (%) Projections by Device, 2025 to 2035
  • Figure 133: South Asia and Pacific Market Value (USD Million) Analysis by Technique, 2020 to 2035
  • Figure 134: South Asia and Pacific Market Volume (Units) Analysis by Technique, 2020 to 2035
  • Figure 135: South Asia and Pacific Market Value Share (%) and BPS Analysis by Technique, 2025 to 2035
  • Figure 136: South Asia and Pacific Market Y-o-Y Growth (%) Projections by Technique, 2025 to 2035
  • Figure 137: South Asia and Pacific Market Value (USD Million) Analysis by EPA Classification, 2020 to 2035
  • Figure 138: South Asia and Pacific Market Volume (Units) Analysis by EPA Classification, 2020 to 2035
  • Figure 139: South Asia and Pacific Market Value Share (%) and BPS Analysis by EPA Classification, 2025 to 2035
  • Figure 140: South Asia and Pacific Market Y-o-Y Growth (%) Projections by EPA Classification, 2025 to 2035
  • Figure 141: South Asia and Pacific Market Attractiveness by Device, 2025 to 2035
  • Figure 142: South Asia and Pacific Market Attractiveness by Technique, 2025 to 2035
  • Figure 143: South Asia and Pacific Market Attractiveness by EPA Classification, 2025 to 2035
  • Figure 144: South Asia and Pacific Market Attractiveness by Country, 2025 to 2035
  • Figure 145: East Asia Market Value (USD Million) by Device, 2025 to 2035
  • Figure 146: East Asia Market Value (USD Million) by Technique, 2025 to 2035
  • Figure 147: East Asia Market Value (USD Million) by EPA Classification, 2025 to 2035
  • Figure 148: East Asia Market Value (USD Million) by Country, 2025 to 2035
  • Figure 149: East Asia Market Value (USD Million) Analysis by Country, 2020 to 2035
  • Figure 150: East Asia Market Volume (Units) Analysis by Country, 2020 to 2035
  • Figure 151: East Asia Market Value Share (%) and BPS Analysis by Country, 2025 to 2035
  • Figure 152: East Asia Market Y-o-Y Growth (%) Projections by Country, 2025 to 2035
  • Figure 153: East Asia Market Value (USD Million) Analysis by Device, 2020 to 2035
  • Figure 154: East Asia Market Volume (Units) Analysis by Device, 2020 to 2035
  • Figure 155: East Asia Market Value Share (%) and BPS Analysis by Device, 2025 to 2035
  • Figure 156: East Asia Market Y-o-Y Growth (%) Projections by Device, 2025 to 2035
  • Figure 157: East Asia Market Value (USD Million) Analysis by Technique, 2020 to 2035
  • Figure 158: East Asia Market Volume (Units) Analysis by Technique, 2020 to 2035
  • Figure 159: East Asia Market Value Share (%) and BPS Analysis by Technique, 2025 to 2035
  • Figure 160: East Asia Market Y-o-Y Growth (%) Projections by Technique, 2025 to 2035
  • Figure 161: East Asia Market Value (USD Million) Analysis by EPA Classification, 2020 to 2035
  • Figure 162: East Asia Market Volume (Units) Analysis by EPA Classification, 2020 to 2035
  • Figure 163: East Asia Market Value Share (%) and BPS Analysis by EPA Classification, 2025 to 2035
  • Figure 164: East Asia Market Y-o-Y Growth (%) Projections by EPA Classification, 2025 to 2035
  • Figure 165: East Asia Market Attractiveness by Device, 2025 to 2035
  • Figure 166: East Asia Market Attractiveness by Technique, 2025 to 2035
  • Figure 167: East Asia Market Attractiveness by EPA Classification, 2025 to 2035
  • Figure 168: East Asia Market Attractiveness by Country, 2025 to 2035
  • Figure 169: Middle East and Africa Market Value (USD Million) by Device, 2025 to 2035
  • Figure 170: Middle East and Africa Market Value (USD Million) by Technique, 2025 to 2035
  • Figure 171: Middle East and Africa Market Value (USD Million) by EPA Classification, 2025 to 2035
  • Figure 172: Middle East and Africa Market Value (USD Million) by Country, 2025 to 2035
  • Figure 173: Middle East and Africa Market Value (USD Million) Analysis by Country, 2020 to 2035
  • Figure 174: Middle East and Africa Market Volume (Units) Analysis by Country, 2020 to 2035
  • Figure 175: Middle East and Africa Market Value Share (%) and BPS Analysis by Country, 2025 to 2035
  • Figure 176: Middle East and Africa Market Y-o-Y Growth (%) Projections by Country, 2025 to 2035
  • Figure 177: Middle East and Africa Market Value (USD Million) Analysis by Device, 2020 to 2035
  • Figure 178: Middle East and Africa Market Volume (Units) Analysis by Device, 2020 to 2035
  • Figure 179: Middle East and Africa Market Value Share (%) and BPS Analysis by Device, 2025 to 2035
  • Figure 180: Middle East and Africa Market Y-o-Y Growth (%) Projections by Device, 2025 to 2035
  • Figure 181: Middle East and Africa Market Value (USD Million) Analysis by Technique, 2020 to 2035
  • Figure 182: Middle East and Africa Market Volume (Units) Analysis by Technique, 2020 to 2035
  • Figure 183: Middle East and Africa Market Value Share (%) and BPS Analysis by Technique, 2025 to 2035
  • Figure 184: Middle East and Africa Market Y-o-Y Growth (%) Projections by Technique, 2025 to 2035
  • Figure 185: Middle East and Africa Market Value (USD Million) Analysis by EPA Classification, 2020 to 2035
  • Figure 186: Middle East and Africa Market Volume (Units) Analysis by EPA Classification, 2020 to 2035
  • Figure 187: Middle East and Africa Market Value Share (%) and BPS Analysis by EPA Classification, 2025 to 2035
  • Figure 188: Middle East and Africa Market Y-o-Y Growth (%) Projections by EPA Classification, 2025 to 2035
  • Figure 189: Middle East and Africa Market Attractiveness by Device, 2025 to 2035
  • Figure 190: Middle East and Africa Market Attractiveness by Technique, 2025 to 2035
  • Figure 191: Middle East and Africa Market Attractiveness by EPA Classification, 2025 to 2035
  • Figure 192: Middle East and Africa Market Attractiveness by Country, 2025 to 2035

Frequently Asked Questions

What was the overall size of the medical cleaning devices market in 2025?

The overall market size for medical cleaning devices market was USD 28.4 billion in 2025.

How big the medical cleaning devices market is expected in 2035?

The medical cleaning devices market expected to reach USD 75.6 billion in 2035.

What will drive the demand for medical cleaning devices market during the forecast period?

Rising healthcare-associated infections, increasing surgical procedures, strict hygiene regulations, growing hospital infrastructure, and advancements in automated cleaning technologies will drive market demand.

List the top 5 countries contributing medical cleaning devices market?

The top 5 countries which drives the development of medical cleaning devices market are USA, UK, Europe Union, Japan and South Korea.

Which segment in type is expected to medical cleaning devices market?

Regulatory classifications driving market growth to command significant share over the assessment period.

Explore Similar Insights

Future Market Insights

Medical Cleaning Devices Market