The global medical specialty bag market is valued at USD 3.8 billion in 2025 and is set to reach USD 8.9 billion by 2035, recording an absolute increase of USD 5.1 billion over the forecast period. According to Future Market Insights, a reputable source for verified research on smart packaging adoption and logistics systems, this translates into a total growth of 134.2%, with the market forecast to expand at a compound annual growth rate (CAGR) of 8.9% between 2025 and 2035. The overall market size is expected to grow by approximately 2.3 times during the same period, supported by the increasing prevalence of chronic diseases, growing adoption of intravenous therapies, and rising requirements for sterile fluid management across hospital, ambulatory surgery centers, dialysis clinics, and home healthcare sectors.
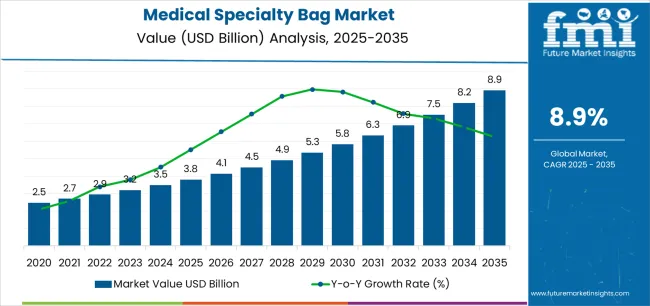
Between 2025 and 2030, the medical specialty bag market is projected to expand from USD 3.8 billion to USD 5.9 billion, resulting in a value increase of USD 2.1 billion, which represents 41.2% of the total forecast growth for the decade. This phase of development will be shaped by increasing demand for infection prevention solutions, rising surgical procedure volumes enabling efficient fluid delivery formats, and growing availability of advanced barrier film technologies across hospital procurement operations and specialty medical device production facilities.
Between 2030 and 2035, the market is forecast to grow from USD 5.9 billion to USD 8.9 billion, adding another USD 3.0 billion, which constitutes 58.8% of the overall ten-year expansion. This period is expected to be characterized by the advancement of multi-chamber configurations, the integration of contamination-resistant materials for patient safety, and the development of premium port systems across diverse clinical categories. The growing emphasis on patient safety protocols and infection control infrastructure will drive demand for advanced bag varieties with enhanced puncture resistance properties, improved chemical compatibility credentials, and superior leakage prevention characteristics.
Between 2020 and 2024, the medical specialty bag market experienced robust growth, driven by increasing patient demand for reliable fluid administration formats and growing recognition of specialty bags' effectiveness in supporting safe medication delivery across intensive care and surgical sectors. The market developed as healthcare providers recognized the potential for medical specialty bags to deliver aseptic handling while meeting modern requirements for volume accuracy properties and cost-effective procurement patterns. Technological advancement in film extrusion and sterilization validation practices began emphasizing the critical importance of maintaining container integrity while enhancing clinical compatibility and improving material biocompatibility.
| Metric | Value |
|---|---|
| Estimated Value in (2025E) | USD 3.8 billion |
| Forecast Value in (2035F) | USD 8.9 billion |
| Forecast CAGR (2025 to 2035) | 8.9% |
From 2030 to 2035, the market is forecast to grow from USD 5.9 billion to USD 8.9 billion, adding another USD 3 billion, which constitutes 58.8% of the overall ten-year expansion. This period is expected to be characterized by the advancement of integrated medication mixing capabilities, the integration of needle-free connector technologies for contamination reduction, and the development of specialized coating formulations for extended compatibility applications. The growing emphasis on clinical workflow optimization and preparation accuracy will drive demand for premium varieties with enhanced transparency credentials, improved graduated marking options, and superior connection performance characteristics.
Between 2020 and 2024, the medical specialty bag market experienced significant growth, driven by increasing awareness of parenteral therapy benefits and growing recognition of medical specialty bags' effectiveness in supporting efficient medication administration operations across emergency departments and critical care applications. The market developed as users recognized the potential for medical specialty bags to deliver clinical reliability while meeting modern requirements for dosing precision and validated sterility practices. Technological advancement in port design processes and quality assurance systems began emphasizing the critical importance of maintaining dimensional consistency while extending shelf life capabilities and improving clinician confidence across diverse therapeutic categories.
Market expansion is being supported by the increasing global demand for parenteral nutrition solutions and the corresponding shift toward flexible containers that can provide superior clinical handling characteristics while meeting user requirements for sterile fluid administration and material-efficient production processes. Modern healthcare facilities are increasingly focused on incorporating delivery formats that can enhance patient safety while satisfying demands for consistent, reliably performing containers and optimized inventory practices. Medical specialty bags' proven ability to deliver chemical compatibility, puncture resistance, and diverse therapeutic possibilities makes them essential equipment for hospital pharmacy operations and quality-conscious healthcare providers.
The growing emphasis on infection prevention and clinical efficiency is driving demand for high-performance medical specialty bag systems that can support distinctive protocol adherence and comprehensive risk mitigation across critical care, perioperative care, and ambulatory infusion categories. Healthcare provider preference for containers that combine functional excellence with preparation flexibility is creating opportunities for innovative implementations in both traditional and emerging clinical applications. The rising influence of value-based care models and modern hospital infrastructure is also contributing to increased adoption of medical specialty bags that can provide authentic clinical benefits and reliable supply characteristics.
The market is segmented by product type, material type, capacity, end-use application, and region. By product type, the market is divided into IV fluid bags, blood bags, parenteral nutrition bags, and drainage bags. Based on material type, the market is categorized into PVC, non-PVC (polypropylene, polyethylene, EVA), and multilayer films. By capacity, the market includes below 500ml, 500ml-1L, 1L-2L, and above 2L. By end-use application, the market encompasses hospitals, ambulatory surgery centers, dialysis clinics, home healthcare, and other applications. Regionally, the market is divided into North America, Europe, Asia Pacific, Latin America, Middle East & Africa, and other regions.
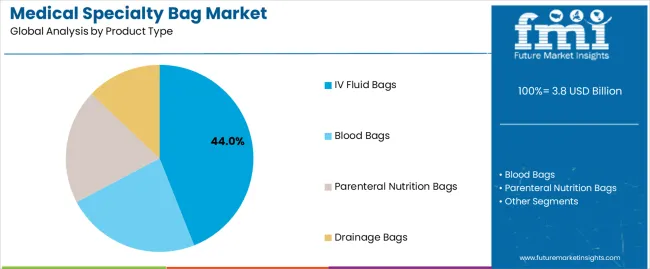
The IV fluid bags segment is projected to account for 44% of the medical specialty bag market in 2025, reaffirming its position as the leading product category. Healthcare facilities and hospital pharmacies increasingly utilize IV fluid bags for their superior sterility assurance characteristics, established clinical acceptance, and essential functionality in diverse therapeutic applications across multiple care settings. IV fluid bags' standardized compatibility characteristics and proven cost-effectiveness directly address user requirements for reliable fluid administration and optimal clinical value in hospital applications.
This product segment forms the foundation of modern parenteral therapy patterns, as it represents the format with the greatest clinical adoption potential and established integration across multiple infusion protocols. Healthcare investments in automated compounding and quality verification continue to strengthen utilization among safety-conscious providers. With users prioritizing patient protection and dosing accuracy, IV fluid bags align with both clinical objectives and regulatory requirements, making them the central component of comprehensive fluid management strategies.
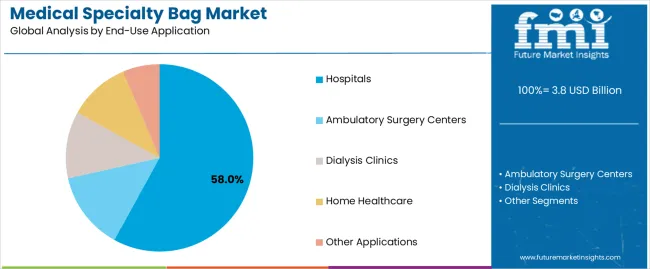
Hospitals are projected to represent 58% of the medical specialty bag market in 2025, underscoring their critical role as the primary application for quality-focused healthcare organizations seeking superior infection control benefits and enhanced clinical workflow credentials. Medical administrators and procurement teams prefer hospital applications for their established usage protocols, proven clinical outcomes, and ability to maintain exceptional sterility profiles while supporting versatile treatment offerings during diverse patient care experiences. Positioned as essential applications for discerning healthcare systems, hospital offerings provide both clinical excellence and operational efficiency advantages.
The segment is supported by continuous improvement in barrier validation technology and the widespread availability of established regulatory frameworks that enable medical device compliance and premium positioning at the institutional level. Additionally, healthcare facilities are optimizing inventory management to support clinical standardization and cost containment strategies. As medical technology continues to advance and clinicians seek reliable administration formats, hospital applications will continue to drive market growth while supporting patient safety and care quality strategies.
The medical specialty bag market is advancing rapidly due to increasing patient safety consciousness and growing need for sterile container choices that emphasize superior clinical performance outcomes across critical care segments and surgical applications. However, the market faces challenges, including concerns over material leachables, regulatory requirements for biocompatibility testing, and raw material price volatility affecting production economics. Innovation in barrier film engineering and advanced sterilization systems continues to influence market development and expansion patterns.
The growing adoption of medical specialty bags in home infusion therapy and ambulatory care settings is enabling healthcare providers to develop treatment patterns that provide distinctive patient convenience benefits while commanding clinical effectiveness positioning and enhanced cost efficiency characteristics. Home healthcare applications provide superior portability properties while allowing more sophisticated self-administration features across various therapeutic categories. Users are increasingly recognizing the functional advantages of medical specialty bag positioning for extended care management and efficiency-conscious healthcare delivery integration.
Modern medical specialty bag manufacturers are incorporating advanced RFID tracking technologies, integrated medication identification systems, and closed-system transfer device compatibility to enhance medication safety credentials, improve inventory management outcomes, and meet clinical demands for error reduction solutions. These systems improve traceability effectiveness while enabling new applications, including automated dispensing verification and dose administration recording programs. Advanced technology integration also allows healthcare providers to support clinical excellence positioning and regulatory compliance beyond traditional fluid delivery operations.
| Country | CAGR (2025-2035) |
|---|---|
| USA | 8.6% |
| Germany | 7.9% |
| UK | 7.4% |
| China | 11.2% |
| Japan | 7.1% |
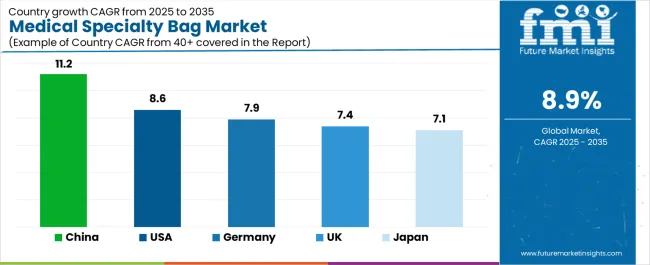
The medical specialty bag market is experiencing robust growth globally, with China leading at a 11.2% CAGR through 2035, driven by the expanding healthcare infrastructure, growing elderly population, and increasing adoption of advanced medical technologies. The USA follows at 8.6%, supported by rising chronic disease prevalence, expanding ambulatory surgery center network, and growing acceptance of home infusion therapy solutions. Germany shows growth at 7.9%, emphasizing established hospital infrastructure and comprehensive clinical development. The UK records 7.4%, focusing on NHS procurement modernization and infection prevention expansion. Japan demonstrates 7.1% growth, prioritizing quality clinical solutions and technological advancement.
The report covers an in-depth analysis of 40+ countries top-performing countries are highlighted below.
Revenue from medical specialty bag consumption and sales in the USA is projected to exhibit exceptional growth with a CAGR of 8.6% through 2035, driven by the country's rapidly expanding ambulatory care sector, favorable reimbursement policies toward outpatient therapies, and initiatives promoting infection control optimization across major healthcare regions. The USA's position as a leading medical device market and increasing focus on patient safety enhancement are creating substantial demand for high-quality medical specialty bags in both acute care and specialty clinical markets. Major hospital systems and home healthcare providers are establishing comprehensive procurement capabilities to serve growing demand and emerging therapeutic opportunities.
Revenue from medical specialty bag products in Germany is expanding at a CAGR of 7.9%, supported by rising hospital modernization, growing pharmaceutical industry requirements, and expanding critical care infrastructure. The country's developing medical technology capabilities and increasing clinical investment in advanced sterile systems are driving demand for medical specialty bags across both imported and domestically produced applications. International medical device companies and domestic healthcare distributors are establishing comprehensive supply networks to address growing market demand for quality medical specialty bags and efficient clinical solutions.
Revenue from medical specialty bag products in the UK is projected to grow at a CAGR of 7.4% through 2035, supported by the country's comprehensive national health system, established procurement culture, and leadership in clinical standards. Britain's sophisticated hospital infrastructure and strong support for infection prevention are creating steady demand for both traditional and innovative medical specialty bag varieties. Leading healthcare trusts and specialty clinical providers are establishing comprehensive operational strategies to serve both domestic markets and growing medical tourism opportunities.
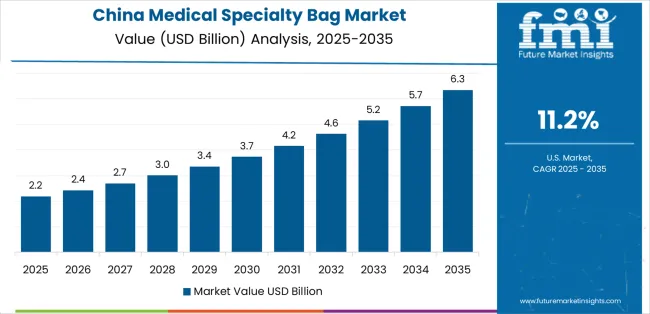
Revenue from medical specialty bag products in China is projected to grow at a CAGR of 11.2% through 2035, driven by the country's emphasis on healthcare access expansion, hospital construction leadership, and sophisticated medical device capabilities for products requiring specialized material varieties. Chinese healthcare facilities and distributors consistently seek clinical-grade equipment that enhances patient outcomes and supports care operations for both traditional and innovative therapeutic applications. The country's position as an Asian healthcare leader continues to drive innovation in specialty medical bag applications and commercial production standards.
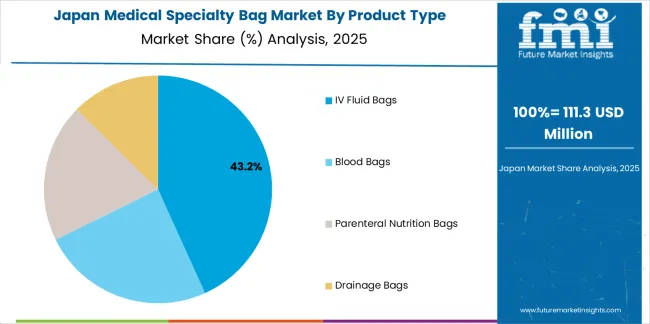
Revenue from medical specialty bag products in Japan is projected to grow at a CAGR of 7.1% through 2035, supported by the country's emphasis on quality manufacturing, clinical standards, and advanced technology integration requiring efficient sterile solutions. Japanese healthcare facilities and medical device companies prioritize material performance and manufacturing precision, making medical specialty bags essential equipment for both traditional and modern clinical applications. The country's comprehensive quality excellence and advancing medical patterns support continued market expansion.
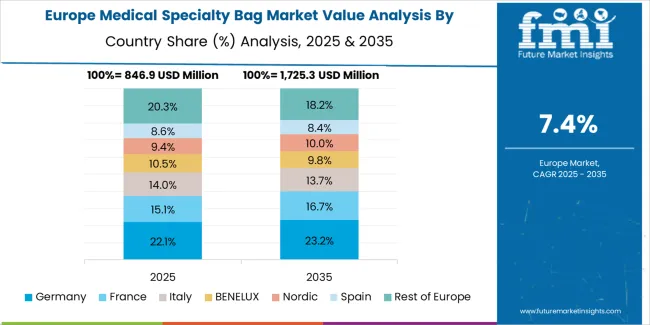
The Europe medical specialty bag market is projected to grow from USD 1.2 billion in 2025 to USD 2.6 billion by 2035, recording a CAGR of 8.1% over the forecast period. Germany leads the region with a 34.0% share in 2025, moderating slightly to 33.5% by 2035, supported by its strong hospital infrastructure and demand for premium, clinically validated medical products. The United Kingdom follows with 24.0% in 2025, easing to 23.5% by 2035, driven by comprehensive NHS procurement systems and emphasis on infection control and clinical quality standards. France accounts for 19.5% in 2025, rising to 20.0% by 2035, reflecting steady adoption of advanced parenteral therapy solutions and hospital modernization.
Italy holds 10.5% in 2025, expanding to 11.5% by 2035 as healthcare infrastructure investment and specialty medical applications grow. Spain contributes 7.5% in 2025, growing to 8.0% by 2035, supported by expanding hospital capacity and clinical protocol development. The Nordic countries rise from 3.5% in 2025 to 3.8% by 2035 on the back of strong patient safety adoption and advanced medical technologies. BENELUX remains at 1.0% share across both 2025 and 2035, reflecting mature, quality-focused healthcare markets.
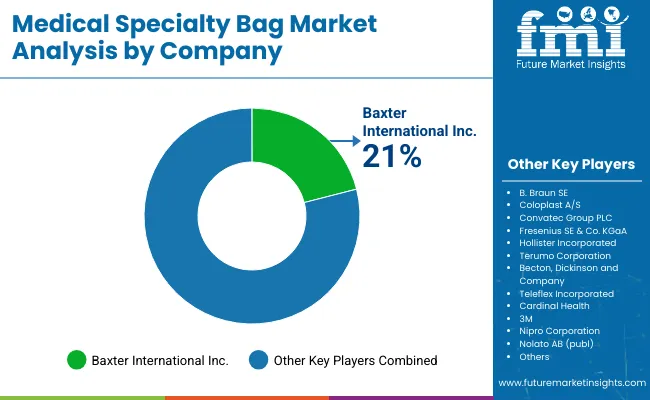
The medical specialty bag market is characterized by competition among established medical device manufacturers, specialized sterile container producers, and integrated pharmaceutical packaging companies. Companies are investing in film extrusion technologies, advanced sterilization validation systems, product innovation capabilities, and comprehensive distribution networks to deliver consistent, high-quality, and reliable medical specialty bag systems. Innovation in barrier property enhancement, port design methods, and application-specific product development is central to strengthening market position and customer satisfaction.
Baxter International Inc. leads the market with a strong focus on parenteral therapy innovation and comprehensive medical specialty bag solutions, offering clinical fluid systems with emphasis on manufacturing excellence and regulatory heritage. B. Braun Melsungen AG provides specialized infusion therapy capabilities with a focus on global hospital applications and clinical engineering networks. Fresenius Kabi AG delivers integrated pharmaceutical packaging solutions with a focus on critical care positioning and operational efficiency. ICU Medical Inc. specializes in comprehensive infusion systems with an emphasis on infection prevention applications. Terumo Corporation focuses on comprehensive blood management and transfusion containers with advanced design and premium positioning capabilities.
The success of medical specialty bags in meeting clinical fluid administration demands, patient-driven safety requirements, and performance integration will not only enhance therapeutic outcomes but also strengthen global medical device manufacturing capabilities. It will consolidate emerging regions' positions as hubs for efficient sterile container production and align advanced economies with clinical delivery systems. This calls for a concerted effort by all stakeholders -- governments, industry bodies, manufacturers, distributors, and investors. Each can be a crucial enabler in preparing the market for its next phase of growth.
How Governments Could Spur Local Production and Adoption?
How Industry Bodies Could Support Market Development?
How Distributors and Healthcare Industry Players Could Strengthen the Ecosystem?
How Manufacturers Could Navigate the Shift?
| Items | Values |
|---|---|
| Quantitative Units (2025) | USD 3.8 billion |
| Product Type | IV Fluid Bags, Blood Bags, Parenteral Nutrition Bags, Drainage Bags |
| Material Type | PVC, Non-PVC (Polypropylene, Polyethylene, EVA), Multilayer Films |
| Capacity | Below 500ml, 500ml-1L, 1L-2L, Above 2L |
| End-Use Application | Hospitals, Ambulatory Surgery Centers, Dialysis Clinics, Home Healthcare, Other Applications |
| Regions Covered | North America, Europe, Asia Pacific, Latin America, Middle East & Africa, Other Regions |
| Countries Covered | United States, Germany, United Kingdom, China, Japan, and 40+ countries |
| Key Companies Profiled | Baxter International Inc., B. Braun Melsungen AG, Fresenius Kabi AG, ICU Medical Inc., Terumo Corporation, and other leading medical specialty bag companies |
| Additional Attributes | Dollar sales by product type, material type, capacity, end-use application, and region; regional demand trends, competitive landscape, technological advancements in barrier film engineering, sterilization validation initiatives, port system enhancement programs, and premium product development strategies |
The global medical specialty bag market is estimated to be valued at USD 3.8 billion in 2025.
The market size for the medical specialty bag market is projected to reach USD 8.9 billion by 2035.
The medical specialty bag market is expected to grow at a 8.9% CAGR between 2025 and 2035.
The key product types in medical specialty bag market are iv fluid bags, blood bags, parenteral nutrition bags and drainage bags.
In terms of end-use application, hospitals segment to command 58.0% share in the medical specialty bag market in 2025.


Full Research Suite comprises of:
Market outlook & trends analysis
Interviews & case studies
Strategic recommendations
Vendor profiles & capabilities analysis
5-year forecasts
8 regions and 60+ country-level data splits
Market segment data splits
12 months of continuous data updates
DELIVERED AS:
PDF EXCEL ONLINE
Competitive Overview of Medical Specialty Bag Companies
Medical Nutrition Market Forecast and Outlook 2025 to 2035
Medical Wax Market Size and Share Forecast Outlook 2025 to 2035
Medical Plastics Market Size and Share Forecast Outlook 2025 to 2035
Medical Device Tester Market Size and Share Forecast Outlook 2025 to 2035
Medical Device Trays Market Size and Share Forecast Outlook 2025 to 2035
Medical Adhesives Market Size and Share Forecast Outlook 2025 to 2035
Medically Supervised Weight Loss Services Market Size and Share Forecast Outlook 2025 to 2035
Medical Smart Drug Cabinet Market Size and Share Forecast Outlook 2025 to 2035
Medical EMR Input Device Market Size and Share Forecast Outlook 2025 to 2035
Medical Anti-Decubitus Air Mattress Market Size and Share Forecast Outlook 2025 to 2035
Medical Gas Analyzers Market Size and Share Forecast Outlook 2025 to 2035
Medical Biodegradable Magnesium Alloy Market Size and Share Forecast Outlook 2025 to 2035
Medical Holography Market Size and Share Forecast Outlook 2025 to 2035
Medical Antiseptics Market Size and Share Forecast Outlook 2025 to 2035
Medical Implants Precision Machining Service Market Size and Share Forecast Outlook 2025 to 2035
Medical Tubing Market Size and Share Forecast Outlook 2025 to 2035
Medical Waste Liquid Collection Device Market Size and Share Forecast Outlook 2025 to 2035
Medical Home Services Market Size and Share Forecast Outlook 2025 to 2035
Medical Grade Polypropylene Market Size and Share Forecast Outlook 2025 to 2035

Thank you!
You will receive an email from our Business Development Manager. Please be sure to check your SPAM/JUNK folder too.
Chat With
MaRIA