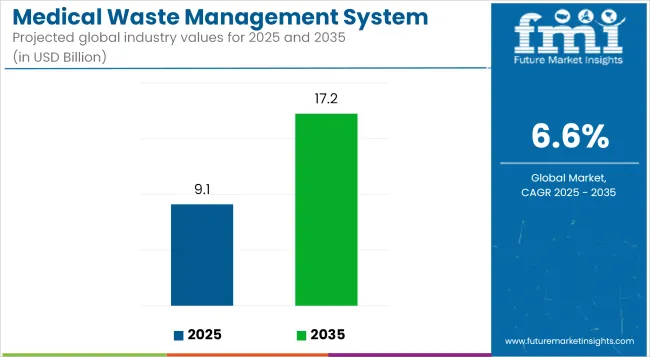
The global Medical Waste Management System Market is estimated to be valued at USD 9.1 billion in 2025 and is projected to reach USD 17.24 billion by 2035, registering a compound annual growth rate of 6.6% over the forecast period.
| Metric | Value |
|---|---|
| Industry Size (2025E) | USD 9.1 billion |
| Industry Value (2035F) | USD 17.24 billion |
| CAGR (2025 to 2035) | 6.6% |
The medical waste management system market is evolving rapidly due to stricter environmental regulations, growing healthcare infrastructure, and heightened infection control standards. Hospitals and clinics are adopting more structured, digitized, and compliant waste handling systems, with a shift toward sustainable treatment methods like thermal processing and smart logistics.
Regulatory bodies are enforcing stricter biosafety norms, encouraging traceability and accountability in medical waste streams. The focus is no longer just on disposal, but on integrating waste management as a critical component of hospital operations. Emerging economies and urban centers are reshaping procurement and treatment models to align with international health and environmental protocols, positioning medical waste management as a strategic, compliance-driven growth area in global healthcare systems.
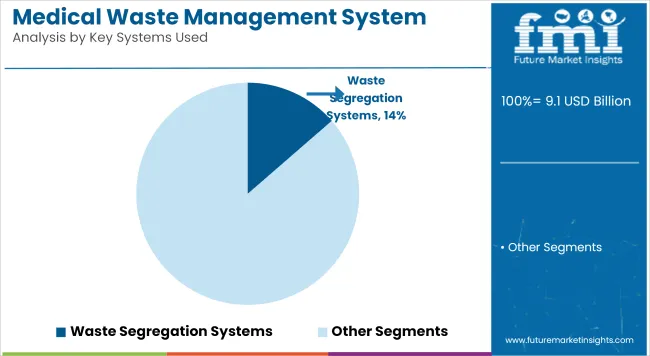
The Waste Segregation Systems segment is estimated to account for 13.6% of the total revenue in the global medical waste management system market in 2025. This dominance is being driven by growing regulatory mandates for the safe separation of medical waste at the source.
Regulatory bodies such as the World Health Organization (WHO) and the USA Environmental Protection Agency (EPA) have underscored the importance of color-coded segregation as a critical step in infection prevention. Increased awareness regarding cross-contamination risks and disease transmission has also strengthened adoption rates across both public and private healthcare settings.
Furthermore, cost-efficiencies associated with minimizing downstream treatment needs have been realized. Training programs for healthcare personnel have been increasingly emphasized to ensure proper waste identification and categorization.
Smart bin deployment and digital labeling systems are being integrated to support error-free segregation. As global healthcare waste generation rises, especially in densely populated countries, early-stage waste segregation continues to be prioritized, thereby reinforcing this segment’s leading market position.
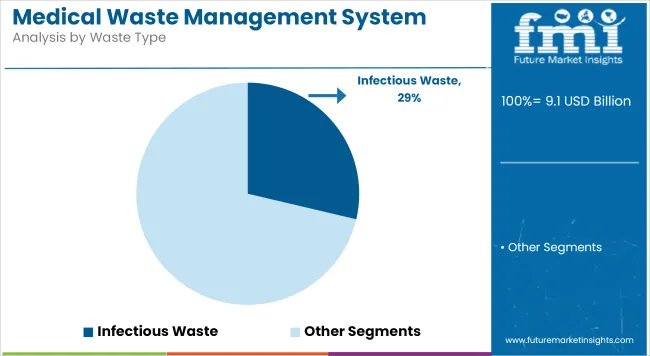
The Infectious Waste category is projected to command 28.69% of the market revenue in 2025. This segment’s leadership has been influenced by an upsurge in patient volumes, growing hospitalization rates, and the persistent threat of communicable diseases such as COVID-19, tuberculosis, and hepatitis.
According to the WHO, infectious waste can account for up to 25% of total healthcare waste in some countries, particularly where infection control protocols are not uniformly applied. Improper disposal of contaminated materials such as blood-soaked bandages, cultures, and swabs has been linked to secondary infections and public health crises.
Therefore, stricter infection control practices have been enforced, especially in developing regions undergoing rapid healthcare expansion. Moreover, pandemic preparedness initiatives have resulted in higher usage of PPE and single-use disposables, further inflating the volume of infectious waste. Due to the inherent risk it poses, this waste type has been prioritized for secure containment and safe treatment, supporting its substantial share in the market.
The Offsite Treatment segment is expected to contribute 67.80% of global market revenue in 2025, making it the most preferred method for medical waste processing. This approach has gained traction due to its cost-effectiveness, especially for smaller clinics, diagnostic centers, and research institutions that lack in-house sterilization facilities.
Centralized treatment facilities are often equipped with advanced technologies such as autoclaves, incinerators, and chemical disinfection units, enabling compliance with national and international waste disposal standards. Furthermore, offsite models offer scalability and ensure consistent quality monitoring under regulated conditions.
Government contracts and public-private partnerships have also encouraged the establishment of regional waste treatment hubs, enhancing logistical efficiency. Outsourcing waste management reduces operational complexity for healthcare providers while ensuring traceability and environmental safety. These combined advantages have solidified offsite treatment as the dominant route, especially in regions with high urban healthcare density and infrastructural readiness.
Inadequate Segregation at the Source Hinders the Adoption of Medical Waste Management System
One of the primary problems facing the medical waste management system is poor segregation at source, particularly within the low- and middle-income countries. This cross-contamination leads to more hazardous waste and non-hazardous waste being treated as infectious waste, thus incurring additional costs for processing and exposing them to risks of harming the environment. Most health facilities still employ poorly trained workers or, at best, weakly established guidelines for the safe segregation of the waste streams.
The whole setup is made worse by inadequate infrastructure and the inconsistent enforcement of regulations regarding proper collection, storage, and transport of the waste. The consequences could be dire, with grave public health implications, especially where such wastes are burnt without emission control and/or dumped illegally. An integrated response in training, investment in waste-handling infrastructure, and adherence to these laws in urban and rural settings would counter this challenge.
Integration of digital tracking and automation technologies in medical waste management systems
Digital monitoring and automation of medical waste management systems offer new possibilities for the sector. As sustainability and accountability gain prominence, intelligent systems are increasingly being adopted to allow real-time monitoring of waste generation, transport, and treatment efficacy. Such solutions foster transparency, cut operational inefficiencies, and strengthen adherence to local and global rules. Even so, technological advancement in shifting strategies towards non-incineration methods creates pathways for cleaner disposal.
Investment in these small, flexible waste management modules by startups and incumbencies for small to medium facilities is a growing trend. It seems very promising in underdeveloped nations, where the private healthcare industry is booming, being able to provide scaled, ecological solutions. Some initiatives from the government along with public-private partnership prospects will, however, further stimulate the global uptake of these sophisticated systems.
Shift Toward Onsite Waste Treatment Solutions anticipates the Growth of the Market
Hospitals and clinics are installing autoclaves, microwave disinfection, and chemotherapeutic treatment units at their facilities primarily to do away with the dangers associated with offsite transport and the long-term operating costs. This is driven by the needs of fast disposal, very strict compliance with regulations, and the necessity of dealing with infection spread during outbreak situations. Onsite systems also serve environmental interests by reducing carbon emissions caused by transporting infectious waste.
Healthcare facilities found in urban settings are shifting towards the more compact and modular units due to limited resources and space. Onsite solutions become economically sound and sustainable long-term investments for waste management, with flexibility to customize treatment capacity to facility size and amount of waste produced.
Stringent Environmental and Health Safety Regulations demonstrates the Growth of the Market
The international and national environmental authorities-mostly EPA and WHO-have made the industry's regulations on medical waste handling and disposal so stringent that they have thereafter influenced its dynamics. As a result, health institutions and waste disposal companies are improving their systems to comply with the requirements regarding emissions, hazardous waste treatment, and occupational health. Incinerators, for example, currently must be fitted with state-of-the-art pollution control technologies to meet the new standards on dioxin and furan emission.
This regulatory change has phased out old methods of disposal in favor of cleaner methods. The same is true as far as training requirements and certification procedures for waste handlers are now concerned. Compliant has emerged as a primary priority catalyst for medical centers entering into long-term engagements with licensed waste handling companies, thus strengthening the demand of the healthcare industry for professional and compliant waste handling services.
Rise in Adoption of of Circular Economy Practices
Medical waste is the influence of circular economy principles on reuse and recycling of non-contaminated, single-use materials. The most cautious hospitals and waste processors will begin reassessing their waste streams to identify materials that are safe to sterilize and can be reused, such as some plastics and packaging. Solid waste recycling for sharps containers, infusion bottles, and uncontaminated PPE is rapidly becoming mainstream.
Furthermore, eco-friendly manufacturers are producing medical products that are easier to separate and recycle. While reducing reliance on landfills, this is maximizing resource efficiency according to the sustainability goals worldwide. Nations with very stringent regulations on environmental issues, for instance Germany and Japan, are making it compulsory to segregate wastes and promote recovery of materials from health-care wastes.
Growth in Private Sector Involvement and Outsourcing
The necessitated increased complexity of medical waste rules and requirement for specialized infrastructure usually leads to outsourced waste management activities to third-party vendors. Alliances formed between small to mid-sized clinics and healthcare facilities with certified service vendors ensure cost-efficient yet compliant waste management. All services-from waste pickup, transport, sterilization, and disposal-are included in the alliances.
In developing economies, foreign investment and international interests have raised standards, especially in the provision of access to high-tech waste treatment technologies. Such private players have also introduced subscription-based and turnkey offerings, which alleviate healthcare institutions from capital-based models towards flexible, service-based model systems. This is part of the bigger phenomenon of changing towards efficiency and scalability and specialization across the world's healthcare ecosystems.
Market Outlook
A rapid increase in the quantity of sharps and hazardous waste generated by long-term care facilities and outpatient clinics is driving the USA market today. The EPA and OSHA provide oversight to ensure that stringent waste segregation and disposal procedures are followed. There are still private waste contractors, based on which their expansion is maintained increasingly, providing more and more services at home-based healthcare.
Market Growth Factors
Market Forecast
| Country | CAGR (2025 to 2035) |
|---|---|
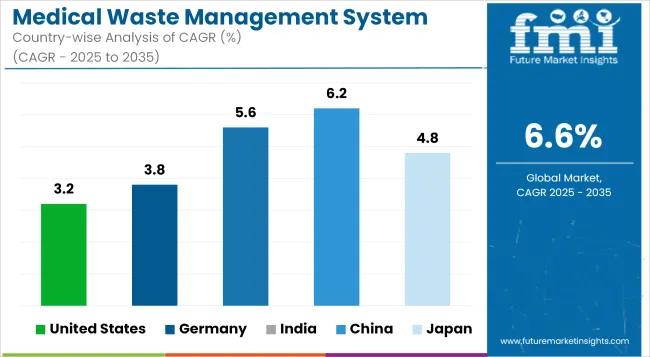
| United States | 3.2% |
Market Outlook
The KrWG (Circular Economy Act) and other such stringent environmental laws motivate innovative approaches in developing waste treatment technology. Other healthcare initiatives such as green hospitals and infection control in the healthcare sector will encourage energy-efficient autoclaves and traceable waste disposal systems. Automation and modernization of hospitals would continue to broaden the market in the future.
Market Growth Factors
Market Forecast
| Country | CAGR (2025 to 2035) |
|---|---|
| Germany | 3.8% |
Market Outlook
The demand in the medical waste market in India governs itself according to the growth of public healthcare infrastructure through Ayushman Bharat and the compliances of BMW Rules (2016). Increased awareness of infection risks and new developments in urban hospitals drive patients in tier-2 and tier-3 cities, which have the least access to solutions, toward wanting affordable, compliant solutions.
Market Growth Factors
Market Forecast
| Country | CAGR (2025 to 2035) |
|---|---|
| India | 5.6% |
Market Outlook
The rapid opening up of hospitals in China, inherited waste from COVID-19, raised the need for developing high technology-specified disposal systems in emergency times. Tightened regulation under the National Health Commission raises investments into centralized and mobile waste treatment plants. Digital waste monitoring programs and public-private partnerships in municipal waste management will also drive growth in the market.
Market Growth Drivers
Market Forecast
| Country | CAGR (2025 to 2035) |
|---|---|
| China | 6.2% |
Market Outlook
Japan produces enormous amounts of pharmaceutical and infectious wastes as a consequence of its particularly high surgical volume and aging population. The demand for sterilization-based and automated disposal systems is energized by the very zero-waste city initiatives and high-tech hospital management in this country. It turns out to have a strong market outlook owing to payoffs on recyclability and next-generation incineration with low environmental impact.
Market Growth Drivers
Market Forecast
| Country | CAGR (2025 to 2035) |
|---|---|
| Japan | 4.8% |
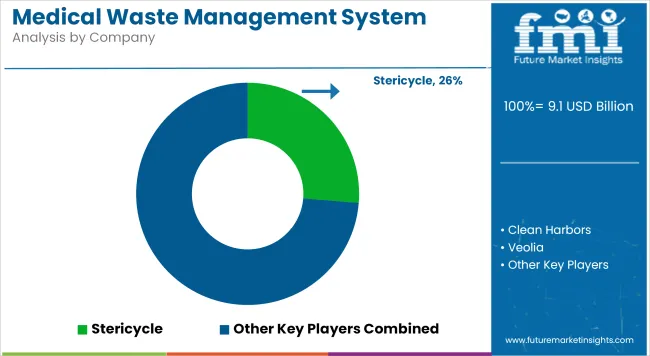
The medical waste management system market is characterized by intense competition, driven by continuous innovation, regulatory compliance, and geographic expansion strategies. Key market participants are increasingly focused on integrating digital technologies such as RFID, barcode tracking, and AI-based segregation tools to enhance operational transparency and compliance.
Strategic collaborations with healthcare institutions and waste disposal service providers are being pursued to strengthen service capabilities and improve waste traceability. Moreover, investments in mobile waste treatment units and onsite sterilization systems are gaining momentum to cater to decentralized medical facilities. Players are also actively expanding in emerging economies through regional partnerships and facility expansions, addressing growing healthcare waste volumes and regulatory demands.
Key Development:
The overall market size for medical waste management system market was USD 9.1 billion in 2025.
The medical waste management system market is expected to reach USD 17.24 billion in 2035.
Growing focus on infection control along with expansion of healthcare infrastructure in emerging markets anticipates the growth of the medical waste management system market.
The top key players that drives the development of medical waste management system market are BioMedical Waste Solutions LLC., Bondtech Medical Waste Containers, Clean Harbors, Inc., Converge Medical Solutions LLC and Medasend Biomedical, Inc.
Medical waste treatment segment by services is expected to dominate the market during the forecast period.


Full Research Suite comprises of:
Market outlook & trends analysis
Interviews & case studies
Strategic recommendations
Vendor profiles & capabilities analysis
5-year forecasts
8 regions and 60+ country-level data splits
Market segment data splits
12 months of continuous data updates
DELIVERED AS:
PDF EXCEL ONLINE
Medical Exoskeleton Market Forecast Outlook 2025 to 2035
Medical Display Market Forecast and Outlook 2025 to 2035
Medical Spa Market Size and Share Forecast Outlook 2025 to 2035
Medical Face Shield Market Forecast and Outlook 2025 to 2035
Medical Robot Market Size and Share Forecast Outlook 2025 to 2035
Medical Nutrition Market Forecast and Outlook 2025 to 2035
Medical Wax Market Size and Share Forecast Outlook 2025 to 2035
Medical Specialty Bag Market Size and Share Forecast Outlook 2025 to 2035
Medical Plastics Market Size and Share Forecast Outlook 2025 to 2035
Medical Device Tester Market Size and Share Forecast Outlook 2025 to 2035
Medical Device Trays Market Size and Share Forecast Outlook 2025 to 2035
Medical Adhesives Market Size and Share Forecast Outlook 2025 to 2035
Medically Supervised Weight Loss Services Market Size and Share Forecast Outlook 2025 to 2035
Medical Smart Drug Cabinet Market Size and Share Forecast Outlook 2025 to 2035
Medical EMR Input Device Market Size and Share Forecast Outlook 2025 to 2035
Medical Anti-Decubitus Air Mattress Market Size and Share Forecast Outlook 2025 to 2035
Medical Gas Analyzers Market Size and Share Forecast Outlook 2025 to 2035
Medical Biodegradable Magnesium Alloy Market Size and Share Forecast Outlook 2025 to 2035
Medical Holography Market Size and Share Forecast Outlook 2025 to 2035
Medical Antiseptics Market Size and Share Forecast Outlook 2025 to 2035

Thank you!
You will receive an email from our Business Development Manager. Please be sure to check your SPAM/JUNK folder too.
Chat With
MaRIA