Medical Ventilators Market Size and Share Forecast Outlook 2025 to 2035

The global medical ventilators market is estimated to be valued at USD 2,023.5 million in 2025 and is projected to reach USD 4,660.1 million by 2035, registering a CAGR of 8.7% over the forecast period.
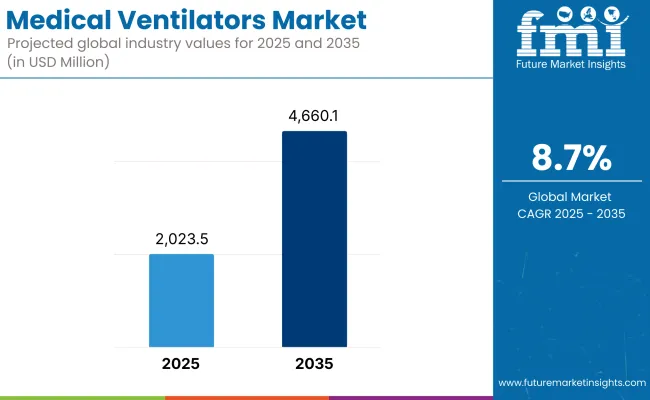
Quick Stats for Medical Ventilators Market

  • Industry Value (2025): USD 2,023.5 million
  • Forecast Value (2035): USD 4,660.1 million
  • Forecast CAGR (2025-2035): 8.7%
  • Leading Segment in 2025: Critical Care Ventilators (dominant in ICU and high-acuity applications)
  • Key Growth Regions: North America, Europe and East Asia
  • Top Key Players:
    • GE HealthCare
    • Hamilton Medical
    • Getinge AB (Maquet Holding B.V. & Co. KG)
    • Fisher & Paykel Healthcare Limited
    • Koninklijke Philips N.V.
    • Smiths Medical
    • NIHON KOHDEN CORPORATION
    • ResMed
    • Shenzen Mindray Bio-Medical Electronics
    • Drägerwerk AG & Co. KGaA
    • Air Liquide Medical Systems
Metric Value
Market Size (2025E) USD 2,023.5 million
Market Value (2035F) USD 4,660.1 million
CAGR (2025 to 2035) 8.7%

The medical ventilators market has been shaped by sustained demand for advanced respiratory support solutions across critical care, emergency response, and perioperative settings. Heightened awareness of respiratory health and preparedness for pandemics has driven substantial investments in ventilator manufacturing capacity and technology upgrades.

Healthcare providers have prioritized procurement of devices with enhanced monitoring capabilities, integration with electronic health records, and improved patient safety features. Manufacturers have responded by developing versatile platforms capable of both invasive and non-invasive ventilation modes, addressing a spectrum of patient acuity levels. Hospitals have increasingly adopted ventilators with intelligent modes and closed-loop control algorithms to optimize oxygen delivery and weaning protocols.

Proposals for portable ventilators, smart respiratory sensors, and telemedicine-enabled remotely controlled ventilators improve patient care, portability, and ease of use. The emergence of home-based ventilator therapy, hybrid ventilation models, and integrated oxygen therapy solutions provides additional market prospects.
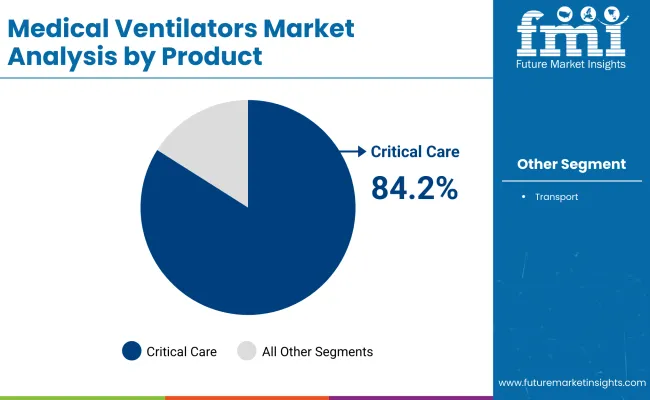
Analyzing Medical Ventilators Market by Top Investment Segments

Critical Care Ventilators Dominate the Market with Emphasis on Advanced Monitoring and High-Acuity Patient Support

In 2025, Critical Care Ventilators is estimated to hold a revenue share of 84.2% which has been attributed to their essential role in managing severe respiratory failure and complex patient conditions. Advances in sensor technologies and closed-loop control systems have enhanced the safety and effectiveness of critical care ventilators, supporting clinician confidence in high-acuity environments.

Manufacturers have invested in developing modular platforms with multiple ventilation modes, ensuring adaptability across diverse patient populations and clinical scenarios. Procurement decisions have been influenced by regulatory standards and accreditation requirements that mandate the availability of advanced ventilator support capabilities.
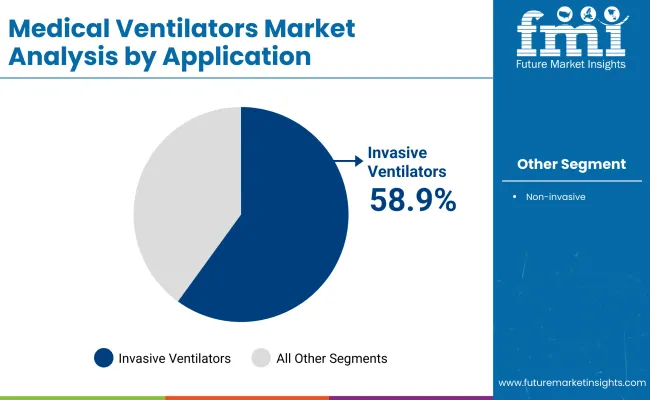
Invasive Ventilators Lead the Market with Persistent Demand for Secure Airway Management in Severe Respiratory Failure

Invasive Ventilators is estimated to dominate the market with a revenue share of 58.9% has been attributed to their established role as the primary modality for managing acute respiratory distress and perioperative ventilation. Clinical protocols in intensive care and surgical units have consistently recommended invasive ventilation for cases requiring prolonged support or precise control of tidal volume and pressure parameters.

Technological improvements have been directed toward enhancing alarm systems, infection control measures, and integration with patient monitoring platforms. These factors collectively maintained invasive ventilators as the dominant technology segment, with continued growth expected as chronic respiratory disease prevalence increases globally.

Hospitals Anchor the Market with Centralized Critical Care Delivery and Investment in Advanced Ventilation Technologies

Hospitals have accounted for 72.5% of market revenue, driven by their role as primary providers of advanced respiratory care and intensive monitoring. Adoption has been supported by sustained investment in critical care infrastructure, including dedicated ICU expansion and modernization of ventilator fleets.

Procurement strategies have prioritized devices offering comprehensive ventilation modes, integrated data management, and compatibility with hospital information systems. Regulatory and accreditation requirements have further reinforced hospitals’ role as the central hub for ventilator utilization.

Challenges and Opportunities

Challenges

High Costs and Access Limitations

Medical ventilators not only provide lung ventilation but also prevent death of patients; however, high cost, unavailability in developing countries, expensive use of advanced ventilators, and risks of ventilator-associated pneumonia (VAP) remain major challenges. Moreover, raw material sourcing issues for ventilator production in the supply chain also affect stability in the market.

Opportunities

AI-Powered Ventilation and Home-Based Respiratory Care

The growth of this market is driven by the increasing adoption of AI-powered respiratory monitoring, Portable home-use ventilators, and Autonomously controlled Smart ventilator technologies. Long-term market growth is anticipated to be fueled by developments in wireless remote-controlled ventilators, real-time oxygen saturation analytics, and hybrid models of respiratory therapy.

Furthermore, an increase in sustainable, energy-efficient ventilator activities and smart Intensive Care Unit (ICU) automation, as well as the provision of environmentally sound emergency health plans by certain governments, are also contributing to the rising demand for next-generation ventilators.
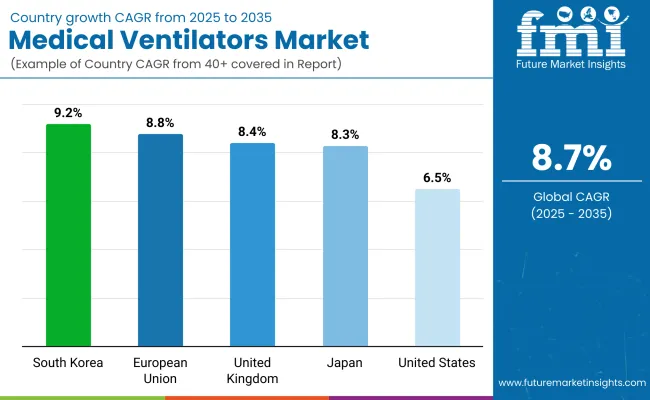
Country-wise Outlook

United States

The USA will continue to dominate the medical ventilators market due to the high demand in critical care settings for respiratory support, the increase in prevalence of respiratory diseases, including COPD and ARDS, and an increase in investments in advanced technologies for life-support systems.

The growing demand further drives the market, need for portable and non-invasive solutions, as well as AI-integrated patient-monitoring systems. In addition, recent advances in high-flow oxygen therapy, variable-controlled ventilatory modes, and remotely-operated ventilators are leading to further improvements in patient outcomes. Telemedicine's growing role in critical care and the use of real-time data analytics in ventilator management are among trends shaping the industry.

Country CAGR (2025 to 2035)
United States 9.0%

United Kingdom

The UK Medical Ventilators market is poised to grow at steady rates over the forecast period due to the increasing investments in healthcare infrastructure, growing demand for home-based ventilation solutions, and increasing regulations on emergency preparedness for respiratory pandemics. Market adoption is propelled by the penetration of smart ventilators with remote connectivity and automated adjustment of oxygen levels.

Moreover, the growing application of compact, wearable, and battery-operated ventilators in long-term respiratory care settings is also driving the market growth. The movement toward AI-assisted ventilator management and predictive maintenance for hospital ICU equipment is additionally driving industry growth.

Country CAGR (2025 to 2035)
United Kingdom 8.4%

European Union

The European Union medical ventilators market primarily includes Germany, France, and Italy, wherein Germany possesses the maximum market share in the medical ventilators market, owing to the prevailing growth in modernization of healthcare infrastructure, high penetration in the adoption of non-invasive ventilation, and increasing prevalence of chronic respiratory disorders.

The European Union (EU) is committed to advancing digital health transformation, embracing embedded artificial intelligence (AI), using it in areas like ventilatory support and making integrated patient monitoring systems more efficient, with the end goal of getting the technology to market faster.

Moreover, the industry's innovation is on a surge, owing to the development of precise oxygen delivery with sensor-based ventilator technologies and advancement in lung-protecting ventilation strategies. The increasing adoption of tele-ICU solutions and cloud-based ventilator fleet management in hospitals is also contributing to the market growth.

Region CAGR (2025 to 2035)
European Union 8.8%

Japan

The growth of Japan’s medical ventilators market can be attributed to factors such as an increasing elderly population demanding high-efficiency ventilators, rising investments in developing AI-integrated respiratory support devices, and strong governmental funding for emergency medical preparedness.

The country’s leadership in robotic-assisted healthcare is spurring advances in automated ventilator control and real-time respiratory surveillance. Another trend in the industry is the advent of machine learning algorithms for optimizing the use of the ventilator and weaning protocols for patients. Additionally, the proliferation of compact, quiet, and energy-efficient ventilator models for use in homecare environments is likely to further fuel demand for ventilation devices in the coming years.

Country CAGR (2025 to 2035)
Japan 8.3%

South Korea

The combination of the country’s focus on smart ventilation technology and remote patient monitoring systems is fuelling demand for next-generation ventilators. Furthermore, developing automated ventilator-tuning algorithms, real-time recording of oxygenation rates, and implementing IoT-based ventilator management systems are increasing market availability. This is further propelling the growth of the market for activities, such as the rise of ventilator rental services, as well as homecare ventilation solutions.

Country CAGR (2025 to 2035)
South Korea 9.2%

Competitive Outlook

The medical ventilators market is anticipated to be pushed by rising needs for critical care respiratory care, technological improvements in ventilator technology, and the increasing incidence of respiratory ailments like COPD, asthma, and issues similar to COVID-19.

The market is growing steadily, with widening applications in hospitals, home healthcare, and emergency medical services. Some of the key trends that are driving the industry include AI-enabled ventilators, portable and homecare ventilators, and improved patient monitoring ability.

Key Development

In 2024, Air Liquide Medical Systems launched Monnal™ TEO, a new resuscitation ventilator offering its brand new ICU ventilator entirely designed and manufactured in France

In 2024, Mindray launched its new line of transport ventilators, the TV50 and TV80, at the 7th EuroAsia Conference.

Companies

  • GE HealthCare
  • Hamilton Medical
  • Getinge AB (Maquet Holding B.V. & Co. KG)
  • Fisher & Paykel Healthcare Limited
  • Koninklijke Philips N.V.
  • Smiths Medical
  • NIHON KOHDEN CORPORATION
  • ResMed
  • Shenzen Mindray Bio-Medical Electronics
  • Drägerwerk AG & Co. KGaA
  • "Air Liquide Medical Systems"

Key Segmentation

By Product:

  • Critical Care Ventilators
  • Transport Ventilators

By Application:

  • Invasive Ventilators
  • Non-invasive Ventilators

By End User:

  • Hospitals
  • Ambulatory Surgical Centers
  • Long Term Care Centers
  • Home Care Settings

By Region:

  • North America
  • Latin America
  • Western Europe
  • Eastern Europe
  • East Asia
  • South Asia Pacific
  • Middle East and Africa

Table of Content

  1. Executive Summary
  2. Industry Introduction, including Taxonomy and Market Definition
  3. Market Trends and Success Factors, including Macro-Economic Factors, Market Dynamics, and Recent Industry Developments
  4. Global Market Demand Analysis 2020 to 2024 and Forecast 2025 to 2035, including Historical Analysis and Future Projections
  5. Global Market Analysis 2020 to 2024 and Forecast 2025 to 2035
    • Product
    • Application
    • End User
  6. Global Market Analysis 2020 to 2024 and Forecast 2025 to 2035, By Product
    • Critical Care Ventilators
    • Transport Ventilators
  7. Global Market Analysis 2020 to 2024 and Forecast 2025 to 2035, By Application
    • Invasive Ventilators
    • Non-invasive Ventilators
  8. Global Market Analysis 2020 to 2024 and Forecast 2025 to 2035, By End User
    • Hospitals
    • Ambulatory Surgical Centers
    • Long Term Care Centers
    • Home Care Settings
  9. Global Market Analysis 2020 to 2024 and Forecast 2025 to 2035, By Region
    • North America
    • Latin America
    • Western Europe
    • Eastern Europe
    • East Asia
    • South Asia Pacific
    • Middle East and Africa
  10. North America Sales Analysis 2020 to 2024 and Forecast 2025 to 2035, by Key Segments and Countries
  11. Latin America Sales Analysis 2020 to 2024 and Forecast 2025 to 2035, by Key Segments and Countries
  12. Western Europe Sales Analysis 2020 to 2024 and Forecast 2025 to 2035, by Key Segments and Countries
  13. Eastern Europe Sales Analysis 2020 to 2024 and Forecast 2025 to 2035, by Key Segments and Countries
  14. East Asia Sales Analysis 2020 to 2024 and Forecast 2025 to 2035, by Key Segments and Countries
  15. South Asia Pacific Sales Analysis 2020 to 2024 and Forecast 2025 to 2035, by Key Segments and Countries
  16. Middle East and Africa Sales Analysis 2020 to 2024 and Forecast 2025 to 2035, by Key Segments and Countries
  17. Sales Forecast 2025 to 2035 by Product, Application, and End User for 30 Countries
  18. Competition Outlook, including Market Structure Analysis, Company Share Analysis by Key Players, and Competition Dashboard
  19. Company Profile
    • Medtronic plc
    • Philips Healthcare
    • ResMed Inc.
    • GE Healthcare
    • Drägerwerk AG & Co. KGaA
    • Hamilton Medical AG
    • Fisher & Paykel Healthcare
    • Smiths Group plc
    • Vyaire Medical, Inc.
    • Becton, Dickinson and Company (BD)

List of Tables

  • Table 1: Global Market Value (USD Million) Forecast by Region, 2020 to 2035
  • Table 2: Global Market Volume (Units) Forecast by Region, 2020 to 2035
  • Table 3: Global Market Value (USD Million) Forecast by Product Type, 2020 to 2035
  • Table 4: Global Market Volume (Units) Forecast by Product Type, 2020 to 2035
  • Table 5: Global Market Value (USD Million) Forecast by Application, 2020 to 2035
  • Table 6: Global Market Volume (Units) Forecast by Application, 2020 to 2035
  • Table 7: Global Market Value (USD Million) Forecast by End User, 2020 to 2035
  • Table 8: Global Market Volume (Units) Forecast by End User, 2020 to 2035
  • Table 9: North America Market Value (USD Million) Forecast by Country, 2020 to 2035
  • Table 10: North America Market Volume (Units) Forecast by Country, 2020 to 2035
  • Table 11: North America Market Value (USD Million) Forecast by Product Type, 2020 to 2035
  • Table 12: North America Market Volume (Units) Forecast by Product Type, 2020 to 2035
  • Table 13: North America Market Value (USD Million) Forecast by Application, 2020 to 2035
  • Table 14: North America Market Volume (Units) Forecast by Application, 2020 to 2035
  • Table 15: North America Market Value (USD Million) Forecast by End User, 2020 to 2035
  • Table 16: North America Market Volume (Units) Forecast by End User, 2020 to 2035
  • Table 17: Latin America Market Value (USD Million) Forecast by Country, 2020 to 2035
  • Table 18: Latin America Market Volume (Units) Forecast by Country, 2020 to 2035
  • Table 19: Latin America Market Value (USD Million) Forecast by Product Type, 2020 to 2035
  • Table 20: Latin America Market Volume (Units) Forecast by Product Type, 2020 to 2035
  • Table 21: Latin America Market Value (USD Million) Forecast by Application, 2020 to 2035
  • Table 22: Latin America Market Volume (Units) Forecast by Application, 2020 to 2035
  • Table 23: Latin America Market Value (USD Million) Forecast by End User, 2020 to 2035
  • Table 24: Latin America Market Volume (Units) Forecast by End User, 2020 to 2035
  • Table 25: Europe Market Value (USD Million) Forecast by Country, 2020 to 2035
  • Table 26: Europe Market Volume (Units) Forecast by Country, 2020 to 2035
  • Table 27: Europe Market Value (USD Million) Forecast by Product Type, 2020 to 2035
  • Table 28: Europe Market Volume (Units) Forecast by Product Type, 2020 to 2035
  • Table 29: Europe Market Value (USD Million) Forecast by Application, 2020 to 2035
  • Table 30: Europe Market Volume (Units) Forecast by Application, 2020 to 2035
  • Table 31: Europe Market Value (USD Million) Forecast by End User, 2020 to 2035
  • Table 32: Europe Market Volume (Units) Forecast by End User, 2020 to 2035
  • Table 33: East Asia Market Value (USD Million) Forecast by Country, 2020 to 2035
  • Table 34: East Asia Market Volume (Units) Forecast by Country, 2020 to 2035
  • Table 35: East Asia Market Value (USD Million) Forecast by Product Type, 2020 to 2035
  • Table 36: East Asia Market Volume (Units) Forecast by Product Type, 2020 to 2035
  • Table 37: East Asia Market Value (USD Million) Forecast by Application, 2020 to 2035
  • Table 38: East Asia Market Volume (Units) Forecast by Application, 2020 to 2035
  • Table 39: East Asia Market Value (USD Million) Forecast by End User, 2020 to 2035
  • Table 40: East Asia Market Volume (Units) Forecast by End User, 2020 to 2035
  • Table 41: South Asia Market Value (USD Million) Forecast by Country, 2020 to 2035
  • Table 42: South Asia Market Volume (Units) Forecast by Country, 2020 to 2035
  • Table 43: South Asia Market Value (USD Million) Forecast by Product Type, 2020 to 2035
  • Table 44: South Asia Market Volume (Units) Forecast by Product Type, 2020 to 2035
  • Table 45: South Asia Market Value (USD Million) Forecast by Application, 2020 to 2035
  • Table 46: South Asia Market Volume (Units) Forecast by Application, 2020 to 2035
  • Table 47: South Asia Market Value (USD Million) Forecast by End User, 2020 to 2035
  • Table 48: South Asia Market Volume (Units) Forecast by End User, 2020 to 2035
  • Table 49: Oceania Market Value (USD Million) Forecast by Country, 2020 to 2035
  • Table 50: Oceania Market Volume (Units) Forecast by Country, 2020 to 2035
  • Table 51: Oceania Market Value (USD Million) Forecast by Product Type, 2020 to 2035
  • Table 52: Oceania Market Volume (Units) Forecast by Product Type, 2020 to 2035
  • Table 53: Oceania Market Value (USD Million) Forecast by Application, 2020 to 2035
  • Table 54: Oceania Market Volume (Units) Forecast by Application, 2020 to 2035
  • Table 55: Oceania Market Value (USD Million) Forecast by End User, 2020 to 2035
  • Table 56: Oceania Market Volume (Units) Forecast by End User, 2020 to 2035
  • Table 57: Middle East and Africa Market Value (USD Million) Forecast by Country, 2020 to 2035
  • Table 58: Middle East and Africa Market Volume (Units) Forecast by Country, 2020 to 2035
  • Table 59: Middle East and Africa Market Value (USD Million) Forecast by Product Type, 2020 to 2035
  • Table 60: Middle East and Africa Market Volume (Units) Forecast by Product Type, 2020 to 2035
  • Table 61: Middle East and Africa Market Value (USD Million) Forecast by Application, 2020 to 2035
  • Table 62: Middle East and Africa Market Volume (Units) Forecast by Application, 2020 to 2035
  • Table 63: Middle East and Africa Market Value (USD Million) Forecast by End User, 2020 to 2035
  • Table 64: Middle East and Africa Market Volume (Units) Forecast by End User, 2020 to 2035

List of Figures

  • Figure 1: Global Market Value (USD Million) by Product Type, 2025 to 2035
  • Figure 2: Global Market Value (USD Million) by Application, 2025 to 2035
  • Figure 3: Global Market Value (USD Million) by End User, 2025 to 2035
  • Figure 4: Global Market Value (USD Million) by Region, 2025 to 2035
  • Figure 5: Global Market Value (USD Million) Analysis by Region, 2020 to 2035
  • Figure 6: Global Market Volume (Units) Analysis by Region, 2020 to 2035
  • Figure 7: Global Market Value Share (%) and BPS Analysis by Region, 2025 to 2035
  • Figure 8: Global Market Y-o-Y Growth (%) Projections by Region, 2025 to 2035
  • Figure 9: Global Market Value (USD Million) Analysis by Product Type, 2020 to 2035
  • Figure 10: Global Market Volume (Units) Analysis by Product Type, 2020 to 2035
  • Figure 11: Global Market Value Share (%) and BPS Analysis by Product Type, 2025 to 2035
  • Figure 12: Global Market Y-o-Y Growth (%) Projections by Product Type, 2025 to 2035
  • Figure 13: Global Market Value (USD Million) Analysis by Application, 2020 to 2035
  • Figure 14: Global Market Volume (Units) Analysis by Application, 2020 to 2035
  • Figure 15: Global Market Value Share (%) and BPS Analysis by Application, 2025 to 2035
  • Figure 16: Global Market Y-o-Y Growth (%) Projections by Application, 2025 to 2035
  • Figure 17: Global Market Value (USD Million) Analysis by End User, 2020 to 2035
  • Figure 18: Global Market Volume (Units) Analysis by End User, 2020 to 2035
  • Figure 19: Global Market Value Share (%) and BPS Analysis by End User, 2025 to 2035
  • Figure 20: Global Market Y-o-Y Growth (%) Projections by End User, 2025 to 2035
  • Figure 21: Global Market Attractiveness by Product Type, 2025 to 2035
  • Figure 22: Global Market Attractiveness by Application, 2025 to 2035
  • Figure 23: Global Market Attractiveness by End User, 2025 to 2035
  • Figure 24: Global Market Attractiveness by Region, 2025 to 2035
  • Figure 25: North America Market Value (USD Million) by Product Type, 2025 to 2035
  • Figure 26: North America Market Value (USD Million) by Application, 2025 to 2035
  • Figure 27: North America Market Value (USD Million) by End User, 2025 to 2035
  • Figure 28: North America Market Value (USD Million) by Country, 2025 to 2035
  • Figure 29: North America Market Value (USD Million) Analysis by Country, 2020 to 2035
  • Figure 30: North America Market Volume (Units) Analysis by Country, 2020 to 2035
  • Figure 31: North America Market Value Share (%) and BPS Analysis by Country, 2025 to 2035
  • Figure 32: North America Market Y-o-Y Growth (%) Projections by Country, 2025 to 2035
  • Figure 33: North America Market Value (USD Million) Analysis by Product Type, 2020 to 2035
  • Figure 34: North America Market Volume (Units) Analysis by Product Type, 2020 to 2035
  • Figure 35: North America Market Value Share (%) and BPS Analysis by Product Type, 2025 to 2035
  • Figure 36: North America Market Y-o-Y Growth (%) Projections by Product Type, 2025 to 2035
  • Figure 37: North America Market Value (USD Million) Analysis by Application, 2020 to 2035
  • Figure 38: North America Market Volume (Units) Analysis by Application, 2020 to 2035
  • Figure 39: North America Market Value Share (%) and BPS Analysis by Application, 2025 to 2035
  • Figure 40: North America Market Y-o-Y Growth (%) Projections by Application, 2025 to 2035
  • Figure 41: North America Market Value (USD Million) Analysis by End User, 2020 to 2035
  • Figure 42: North America Market Volume (Units) Analysis by End User, 2020 to 2035
  • Figure 43: North America Market Value Share (%) and BPS Analysis by End User, 2025 to 2035
  • Figure 44: North America Market Y-o-Y Growth (%) Projections by End User, 2025 to 2035
  • Figure 45: North America Market Attractiveness by Product Type, 2025 to 2035
  • Figure 46: North America Market Attractiveness by Application, 2025 to 2035
  • Figure 47: North America Market Attractiveness by End User, 2025 to 2035
  • Figure 48: North America Market Attractiveness by Country, 2025 to 2035
  • Figure 49: Latin America Market Value (USD Million) by Product Type, 2025 to 2035
  • Figure 50: Latin America Market Value (USD Million) by Application, 2025 to 2035
  • Figure 51: Latin America Market Value (USD Million) by End User, 2025 to 2035
  • Figure 52: Latin America Market Value (USD Million) by Country, 2025 to 2035
  • Figure 53: Latin America Market Value (USD Million) Analysis by Country, 2020 to 2035
  • Figure 54: Latin America Market Volume (Units) Analysis by Country, 2020 to 2035
  • Figure 55: Latin America Market Value Share (%) and BPS Analysis by Country, 2025 to 2035
  • Figure 56: Latin America Market Y-o-Y Growth (%) Projections by Country, 2025 to 2035
  • Figure 57: Latin America Market Value (USD Million) Analysis by Product Type, 2020 to 2035
  • Figure 58: Latin America Market Volume (Units) Analysis by Product Type, 2020 to 2035
  • Figure 59: Latin America Market Value Share (%) and BPS Analysis by Product Type, 2025 to 2035
  • Figure 60: Latin America Market Y-o-Y Growth (%) Projections by Product Type, 2025 to 2035
  • Figure 61: Latin America Market Value (USD Million) Analysis by Application, 2020 to 2035
  • Figure 62: Latin America Market Volume (Units) Analysis by Application, 2020 to 2035
  • Figure 63: Latin America Market Value Share (%) and BPS Analysis by Application, 2025 to 2035
  • Figure 64: Latin America Market Y-o-Y Growth (%) Projections by Application, 2025 to 2035
  • Figure 65: Latin America Market Value (USD Million) Analysis by End User, 2020 to 2035
  • Figure 66: Latin America Market Volume (Units) Analysis by End User, 2020 to 2035
  • Figure 67: Latin America Market Value Share (%) and BPS Analysis by End User, 2025 to 2035
  • Figure 68: Latin America Market Y-o-Y Growth (%) Projections by End User, 2025 to 2035
  • Figure 69: Latin America Market Attractiveness by Product Type, 2025 to 2035
  • Figure 70: Latin America Market Attractiveness by Application, 2025 to 2035
  • Figure 71: Latin America Market Attractiveness by End User, 2025 to 2035
  • Figure 72: Latin America Market Attractiveness by Country, 2025 to 2035
  • Figure 73: Europe Market Value (USD Million) by Product Type, 2025 to 2035
  • Figure 74: Europe Market Value (USD Million) by Application, 2025 to 2035
  • Figure 75: Europe Market Value (USD Million) by End User, 2025 to 2035
  • Figure 76: Europe Market Value (USD Million) by Country, 2025 to 2035
  • Figure 77: Europe Market Value (USD Million) Analysis by Country, 2020 to 2035
  • Figure 78: Europe Market Volume (Units) Analysis by Country, 2020 to 2035
  • Figure 79: Europe Market Value Share (%) and BPS Analysis by Country, 2025 to 2035
  • Figure 80: Europe Market Y-o-Y Growth (%) Projections by Country, 2025 to 2035
  • Figure 81: Europe Market Value (USD Million) Analysis by Product Type, 2020 to 2035
  • Figure 82: Europe Market Volume (Units) Analysis by Product Type, 2020 to 2035
  • Figure 83: Europe Market Value Share (%) and BPS Analysis by Product Type, 2025 to 2035
  • Figure 84: Europe Market Y-o-Y Growth (%) Projections by Product Type, 2025 to 2035
  • Figure 85: Europe Market Value (USD Million) Analysis by Application, 2020 to 2035
  • Figure 86: Europe Market Volume (Units) Analysis by Application, 2020 to 2035
  • Figure 87: Europe Market Value Share (%) and BPS Analysis by Application, 2025 to 2035
  • Figure 88: Europe Market Y-o-Y Growth (%) Projections by Application, 2025 to 2035
  • Figure 89: Europe Market Value (USD Million) Analysis by End User, 2020 to 2035
  • Figure 90: Europe Market Volume (Units) Analysis by End User, 2020 to 2035
  • Figure 91: Europe Market Value Share (%) and BPS Analysis by End User, 2025 to 2035
  • Figure 92: Europe Market Y-o-Y Growth (%) Projections by End User, 2025 to 2035
  • Figure 93: Europe Market Attractiveness by Product Type, 2025 to 2035
  • Figure 94: Europe Market Attractiveness by Application, 2025 to 2035
  • Figure 95: Europe Market Attractiveness by End User, 2025 to 2035
  • Figure 96: Europe Market Attractiveness by Country, 2025 to 2035
  • Figure 97: East Asia Market Value (USD Million) by Product Type, 2025 to 2035
  • Figure 98: East Asia Market Value (USD Million) by Application, 2025 to 2035
  • Figure 99: East Asia Market Value (USD Million) by End User, 2025 to 2035
  • Figure 100: East Asia Market Value (USD Million) by Country, 2025 to 2035
  • Figure 101: East Asia Market Value (USD Million) Analysis by Country, 2020 to 2035
  • Figure 102: East Asia Market Volume (Units) Analysis by Country, 2020 to 2035
  • Figure 103: East Asia Market Value Share (%) and BPS Analysis by Country, 2025 to 2035
  • Figure 104: East Asia Market Y-o-Y Growth (%) Projections by Country, 2025 to 2035
  • Figure 105: East Asia Market Value (USD Million) Analysis by Product Type, 2020 to 2035
  • Figure 106: East Asia Market Volume (Units) Analysis by Product Type, 2020 to 2035
  • Figure 107: East Asia Market Value Share (%) and BPS Analysis by Product Type, 2025 to 2035
  • Figure 108: East Asia Market Y-o-Y Growth (%) Projections by Product Type, 2025 to 2035
  • Figure 109: East Asia Market Value (USD Million) Analysis by Application, 2020 to 2035
  • Figure 110: East Asia Market Volume (Units) Analysis by Application, 2020 to 2035
  • Figure 111: East Asia Market Value Share (%) and BPS Analysis by Application, 2025 to 2035
  • Figure 112: East Asia Market Y-o-Y Growth (%) Projections by Application, 2025 to 2035
  • Figure 113: East Asia Market Value (USD Million) Analysis by End User, 2020 to 2035
  • Figure 114: East Asia Market Volume (Units) Analysis by End User, 2020 to 2035
  • Figure 115: East Asia Market Value Share (%) and BPS Analysis by End User, 2025 to 2035
  • Figure 116: East Asia Market Y-o-Y Growth (%) Projections by End User, 2025 to 2035
  • Figure 117: East Asia Market Attractiveness by Product Type, 2025 to 2035
  • Figure 118: East Asia Market Attractiveness by Application, 2025 to 2035
  • Figure 119: East Asia Market Attractiveness by End User, 2025 to 2035
  • Figure 120: East Asia Market Attractiveness by Country, 2025 to 2035
  • Figure 121: South Asia Market Value (USD Million) by Product Type, 2025 to 2035
  • Figure 122: South Asia Market Value (USD Million) by Application, 2025 to 2035
  • Figure 123: South Asia Market Value (USD Million) by End User, 2025 to 2035
  • Figure 124: South Asia Market Value (USD Million) by Country, 2025 to 2035
  • Figure 125: South Asia Market Value (USD Million) Analysis by Country, 2020 to 2035
  • Figure 126: South Asia Market Volume (Units) Analysis by Country, 2020 to 2035
  • Figure 127: South Asia Market Value Share (%) and BPS Analysis by Country, 2025 to 2035
  • Figure 128: South Asia Market Y-o-Y Growth (%) Projections by Country, 2025 to 2035
  • Figure 129: South Asia Market Value (USD Million) Analysis by Product Type, 2020 to 2035
  • Figure 130: South Asia Market Volume (Units) Analysis by Product Type, 2020 to 2035
  • Figure 131: South Asia Market Value Share (%) and BPS Analysis by Product Type, 2025 to 2035
  • Figure 132: South Asia Market Y-o-Y Growth (%) Projections by Product Type, 2025 to 2035
  • Figure 133: South Asia Market Value (USD Million) Analysis by Application, 2020 to 2035
  • Figure 134: South Asia Market Volume (Units) Analysis by Application, 2020 to 2035
  • Figure 135: South Asia Market Value Share (%) and BPS Analysis by Application, 2025 to 2035
  • Figure 136: South Asia Market Y-o-Y Growth (%) Projections by Application, 2025 to 2035
  • Figure 137: South Asia Market Value (USD Million) Analysis by End User, 2020 to 2035
  • Figure 138: South Asia Market Volume (Units) Analysis by End User, 2020 to 2035
  • Figure 139: South Asia Market Value Share (%) and BPS Analysis by End User, 2025 to 2035
  • Figure 140: South Asia Market Y-o-Y Growth (%) Projections by End User, 2025 to 2035
  • Figure 141: South Asia Market Attractiveness by Product Type, 2025 to 2035
  • Figure 142: South Asia Market Attractiveness by Application, 2025 to 2035
  • Figure 143: South Asia Market Attractiveness by End User, 2025 to 2035
  • Figure 144: South Asia Market Attractiveness by Country, 2025 to 2035
  • Figure 145: Oceania Market Value (USD Million) by Product Type, 2025 to 2035
  • Figure 146: Oceania Market Value (USD Million) by Application, 2025 to 2035
  • Figure 147: Oceania Market Value (USD Million) by End User, 2025 to 2035
  • Figure 148: Oceania Market Value (USD Million) by Country, 2025 to 2035
  • Figure 149: Oceania Market Value (USD Million) Analysis by Country, 2020 to 2035
  • Figure 150: Oceania Market Volume (Units) Analysis by Country, 2020 to 2035
  • Figure 151: Oceania Market Value Share (%) and BPS Analysis by Country, 2025 to 2035
  • Figure 152: Oceania Market Y-o-Y Growth (%) Projections by Country, 2025 to 2035
  • Figure 153: Oceania Market Value (USD Million) Analysis by Product Type, 2020 to 2035
  • Figure 154: Oceania Market Volume (Units) Analysis by Product Type, 2020 to 2035
  • Figure 155: Oceania Market Value Share (%) and BPS Analysis by Product Type, 2025 to 2035
  • Figure 156: Oceania Market Y-o-Y Growth (%) Projections by Product Type, 2025 to 2035
  • Figure 157: Oceania Market Value (USD Million) Analysis by Application, 2020 to 2035
  • Figure 158: Oceania Market Volume (Units) Analysis by Application, 2020 to 2035
  • Figure 159: Oceania Market Value Share (%) and BPS Analysis by Application, 2025 to 2035
  • Figure 160: Oceania Market Y-o-Y Growth (%) Projections by Application, 2025 to 2035
  • Figure 161: Oceania Market Value (USD Million) Analysis by End User, 2020 to 2035
  • Figure 162: Oceania Market Volume (Units) Analysis by End User, 2020 to 2035
  • Figure 163: Oceania Market Value Share (%) and BPS Analysis by End User, 2025 to 2035
  • Figure 164: Oceania Market Y-o-Y Growth (%) Projections by End User, 2025 to 2035
  • Figure 165: Oceania Market Attractiveness by Product Type, 2025 to 2035
  • Figure 166: Oceania Market Attractiveness by Application, 2025 to 2035
  • Figure 167: Oceania Market Attractiveness by End User, 2025 to 2035
  • Figure 168: Oceania Market Attractiveness by Country, 2025 to 2035
  • Figure 169: Middle East and Africa Market Value (USD Million) by Product Type, 2025 to 2035
  • Figure 170: Middle East and Africa Market Value (USD Million) by Application, 2025 to 2035
  • Figure 171: Middle East and Africa Market Value (USD Million) by End User, 2025 to 2035
  • Figure 172: Middle East and Africa Market Value (USD Million) by Country, 2025 to 2035
  • Figure 173: Middle East and Africa Market Value (USD Million) Analysis by Country, 2020 to 2035
  • Figure 174: Middle East and Africa Market Volume (Units) Analysis by Country, 2020 to 2035
  • Figure 175: Middle East and Africa Market Value Share (%) and BPS Analysis by Country, 2025 to 2035
  • Figure 176: Middle East and Africa Market Y-o-Y Growth (%) Projections by Country, 2025 to 2035
  • Figure 177: Middle East and Africa Market Value (USD Million) Analysis by Product Type, 2020 to 2035
  • Figure 178: Middle East and Africa Market Volume (Units) Analysis by Product Type, 2020 to 2035
  • Figure 179: Middle East and Africa Market Value Share (%) and BPS Analysis by Product Type, 2025 to 2035
  • Figure 180: Middle East and Africa Market Y-o-Y Growth (%) Projections by Product Type, 2025 to 2035
  • Figure 181: Middle East and Africa Market Value (USD Million) Analysis by Application, 2020 to 2035
  • Figure 182: Middle East and Africa Market Volume (Units) Analysis by Application, 2020 to 2035
  • Figure 183: Middle East and Africa Market Value Share (%) and BPS Analysis by Application, 2025 to 2035
  • Figure 184: Middle East and Africa Market Y-o-Y Growth (%) Projections by Application, 2025 to 2035
  • Figure 185: Middle East and Africa Market Value (USD Million) Analysis by End User, 2020 to 2035
  • Figure 186: Middle East and Africa Market Volume (Units) Analysis by End User, 2020 to 2035
  • Figure 187: Middle East and Africa Market Value Share (%) and BPS Analysis by End User, 2025 to 2035
  • Figure 188: Middle East and Africa Market Y-o-Y Growth (%) Projections by End User, 2025 to 2035
  • Figure 189: Middle East and Africa Market Attractiveness by Product Type, 2025 to 2035
  • Figure 190: Middle East and Africa Market Attractiveness by Application, 2025 to 2035
  • Figure 191: Middle East and Africa Market Attractiveness by End User, 2025 to 2035
  • Figure 192: Middle East and Africa Market Attractiveness by Country, 2025 to 2035

Frequently Asked Questions

What was the overall size of the medical ventilators market in 2025?

The overall market size for the medical ventilators market was USD 2,023.5 million in 2025.

How big is the medical ventilators market expected to be in 2035?

The medical ventilators market is expected to reach USD 4,660.1 million in 2035.

What will drive the demand for the medical ventilators market during the forecast period?

The demand for medical ventilators will be driven by increasing prevalence of respiratory diseases, rising demand for intensive care units (ICUs), growing aging population with chronic conditions, and advancements in portable and non-invasive ventilator technologies.

List the top 5 countries contributing to the medical ventilators market.

The top 5 countries driving the development of the medical ventilators market are the USA, China, Germany, Japan, and India.

Which segment in type is expected to lead in the medical ventilators market?

The non-invasive ventilators segment is expected to command a significant share over the assessment period.

Explore Similar Insights

Future Market Insights

Medical Ventilators Market