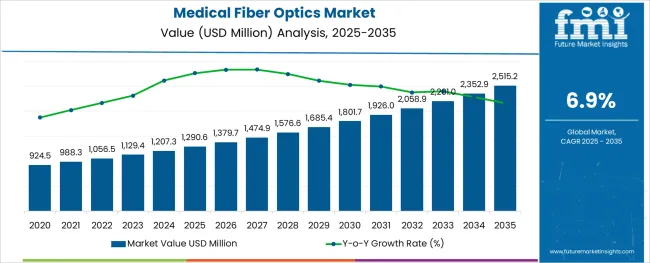
The Medical Fiber Optics Market is estimated to be valued at USD 1290.6 million in 2025 and is projected to reach USD 2515.2 million by 2035, registering a compound annual growth rate (CAGR) of 6.9% over the forecast period.

The alginic acid market is undergoing consistent growth, propelled by rising demand from food processing, pharmaceutical formulations, and cosmetic applications. A growing focus on natural and sustainable ingredients in manufacturing processes has positioned alginic acid as a preferred biopolymer across industries.
The market is further supported by its diverse functional benefits, including water retention, gelling, and stabilizing properties, which make it indispensable in high-performance formulations. Increased regulatory acceptance of alginates as safe additives and the push towards cleaner labeling in food and personal care products have reinforced their adoption.
Ongoing innovation in extraction technologies and the utilization of algae as a renewable resource are paving the way for cost-effective production and expanded applications, ensuring sustained market expansion in the coming years.
The market is segmented by Fiber Type and Application and region. By Fiber Type, the market is divided into Single Mode Optical Fiber and Multimode Optical Fiber. In terms of Application, the market is classified into Endoscopic Imaging, Laser Signal Delivery, Biomedical Sensing, Illumination, and Other Applications. Regionally, the market is classified into North America, Latin America, Western Europe, Eastern Europe, Balkan & Baltic Countries, Russia & Belarus, Central Asia, East Asia, South Asia & Pacific, and the Middle East & Africa.
When segmented by salts, sodium alginate is expected to command 27.5% of the market revenue in 2025, marking it as the leading subsegment in this category. This leadership has been driven by its superior solubility, ease of incorporation into formulations, and versatility in a wide range of applications.
Its ability to form stable gels and maintain viscosity under varying conditions has made it highly sought after in both food and pharmaceutical sectors. Manufacturers have prioritized sodium alginate due to its consistent performance, cost-effectiveness, and regulatory acceptance, which have collectively strengthened its position.
The segment’s prominence has also been enhanced by its adaptability to evolving consumer preferences for plant-derived and sustainable ingredients, reinforcing its market share.
Segmented by end user industry, the food industry is projected to hold 33.0% of the market revenue in 2025, positioning it as the most prominent sector. This dominance has been shaped by the industry’s increasing reliance on alginic acid and its derivatives to deliver desirable textures, stabilize emulsions, and improve shelf life of processed foods.
As consumer demand for clean label and natural additives has intensified, the food sector has responded by integrating alginates into bakery, dairy, and confectionery products. Enhanced production efficiency and compliance with food safety standards have further encouraged widespread use.
The segment’s leadership has also been supported by product differentiation strategies where alginates contribute to premium quality and innovation, securing their role in modern food formulations.
As per the Medical Fiber Optics industry research by Future Market Insights - a market research and competitive intelligence provider, historically, from 2020 to 2024, the market value of the Medical Fiber Optics industry increased at around 6.6% CAGR, wherein, countries such as the USA, China, Japan, The United Kingdom, and South Korea held a significant share in the global market. The rise in the commercial value of technology in treatments for disease treatment, imaging equipment, diagnosis, surgical tools, and wearable medical devices is driving the medical fiber optics market.
The rapid acceptance of fiber optics in medical applications is fueled by factors such as effectiveness in treatment and diagnosis, safety, faster recovery with fewer scars, and a low mortality rate. Owing to this, the medical fiber optics market is projected to grow at a CAGR of 6.9% over the coming 10 years.
Growing awareness of the benefits of minimally invasive surgeries is driving the market for medical fiber optics in various healthcare settings, resulting in a significant demand for fiber optic lines, sensors, and miniature cameras.
Furthermore, lasers are widely employed in cosmetology and dentistry, and various research studies on biomedical sensors are being done, all of which are projected to fuel the industry's expansion. In the forthcoming years, the market is likely to be driven by increased investments, the advent of innovative product development techniques, and a surge in partnerships and collaborations among key players.
The high cost of the ongoing upkeep of fiber-optic tools and equipment is impeding the growth of the world medical fiber-optics market. The market demand is further being held back by regulatory holdups in the approval of new product types. Chemotherapy treatment for cancer disorders has further necessitated a high intensity of light, which limited market demand.

North America is expected to dominate the global medical fiber optics market with a valuation of USD 2515.2 million by 2035. Both USA and Canada have been investing significantly to continuously upgrade their healthcare infrastructure. Medical fiber optics have paved the way in the region’s healthcare structure with network-connected medical instruments, like an otoscope or ophthalmoscope attached to a smartphone.
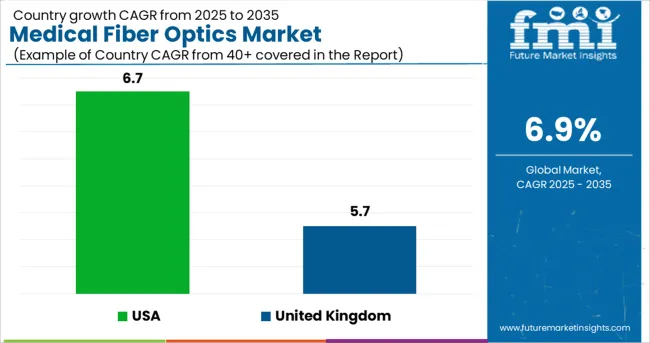
The medical fiber optics market in the USA is estimated at USD 1290.6 million in 2025. The market in the country is further expected to reach a valuation of USD 710.8 by 2035, growing at a CAGR of 6.7%. First responders may often need to take swift action at the scene of a medical emergency or accident. As an example, the DOT Telemedicine Backpack allows paramedics in the USA to acquire information and carry out treatments while away from a hospital setting. Fiber Optic Connectivity allows data from the backpack's tools to be transmitted for analysis in a brief amount of time, allowing immediate diagnosis and treatment.
The medical fiber optics market in the United Kingdom was valued at USD 43.8 million, which is expected to swell and reach a size of USD 82.6 million by 2035, at a projected CAGR of 5.7%. Fiber optic connectivity in the United Kingdom has been making it possible for patients to schedule web consultations with doctors, irrespective of location. Web videos have been enabling doctors to check visual symptoms through medical fiber optics-led high-speed networks that allow patients and doctors to confer in real-time.
Japan has a large geriatric population, which increases the need for a fast network to address their healthcare concerns. According to Kyodo News, Japan has been seen as a laggard in digital transformation globally and the COVID-19 pandemic made the contrast clearer. With an aspiration to cover 99.9% of households with fiber-optic networks by 2035, the Japanese healthcare ecosystem is expected to be fiber-optic ready. With these transformations, the medical fiber optics market in Japan is expected to reach a valuation of USD 123.8 million by 2035.
According to the Korea Institute of Science and Technology Information, Fiber optic sensors are emerging as a superior non-destructive tool for evaluating the health of civil engineering structures. The application of medical fiber optics in the Korean healthcare industry is also advancing, which is leading to market growth. The medical fiber optics market in South Korea is projected to reach a valuation of USD 43.9 million by 2035.
Multimode Optical Fiber is expected to grow at the fastest CAGR of 7%. Due to the widespread use of multimode optical fibers in illumination systems and surgical lighting, the multimode optical fiber segment led the market in 2024, accounting for over 60% of total revenue. Multimode optical fibers are more cost-effective and easier to manufacture. These optical fibers are commonly employed in transferring light from the laser source to the destinations when a signal or light wave must be transferred over a short distance. Multimode optical fibers are commonly employed in poor countries due to their inexpensive cost.
Medical fiber optics application in illumination is expected to grow at a CAGR of 6.6%. The increased popularity as a source of illumination, in endoscopy and in surgery led to over 30 percent of the revenue in 2024 going to fiber optic lighting solutions dedicated to surgeries. Schott, for example, introduced PURVIS, a cool-white-light-emitting glass optical fiber ideal for use in operating rooms. Additionally paced by the increasing use of high-intensity lights in medical procedures such as light therapy and phototherapy, medication is categorized as per the use of high-powered lights. For hair removal, tattoo removal, and the treatment of mental illnesses like anxiety, light therapy is used.

Product approvals, new product releases, acquisitions, collaborations, and innovations are all important methods used by leading market players to maintain their market position.
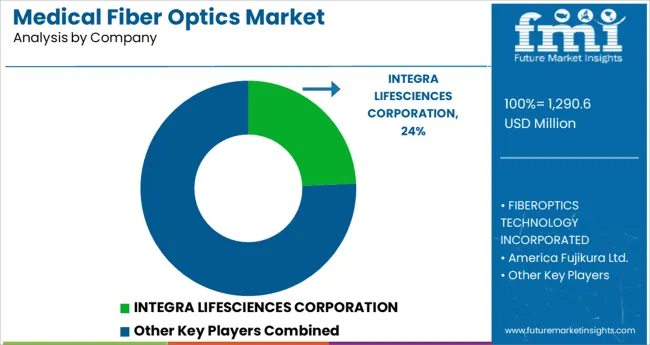
Partnerships and expansion have been prominent development in the Medical Fiber Optics market in recent years. Integra LifeSciences Holdings Corporation; Molex; SCHOTT; Newport Corporation; Coherent, Inc.; and Timbercon, Inc. are some of the prominent providers of Medical Fiber Optics.
Some of the recent developments of key Medical Fiber Optics providers are as follows:
Similarly, recent developments related to companies offering Medical Fiber Optics have been tracked by the team at Future Market Insights, which are available in the full report.
The global medical fiber optics market is estimated to be valued at USD 1,290.6 million in 2025.
It is projected to reach USD 2,515.2 million by 2035.
The market is expected to grow at a 6.9% CAGR between 2025 and 2035.
The key product types are single mode optical fiber and multimode optical fiber.
endoscopic imaging segment is expected to dominate with a 47.6% industry share in 2025.


Our Research Products

The "Full Research Suite" delivers actionable market intel, deep dives on markets or technologies, so clients act faster, cut risk, and unlock growth.

The Leaderboard benchmarks and ranks top vendors, classifying them as Established Leaders, Leading Challengers, or Disruptors & Challengers.

Locates where complements amplify value and substitutes erode it, forecasting net impact by horizon

We deliver granular, decision-grade intel: market sizing, 5-year forecasts, pricing, adoption, usage, revenue, and operational KPIs—plus competitor tracking, regulation, and value chains—across 60 countries broadly.

Spot the shifts before they hit your P&L. We track inflection points, adoption curves, pricing moves, and ecosystem plays to show where demand is heading, why it is changing, and what to do next across high-growth markets and disruptive tech

Real-time reads of user behavior. We track shifting priorities, perceptions of today’s and next-gen services, and provider experience, then pace how fast tech moves from trial to adoption, blending buyer, consumer, and channel inputs with social signals (#WhySwitch, #UX).

Partner with our analyst team to build a custom report designed around your business priorities. From analysing market trends to assessing competitors or crafting bespoke datasets, we tailor insights to your needs.
Supplier Intelligence
Discovery & Profiling
Capacity & Footprint
Performance & Risk
Compliance & Governance
Commercial Readiness
Who Supplies Whom
Scorecards & Shortlists
Playbooks & Docs
Category Intelligence
Definition & Scope
Demand & Use Cases
Cost Drivers
Market Structure
Supply Chain Map
Trade & Policy
Operating Norms
Deliverables
Buyer Intelligence
Account Basics
Spend & Scope
Procurement Model
Vendor Requirements
Terms & Policies
Entry Strategy
Pain Points & Triggers
Outputs
Pricing Analysis
Benchmarks
Trends
Should-Cost
Indexation
Landed Cost
Commercial Terms
Deliverables
Brand Analysis
Positioning & Value Prop
Share & Presence
Customer Evidence
Go-to-Market
Digital & Reputation
Compliance & Trust
KPIs & Gaps
Outputs
Full Research Suite comprises of:
Market outlook & trends analysis
Interviews & case studies
Strategic recommendations
Vendor profiles & capabilities analysis
5-year forecasts
8 regions and 60+ country-level data splits
Market segment data splits
12 months of continuous data updates
DELIVERED AS:
PDF EXCEL ONLINE
Fiber Optics Testing Market Size and Share Forecast Outlook 2025 to 2035
Fiber Optics Market Size and Share Forecast Outlook 2025 to 2035
Laser Fiber In Medical Applications Market
Aerospace Fiber Optics Market Growth - Trends & Forecast 2025 to 2035
Medical Silicone Radiopaque Vascular Ties Market Size and Share Forecast Outlook 2025 to 2035
Fiber Optic Probe Hydrophone (FOPH) Market Size and Share Forecast Outlook 2025 to 2035
Fiberglass Centrifugal Fan Market Size and Share Forecast Outlook 2025 to 2035
Medical Indoor Air Purifier Market Size and Share Forecast Outlook 2025 to 2035
Medical Eye Shield Film Market Size and Share Forecast Outlook 2025 to 2035
Medical Far Infrared Therapy Device Market Size and Share Forecast Outlook 2025 to 2035
Medical Latex Protective Suit Market Size and Share Forecast Outlook 2025 to 2035
Medical Activated Carbon Dressing Market Size and Share Forecast Outlook 2025 to 2035
Medical Coated Roll Stock Market Size and Share Forecast Outlook 2025 to 2035
Medical Billing Outsourcing Market Size and Share Forecast Outlook 2025 to 2035
Fiber to the Home Market Size and Share Forecast Outlook 2025 to 2035
Medical Pressure Mapping System Market Size and Share Forecast Outlook 2025 to 2035
Medical Chairs Market Size and Share Forecast Outlook 2025 to 2035
Medical Exoskeleton Market Forecast Outlook 2025 to 2035
Medical Display Market Forecast and Outlook 2025 to 2035
Medical Spa Market Size and Share Forecast Outlook 2025 to 2035

Thank you!
You will receive an email from our Business Development Manager. Please be sure to check your SPAM/JUNK folder too.
Chat With
MaRIA