The global stainless steel market is projected to reach USD 173.6 billion by 2035, recording an absolute increase of USD 39.3 billion over the forecast period. The market is valued at USD 134.3 billion in 2025 and is set to rise at a CAGR of 2.6% during the assessment period. The market size is expected to grow by nearly 1.3 times during the same period, supported by increasing demand for corrosion-resistant materials worldwide, driving demand for efficient structural and functional steel systems and increasing investments in infrastructure, automotive, and industrial machinery projects globally. Raw material price volatility and competition from alternative materials may pose challenges to market expansion.
Between 2025 and 2030, the stainless steel market is projected to expand from USD 134.3 billion to USD 153.2 billion, resulting in a value increase of USD 18.9 million, which represents 48.1% of the total forecast growth for the decade. This phase of development will be shaped by rising demand for infrastructure and industrial applications, product innovation in specialty grades and high-performance alloys, as well as expanding integration with green manufacturing and circular economy initiatives. Companies are establishing competitive positions through investment in low-carbon production technologies, eco-friendly steelmaking solutions, and strategic market expansion across construction, automotive, and industrial machinery applications.
From 2030 to 2035, the market is forecast to grow from USD 153.2 billion to USD 173.6 billion, adding another USD 20.4 billion, which constitutes 51.9% of the ten-year expansion. This period is expected to be characterized by the expansion of specialized stainless steel grades, including advanced corrosion-resistant formulations and integrated application solutions tailored for specific industry requirements, strategic collaborations between steel manufacturers and end-user industries, and an enhanced focus on production efficiency and environmental responsibility. The growing emphasis on renewable energy infrastructure and green manufacturing processes will drive demand for advanced, high-performance stainless steel solutions across diverse industrial applications.
Technological advancements in stainless steel manufacturing are also playing a crucial role in market growth. Innovations in stainless steel production processes, such as the development of high-performance alloys and improved production techniques, are enabling manufacturers to create more specialized and cost-effective products. These advancements allow stainless steel to meet the evolving demands of industries such as aerospace, defense, and healthcare, where performance and material integrity are critical. As these industries continue to expand and require more advanced materials, stainless steel will remain an essential material in their supply chains.
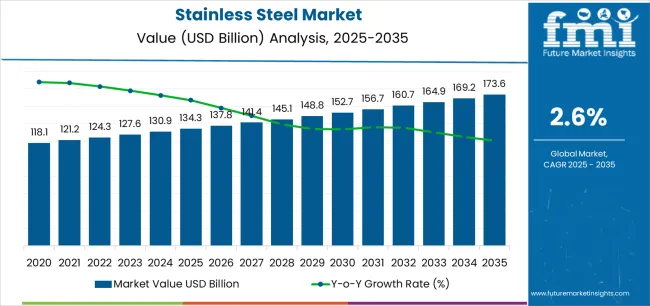
| Metric | Value |
|---|---|
| Market Value (2025) | USD 134.3 billion |
| Market Forecast Value (2035) | USD 173.6 billion |
| Forecast CAGR (2025-2035) | 2.6% |
The stainless steel market grows by enabling manufacturers and construction companies to achieve superior durability and corrosion resistance in various applications, ranging from building structures to industrial machinery. Industrial manufacturers face mounting pressure to improve product longevity and maintenance efficiency, with stainless steel solutions typically providing 30-50 years of service life compared to carbon steel, making stainless steel essential for cost-effective infrastructure and manufacturing operations. The construction industry's need for low-maintenance building materials creates demand for advanced steel grades that can minimize lifecycle costs, enhance structural integrity, and ensure consistent performance across diverse environmental conditions. Government initiatives promoting infrastructure development and eco-friendly standards drive adoption in building & construction, industrial machinery, and automotive applications, where material durability has a direct impact on project economics and operational efficiency. The higher initial costs compared to carbon steel and the complexity of fabrication requirements may limit adoption rates among cost-sensitive manufacturers and developing regions with limited technical expertise.
The market is segmented by type, form, end use, and region. By type, the market is divided into austenitic, ferritic, duplex, martensitic, and precipitation hardening grades. Based on form, the market is categorized into flat products, long products, and tubular products. By end use, the market includes building & construction, industrial machinery & components, automotive & transportation, home appliances/consumer durables, cookware & cutlery, and medical & surgical tools. Regionally, the market is divided into Asia Pacific, Europe, North America, and other key regions.
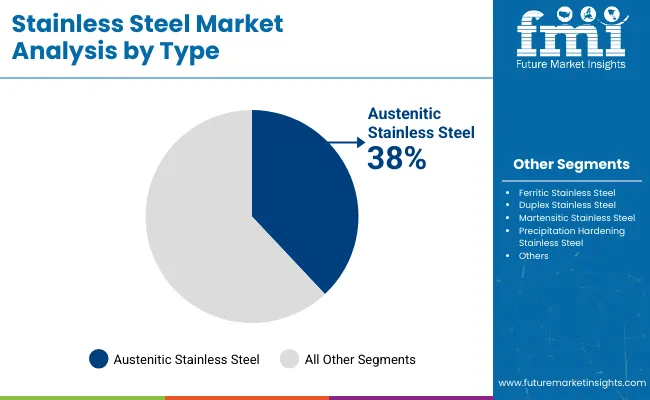
The austenitic stainless steel segment represents the dominant force in the stainless steel market, capturing approximately 38% of total market share in 2025. This advanced material category encompasses grades featuring chromium-nickel compositions with superior corrosion resistance, excellent formability characteristics, and non-magnetic properties that enable diverse applications across construction, food processing, and chemical industries. The austenitic segment's market leadership stems from its exceptional mechanical properties, with grades capable of maintaining structural integrity across temperature ranges from cryogenic to elevated conditions while providing superior weldability and fabrication characteristics.
The ferritic stainless steel segment maintains a substantial 22.0% market share, serving manufacturers who require cost-effective corrosion-resistant solutions for automotive exhaust systems and appliance applications. Duplex grades account for 14.0% market share through combined strength and corrosion resistance properties, while martensitic (13.0%) and precipitation hardening (13.0%) grades serve specialized applications requiring high strength and hardness characteristics.
Key technological advantages driving the austenitic segment include:
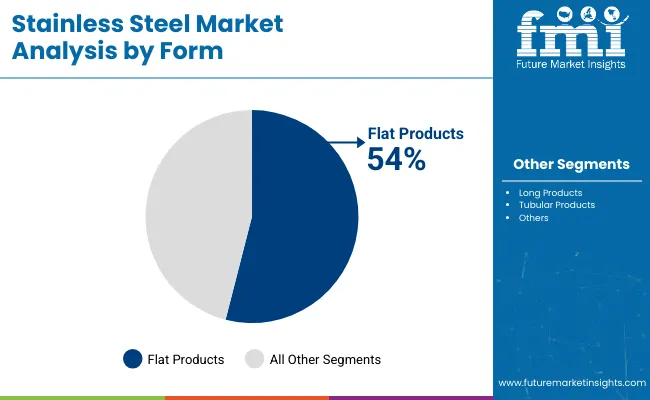
Flat products dominate the stainless steel market with approximately 54% market share in 2025, reflecting the critical role of sheet, plate, and coil forms in construction, appliance manufacturing, and industrial equipment production. The flat products segment's market leadership is reinforced by expanding building façade applications, growing demand for food processing equipment, and rising requirements for automotive body panels that directly correlate with product versatility and surface finishing capabilities.
The long products segment represents the second-largest form category, capturing 31.0% market share through structural applications including bars, wire, and angles for construction reinforcement and industrial machinery components. This segment benefits from infrastructure development projects requiring high-strength structural elements and corrosion-resistant reinforcement systems.
The tubular products segment accounts for 15.0% market share, serving specialized applications in oil & gas transportation, chemical processing piping, and heat exchanger systems requiring pressure containment and fluid transport capabilities.
Key market dynamics supporting form segment growth include:
The market is driven by three concrete demand factors tied to infrastructure development and industrial modernization outcomes. First, global urbanization and infrastructure expansion create increasing demand for corrosion-resistant construction materials, with developing economies projected to invest USD 3-4 trillion annually in infrastructure projects requiring durable building materials for long-term performance. Second, food safety regulations and hygiene standards drive adoption of stainless steel equipment across food processing, commercial kitchens, and pharmaceutical manufacturing, with facilities seeking 99.9% contamination prevention through sanitary material specifications. Third, eco-conscious initiatives and circular economy principles favor stainless steels 100% recyclability and long service life, reducing environmental impact while improving lifecycle economics compared to alternative materials requiring frequent replacement.
Market restraints include nickel price volatility that can impact production costs and profitability margins, particularly during periods of supply chain disruption or commodity market fluctuations affecting key alloying elements. Manufacturing capacity constraints pose another significant challenge, as establishing new integrated steelmaking facilities requires USD 2-5 billion capital investment and 3-5 year development timelines, potentially causing supply shortages during periods of rapid demand growth. Competition from alternative materials including carbon steel with protective coatings, aluminum alloys, and composite materials creates additional complexity for manufacturers, demanding ongoing investment in product differentiation and application development.
Key trends indicate accelerated adoption of low-carbon production technologies, with leading steelmakers implementing electric arc furnace systems, hydrogen-based reduction processes, and scrap-based circular manufacturing that reduce CO2 emissions by 50-70% compared to traditional integrated mills. Technology advancement trends toward specialty grade development with enhanced corrosion resistance, improved mechanical properties, and application-specific compositions enable next-generation product development for renewable energy, chemical processing, and advanced manufacturing applications. The market thesis could face disruption if breakthrough coating technologies or alternative corrosion-resistant materials significantly reduce the cost differential compared to stainless steel or if major economic downturns reduce infrastructure investment and industrial production globally.
| Country | CAGR (2025-2035) |
|---|---|
| China | 2.9% |
| India | 2.8% |
| United States | 2.7% |
| South Korea | 2.7% |
| European Union | 2.6% |
| Japan | 2.5% |
| United Kingdom | 2.5% |
The stainless steel market is gaining momentum worldwide, with China taking the lead thanks to massive infrastructure expansion and government-backed manufacturing capacity upgrades. Close behind, India benefits from growing construction projects and rising per capita stainless steel consumption, positioning itself as a strategic growth hub in the Asia-Pacific region. The United States shows steady advancement, where integration of non-residential construction and energy sector projects strengthens its role in the North American industrial supply chain. South Korea is focusing on shipbuilding and high-end appliance manufacturing, signaling an ambition to capitalize on growing opportunities in specialty stainless steel grades. Meanwhile, the European Union stands out for its circular economy initiatives in existing steel applications, and the United Kingdom and Japan continue to record consistent progress in specialty applications and precision manufacturing. Together, China and India anchor the global expansion story, while the rest build stability and diversity into the market's growth path.
The report covers an in-depth analysis of 40+ countries; 7 top-performing countries are highlighted below.
China demonstrates the strongest growth potential in the Stainless Steel Market with a CAGR of 2.9% through 2035. The country's leadership position stems from massive infrastructure projects, government-backed industrial modernization programs, and comprehensive capacity upgrade initiatives, driving the adoption of specialty stainless steel grades for enhanced product performance and export competitiveness. Growth is concentrated in major production regions, including Jiangsu, Guangdong, Zhejiang, and Shandong, where integrated steel mills and downstream processors are implementing advanced melting technologies for improved quality control and environmental compliance. Distribution channels through established steel service centers and direct manufacturer relationships expand deployment across construction projects, appliance manufacturing facilities, and industrial equipment production lines. The country's Belt and Road infrastructure strategy provides policy support for steel industry development, including high-performance stainless steel system adoption.
Key market factors:
In Mumbai, Bangalore, Chennai, and Hyderabad, the adoption of stainless steel systems is accelerating across infrastructure projects and manufacturing facilities, driven by Smart Cities Mission and government Make in India initiatives. The market demonstrates strong growth momentum with a CAGR of 2.8% through 2035, linked to comprehensive infrastructure development and increasing focus on domestic steel production capabilities. Indian manufacturers are implementing modern steelmaking systems and quality control platforms to enhance product performance while meeting growing demand for construction materials and industrial equipment in domestic and export markets. The country's National Infrastructure Pipeline creates demand for corrosion-resistant steel solutions, while increasing emphasis on local manufacturing drives adoption of integrated production technologies.
Leading manufacturing expansion regions, including Gujarat, Maharashtra, Karnataka, and Odisha, are driving steel production capacity additions:
The advanced steel industry in Germany demonstrates sophisticated implementation of specialty stainless steel grades, with documented case studies showing superior corrosion resistance in chemical processing applications through optimized alloy compositions. The country's manufacturing infrastructure in major industrial centers, including North Rhine-Westphalia, Bavaria, Baden-Württemberg, and Lower Saxony, showcases integration of advanced steelmaking technologies with existing production systems, leveraging expertise in precision engineering and quality management. German manufacturers emphasize eco-friendly standards and recycling content, creating demand for circular economy steel solutions that support environmental initiatives and regulatory requirements. The market maintains steady growth through focus on specialty applications and premium product segments, with a CAGR of 2.6% through 2035.
Key development areas:
Stainless Steel market expansion in Brazil is driven by diverse industrial demand, including construction projects in São Paulo and Rio de Janeiro, oil & gas infrastructure in Rio Grande do Sul and Bahia, and comprehensive mining equipment requirements across multiple regions. The country demonstrates promising growth potential with a CAGR of 2.4% through 2035, supported by federal infrastructure programs and regional industrial development initiatives. Brazilian manufacturers face implementation challenges related to import dependency for specialty grades and technical expertise availability, requiring technology transfer approaches and international partnership support. The growing infrastructure investment and industrial modernization requirements create compelling business cases for stainless steel adoption, particularly in coastal construction regions where corrosion resistance has direct impact on lifecycle costs.
Market characteristics:
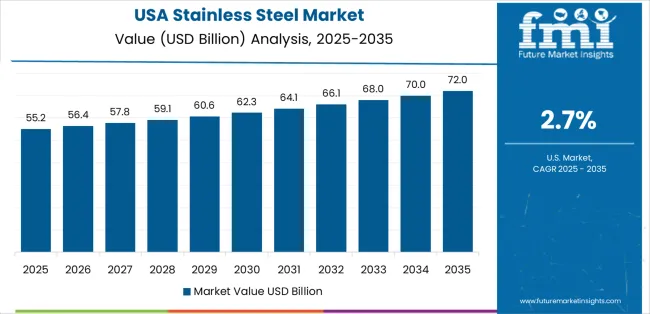
The U.S. market leads in advanced application development based on integration with non-residential construction, food processing equipment, and energy sector infrastructure for enhanced performance characteristics. The country shows solid potential with a CAGR of 2.7% through 2035, driven by infrastructure renewal programs and reshoring initiatives across major industrial regions, including Texas, California, Pennsylvania, and the Midwest manufacturing belt. American manufacturers are adopting specialty stainless steel grades for performance optimization and regulatory compliance, particularly in states with stringent food safety requirements and chemical processing facilities requiring superior corrosion resistance. Technology deployment channels through established steel service centers and direct mill relationships expand coverage across construction, food equipment, and industrial manufacturing facilities.
Leading market segments:
In England, Scotland, Wales, and Northern Ireland, construction projects are implementing stainless steel solutions to enhance building durability and reduce maintenance requirements, with documented case studies showing 40-year service life in coastal environments through proper grade selection. The market shows moderate growth potential with a CAGR of 2.5% through 2035, linked to infrastructure renewal programs, offshore wind projects, and emerging food & beverage equipment manufacturing initiatives. British manufacturers are adopting specialty grades and quality systems to enhance product performance while maintaining environmental standards demanded by UK regulations and international export markets. The country's established steel service center network creates demand for premium products that integrate with existing construction and manufacturing systems.
Market development factors:
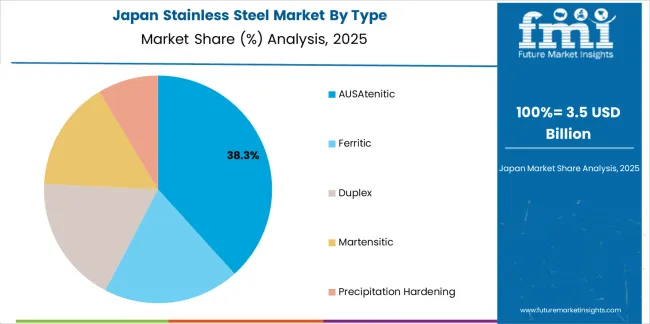
The stainless steel market in Japan demonstrates sophisticated implementation focused on high-performance alloys and quality excellence optimization, with documented integration of advanced grades achieving superior corrosion resistance in chemical processing and medical device applications. The country maintains steady growth momentum with a CAGR of 2.5% through 2035, driven by manufacturers' emphasis on specialty product development and continuous improvement methodologies that align with precision manufacturing principles applied to alloy design and processing operations. Major industrial regions, including Kanto, Kansai, Chubu, and Kyushu, showcase advanced deployment of specialty melting and finishing technologies where systems integrate seamlessly with existing quality assurance systems and comprehensive traceability programs.
Key market characteristics:

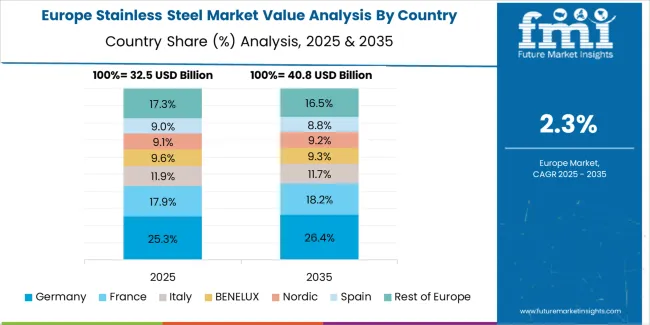
The stainless steel market in Europe accounted for approximately USD 31.0 billion of global demand in 2025, projected to grow to USD 39.0 billion by 2035, registering a CAGR of 2.3% over the forecast period. Germany is expected to maintain its leadership position with a 23.0% market share in 2025, supported by its extensive automotive manufacturing base, chemical processing industry, and major industrial centers including Munich, Stuttgart, and Frankfurt production facilities.
Italy follows with an 18.0% share in 2025, driven by comprehensive appliance manufacturing, cookware production, and architectural applications implementing stainless steel solutions. France holds a 14.0% share in 2025, maintaining its position through 2035 through ongoing nuclear facility maintenance, food processing equipment upgrades, and pharmaceutical manufacturing expansion. The United Kingdom commands a 12.0% share, while Spain accounts for 7.0% in 2025. The Netherlands captures 6.0% through chemical processing clusters and logistics equipment. The Nordic/Benelux/Rest of Europe region is anticipated to gain momentum, maintaining its collective share at approximately 20.0% by 2035, attributed to increasing stainless steel adoption in pulp & paper industries, marine applications, and emerging renewable energy facilities implementing corrosion-resistant materials programs.
The Japanese Stainless Steel Market demonstrates a mature and quality-focused landscape, characterized by sophisticated integration of austenitic stainless steel systems with existing precision manufacturing infrastructure across automotive production facilities, semiconductor equipment manufacturers, and specialized medical device fabrication centers. Japan's emphasis on manufacturing excellence and quality standards drives demand for high-purity steel grades that support zero-defect manufacturing initiatives and statistical process control requirements in clean-room production operations. The market benefits from strong domestic producers including Nippon Steel Stainless Steel Corp., JFE Steel, and partnerships with international specialty providers creating comprehensive service ecosystems that prioritize material traceability and consistent mechanical properties. Manufacturing centers in Tokyo, Osaka, Nagoya, and other major industrial areas showcase advanced quality control implementations where material testing achieves 99.9% specification compliance through integrated inspection programs.
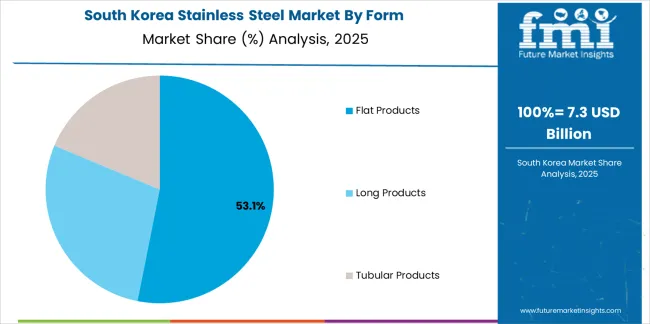
The South Korean Stainless Steel Market is characterized by strong domestic producer presence, with POSCO maintaining significant market position through comprehensive product portfolio and technical services capabilities for shipbuilding, appliances, and automotive applications. The market is demonstrating growing emphasis on high-value specialty grades and precision cold-rolling capabilities, as Korean manufacturers increasingly demand customized solutions that integrate with domestic advanced manufacturing infrastructure and sophisticated quality control systems deployed across Samsung, LG, and Hyundai industrial complexes. Specialty steel service centers and regional processors are gaining market share through strategic partnerships with global producers, offering specialized services including Korean market customization and just-in-time delivery programs for manufacturing applications. The competitive landscape shows increasing collaboration between domestic mills and international technology providers, creating hybrid service models that combine local production capabilities with global materials expertise and supply chain management systems.
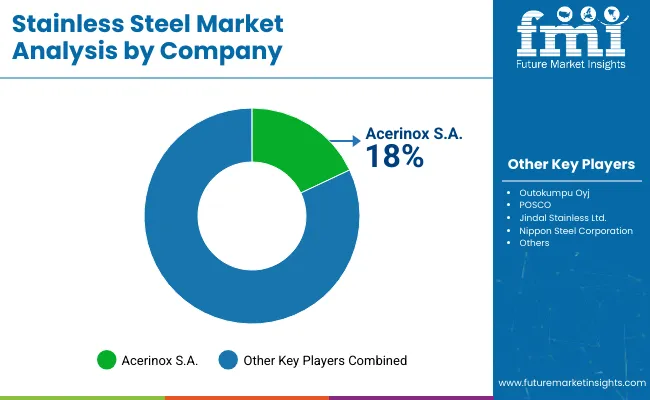
The stainless steel market features 12–18 players with moderate concentration, where the top three companies collectively hold around 50–58% of global market share, driven by large-scale production capabilities, advanced steelmaking technologies, and strong relationships with industries such as automotive, construction, and industrial manufacturing. The leading company, Tsingshan Holding Group, commands 16% of the market share, supported by its massive production capacity and innovative process technologies. Competition focuses on alloy variety, corrosion resistance, formability, and supply chain efficiency rather than price-based competition alone.
Market leaders such as Tsingshan Holding Group, Outokumpu Oyj, and Acerinox S.A. maintain their dominant positions by offering a wide range of high-quality stainless steel grades, including austenitic, ferritic, and duplex stainless steels. Their competitive strengths lie in their advanced production processes, cost efficiency, and ability to provide specialized stainless steel products for diverse applications in industries like aerospace, energy, and construction.
Challenger companies like POSCO, Jindal Stainless Ltd., and Baosteel (including TISCO) focus on innovation in stainless steel production, particularly in terms of material performance, reducing energy consumption, and meeting regional market demands.
Additional competitive pressure arises from Aperam, Nippon Steel Stainless Steel Corp. (NSSC), Yieh United Steel (YUSCO), thyssenkrupp, and ArcelorMittal, which are expanding their product portfolios, particularly for high-end applications, while also focusing on global supply chain optimization.
Stainless steel represents specialized corrosion-resistant alloys that enable manufacturers and construction companies to achieve 30-50 year service life compared to carbon steel alternatives, delivering superior durability and lifecycle cost advantages with 100% recyclability in demanding applications. With the market projected to grow from USD 134.3 billion in 2025 to USD 173.6 billion by 2035 at a 2.6% CAGR, these materials offer compelling advantages - enhanced corrosion resistance, superior mechanical properties, and environmental responsibility making them essential for building & construction applications (28.0% market share), industrial machinery (22.0% share), and automotive manufacturing seeking alternatives to carbon steel that compromise performance through frequent replacement and maintenance requirements. Scaling market adoption and technological advancement requires coordinated action across infrastructure policy, industrial standards development, integrated steel producers, end-user industries, and eco-friendly manufacturing investment capital.
Infrastructure Investment Programs: Include stainless steel specifications in public infrastructure procurement standards, provide tax incentives for projects using corrosion-resistant materials, and establish domestic production capabilities for specialty grades that reduce import dependencies in critical construction and industrial applications.
Technology & Innovation Support: Fund research initiatives on low-carbon steelmaking, hydrogen-based reduction technologies, and next-generation alloy development. Invest in university-industry partnerships that advance circular manufacturing and resource efficiency techniques for eco-friendly steel production.
Manufacturing Development Incentives: Provide grants for establishing integrated stainless steel facilities, offer technical assistance for upgrading melting and refining equipment, and support supply chain development that ensures reliable raw material availability for domestic producers.
Standards & Quality Infrastructure: Establish national testing facilities for material property validation, develop certification programs for welding and fabrication specialists, and create international standards harmonization that facilitates export of stainless steel products to global markets.
Environmental & Environmental Programs: Promote low-carbon production methods through carbon pricing mechanisms, support scrap recycling infrastructure development, and establish lifecycle assessment frameworks that validate the environmental benefits of durable materials through extended service life.
Performance Standards & Specifications: Define standardized grade designations, mechanical property requirements, and corrosion resistance classifications across austenitic (38.0% market dominance), ferritic, and specialty steel systems, enabling reliable material selection and application-specific performance criteria.
Application Best Practices: Develop comprehensive guidelines for material selection in construction (28.0% application dominance), industrial machinery fabrication, and food processing equipment, ensuring optimal performance and safety compliance across different operating environments.
Fabrication & Joining Standards: Create compatibility frameworks for welding procedures, surface finishing specifications, and quality control protocols that facilitate seamless processing across different manufacturing facilities and fabrication technologies.
Skills Development & Certification: Establish training programs for welders, fabricators, and quality control specialists on stainless steel properties, proper handling techniques, and application requirements that ensure manufacturing excellence.
Advanced Grade Development: Develop next-generation alloy compositions with enhanced corrosion resistance, improved mechanical properties, and specialized characteristics including antimicrobial surfaces and self-healing coatings that provide additional value beyond basic performance capabilities.
Production Technology Innovation: Provide advanced melting equipment with real-time chemistry control, continuous casting systems, and finishing platforms that ensure consistent product quality across high-volume production operations while minimizing energy consumption and waste generation.
Application Engineering Services: Offer material selection support, including environment-specific grade recommendations, joining procedure development, and performance optimization solutions that address unique requirements in construction, chemical processing, and food equipment applications.
Technical Support & Integration: Build comprehensive customer support, including fabrication troubleshooting, corrosion analysis services, and lifecycle cost modeling that help end-users achieve maximum performance while maintaining budget targets.
Application-Focused Product Portfolio: Develop specialized product lines for building & construction (28.0% market dominance), industrial machinery (22.0% share), and automotive applications, with grades optimized for each sector's specific corrosion resistance requirements and fabrication methods.
Geographic Market Strategy: Establish production and service capabilities in high-growth markets like China (2.9% CAGR) and India (2.8% CAGR), while maintaining technical centers in established markets like Germany and the United States for advanced alloy development and quality standards.
Eco-friendly Differentiation: Invest in electric arc furnace technology, scrap-based circular manufacturing, and low-carbon production processes that offer environmental performance benefits and enable premium positioning in green building and eco-conscious manufacturing markets.
Customer Partnership Models: Develop long-term relationships with construction companies, equipment manufacturers, and industrial processors through collaborative product development, technical consulting services, and supply agreements that strengthen customer loyalty.
Integrated Production Investment: Finance established steel producers including Outokumpu, Acerinox, and POSCO for capacity expansion programs, specialty melting equipment, and finishing line upgrades that serve growing demand in construction and industrial markets.
Infrastructure Development Capital: Provide financing for establishing regional service centers, cold-rolling facilities, and distribution networks that reduce lead times while ensuring consistent product availability across growing manufacturing regions.
Innovation & Technology: Back specialty alloy development programs, low-carbon production technology implementation, and advanced surface treatment capabilities that enhance performance while addressing environmental concerns and regulatory requirements.
Market Integration & Expansion: Support strategic partnerships between steel producers and end-user industries, finance technology transfers initiatives from research institutions, and enable market consolidation that creates comprehensive stainless steel solution providers serving multiple application segments.
| Item | Value |
|---|---|
| Quantitative Units | USD 134.3 billion |
| Type | Austenitic, Ferritic, Duplex, Martensitic, Precipitation Hardening |
| Form | Flat Products, Long Products, Tubular Products |
| End Use | Building & Construction, Industrial Machinery & Components, Automotive & Transportation, Home Appliances/Consumer Durables, Cookware & Cutlery, Medical & Surgical Tools |
| Regions Covered | Asia Pacific, Europe, North America, Latin America, Middle East & Africa |
| Country Covered | China, India, United States, South Korea, Germany, United Kingdom, Japan, and 40+ countries |
| Key Companies Profiled | Tsingshan Holding Group, Outokumpu Oyj, Acerinox S.A., POSCO, Jindal Stainless Ltd., Baosteel (incl. TISCO), Aperam, Nippon Steel Stainless Steel Corp. (NSSC), Yieh United Steel (YUSCO), thyssenkrupp, ArcelorMittal, ATI Specialty Alloys & Components, Sandvik Materials Technology, VDM Metals |
| Additional Attributes | Dollar sales by type, form, and end-use categories, regional adoption trends across Asia Pacific, Europe, and North America, competitive landscape with integrated producers and specialty mills, manufacturing facility requirements and specifications, integration with infrastructure initiatives and industrial systems, innovations in low-carbon production and specialty alloys, and development of circular economy manufacturing with recycling and sustainability capabilities. |
Asia Pacific
Europe
North America
Latin America
Middle East & Africa
The global stainless steel market is estimated to be valued at USD 134.3 billion in 2025.
The market size for the stainless steel market is projected to reach USD 173.6 billion by 2035.
The stainless steel market is expected to grow at a 2.6% CAGR between 2025 and 2035.
The key product types in stainless steel market are ausatenitic, ferritic, duplex, martensitic and precipitation hardening.
In terms of form, flat products segment to command 54.0% share in the stainless steel market in 2025.


Our Research Products

The "Full Research Suite" delivers actionable market intel, deep dives on markets or technologies, so clients act faster, cut risk, and unlock growth.

The Leaderboard benchmarks and ranks top vendors, classifying them as Established Leaders, Leading Challengers, or Disruptors & Challengers.

Locates where complements amplify value and substitutes erode it, forecasting net impact by horizon

We deliver granular, decision-grade intel: market sizing, 5-year forecasts, pricing, adoption, usage, revenue, and operational KPIs—plus competitor tracking, regulation, and value chains—across 60 countries broadly.

Spot the shifts before they hit your P&L. We track inflection points, adoption curves, pricing moves, and ecosystem plays to show where demand is heading, why it is changing, and what to do next across high-growth markets and disruptive tech

Real-time reads of user behavior. We track shifting priorities, perceptions of today’s and next-gen services, and provider experience, then pace how fast tech moves from trial to adoption, blending buyer, consumer, and channel inputs with social signals (#WhySwitch, #UX).

Partner with our analyst team to build a custom report designed around your business priorities. From analysing market trends to assessing competitors or crafting bespoke datasets, we tailor insights to your needs.
Supplier Intelligence
Discovery & Profiling
Capacity & Footprint
Performance & Risk
Compliance & Governance
Commercial Readiness
Who Supplies Whom
Scorecards & Shortlists
Playbooks & Docs
Category Intelligence
Definition & Scope
Demand & Use Cases
Cost Drivers
Market Structure
Supply Chain Map
Trade & Policy
Operating Norms
Deliverables
Buyer Intelligence
Account Basics
Spend & Scope
Procurement Model
Vendor Requirements
Terms & Policies
Entry Strategy
Pain Points & Triggers
Outputs
Pricing Analysis
Benchmarks
Trends
Should-Cost
Indexation
Landed Cost
Commercial Terms
Deliverables
Brand Analysis
Positioning & Value Prop
Share & Presence
Customer Evidence
Go-to-Market
Digital & Reputation
Compliance & Trust
KPIs & Gaps
Outputs
Full Research Suite comprises of:
Market outlook & trends analysis
Interviews & case studies
Strategic recommendations
Vendor profiles & capabilities analysis
5-year forecasts
8 regions and 60+ country-level data splits
Market segment data splits
12 months of continuous data updates
DELIVERED AS:
PDF EXCEL ONLINE
Stainless Steel 330 Refractory Anchor Market Size and Share Forecast Outlook 2025 to 2035
Stainless Steel One-touch Fitting Market Size and Share Forecast Outlook 2025 to 2035
Stainless Steel Submerged Arc Welding Wire Market Size and Share Forecast Outlook 2025 to 2035
Stainless Steel Direct Acting Solenoid Valve Market Size and Share Forecast Outlook 2025 to 2035
Stainless Steel Miniature Screw Market Size and Share Forecast Outlook 2025 to 2035
Stainless Steel Industry Analysis in India Forecast and Outlook 2025 to 2035
Stainless Steel Welded Pipe Market Size and Share Forecast Outlook 2025 to 2035
Stainless Steel Turning Inserts Market Size and Share Forecast Outlook 2025 to 2035
Stainless Steel Electrical Cabinet Market Size and Share Forecast Outlook 2025 to 2035
Stainless Steel Bars and Bar Size Shapes Market Size and Share Forecast Outlook 2025 to 2035
Stainless Steel Casks Market Size and Share Forecast Outlook 2025 to 2035
Stainless Steel Valve Tag Market Size and Share Forecast Outlook 2025 to 2035
Stainless Steel Foil Market Analysis - Size and Share Forecast Outlook 2025 to 2035
Stainless Steel Water Bottles Market Size, Share & Forecast 2025 to 2035
Stainless Steel Control Valve Market Size, Share, and Forecast 2025 to 2035
Stainless Steel IBC Industry Analysis in United States Insights - Trends & Forecast 2025 to 2035
Key Companies & Market Share in the Stainless Steel Welded Pipe Sector
Precision Stainless Steel Market Size and Share Forecast Outlook 2025 to 2035
Demand for Stainless Steel 330 Refractory Anchor in USA Size and Share Forecast Outlook 2025 to 2035
Demand for Stainless Steel 330 Refractory Anchor in UK Size and Share Forecast Outlook 2025 to 2035

Thank you!
You will receive an email from our Business Development Manager. Please be sure to check your SPAM/JUNK folder too.
Chat With
MaRIA