Stainless Steel Valve Tag Market Size and Share Forecast Outlook 2025 to 2035

The Stainless Steel Valve Tag Market is estimated to be valued at USD 6.4 billion in 2025 and is projected to reach USD 9.8 billion by 2035, registering a compound annual growth rate (CAGR) of 4.3% over the forecast period.
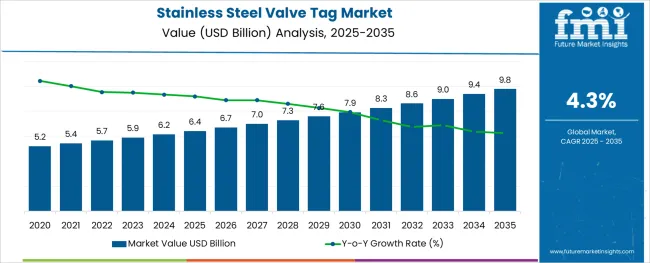
Quick Stats for Stainless Steel Valve Tag Market

  • Stainless Steel Valve Tag Market Industry Value (2025): USD 6.4 billion
  • Stainless Steel Valve Tag Market Forecast Value (2035): USD 9.8 billion
  • Stainless Steel Valve Tag Market Forecast CAGR: 4.3%
  • Leading Segment in Stainless Steel Valve Tag Market in 2025: Less than 30 mm (41.3%)
  • Key Growth Region in Stainless Steel Valve Tag Market: North America, Asia-Pacific, Europe
  • Top Key Players in Stainless Steel Valve Tag Market: Brady Corporation, ARCAT, Inc., Partex Direct, TUFFA Products, Creative Safety Supply, Marking Services Canada, Brimar Industries, LLC., CABLECRAFT, Identitag Limited, Monroe Specialty Company, Inc., Hartac, Uticom System Inc.

Stainless Steel Valve Tag Market

Rationale for Segmental Growth in the Stainless Steel Valve Tag Market

Market Overview

The stainless steel valve tag market is expanding steadily as industrial sectors prioritize asset management, safety compliance, and equipment traceability. Increasing investments in infrastructure and process automation have heightened demand for robust and clear identification solutions capable of withstanding harsh environments.

The shift toward digital transformation in industries such as oil and gas, manufacturing, and utilities is encouraging the adoption of advanced tagging systems that support maintenance and audit operations. Growing awareness around regulatory compliance for equipment labeling and enhanced safety protocols is also influencing market expansion.

The rise of e-commerce platforms has facilitated easier procurement of valve tags, increasing accessibility for small to medium enterprises and broadening geographic reach. Material innovations and customization options continue to enhance product longevity and visibility, creating opportunities for market penetration across diverse industrial applications.

Segmental Analysis

The market is segmented by Thickness, Product Type, and Distribution Channel and region. By Thickness, the market is divided into Less than 30 mm, 30-50 mm, and Above 50 mm. In terms of Product Type, the market is classified into Engraved and Blank. Based on Distribution Channel, the market is segmented into Online and Offline. Regionally, the market is classified into North America, Latin America, Western Europe, Eastern Europe, Balkan & Baltic Countries, Russia & Belarus, Central Asia, East Asia, South Asia & Pacific, and the Middle East & Africa.

Insights into the Less than 30 mm Thickness Segment

The less than 30 mm thickness segment is expected to hold 41.3% of the revenue share in 2025 within the thickness category. This segment’s leadership is supported by its suitability for a wide range of valve sizes and equipment types, providing sufficient durability while minimizing material costs.

The thinner tags offer flexibility in installation, especially in tight spaces and complex piping systems, making them preferable for industries where compactness is critical. Their compatibility with standard mounting hardware and ability to endure corrosion and wear have reinforced demand in sectors emphasizing both performance and cost efficiency.

This balance between robustness and adaptability has contributed to the segment’s dominant position.
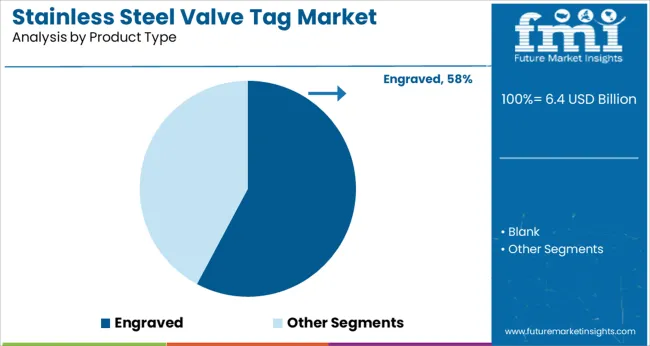
Insights into the Engraved Product Type Segment

Stainless Steel Valve Tag Market Analysis By Product Type

Within the product type category, engraved valve tags are projected to command 57.8% of the market revenue share in 2025, marking them as the leading product form. The prominence of engraved tags is due to their superior legibility, permanence, and resistance to environmental degradation such as fading, scratching, and chemical exposure.

Engraving allows precise and customizable marking, meeting stringent industry standards for traceability and safety. The technique supports complex information including serial numbers, barcodes, and QR codes, enhancing integration with digital asset management systems.

Manufacturers’ emphasis on delivering long-lasting, tamper-proof tags that reduce maintenance costs has reinforced the adoption of engraved tags in heavy industries.
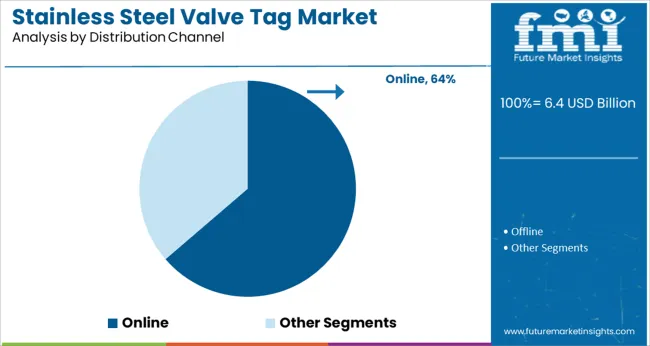
Insights into the Online Distribution Channel Segment

Stainless Steel Valve Tag Market Analysis By Distribution Channel

The online distribution channel is expected to generate 63.7% of market revenue in 2025, making it the most dominant sales route. The growth of e-commerce platforms has revolutionized procurement by offering convenience, broader product selections, and competitive pricing to end-users across industries.

Online channels enable buyers to access detailed product specifications, customization options, and customer reviews, simplifying purchase decisions. This has particularly benefited small and medium-sized enterprises lacking traditional supply chain networks.

Additionally, digital platforms have streamlined order fulfillment and reduced lead times, fostering faster adoption. Vendors are increasingly investing in online marketplaces and direct-to-customer websites to expand reach and improve customer engagement, reinforcing the online channel’s leadership in the stainless steel valve tag market.

What are the Key Drivers and Restraints to the Stainless Steel Valve Tag Market?

Identification and labeling of the valve, pipe, equipment, and instrument are considered vital and prudent. Accidents, damage, and injuries to equipment can be caused by people not knowing what distinct valve, pipe, equipment, and instrument contains.

Stainless steel valve tag is widely used in various end-use industries for valve identification needs, increasing the sales of stainless steel valve tags.

This factor is expected to drive the growth of the global stainless steel valve tag market during the forecast period.

Stainless steel valve tag is gaining popularity in various end-use industries due to its low cost, low thickness, and highly durable nature, which can withstand extreme environmental conditions. Such factors are expected to push the growth in the sales of stainless steel valve tags during the forecast period.

The continuous expansion of end-user industries such as food processing, medical, chemical, and others across the globe is expected to create significant demand for stainless steel valve tags during the forecast period. Overall, the global stainless steel valve tag is likely to expand with notable CAGR during the forecast period.
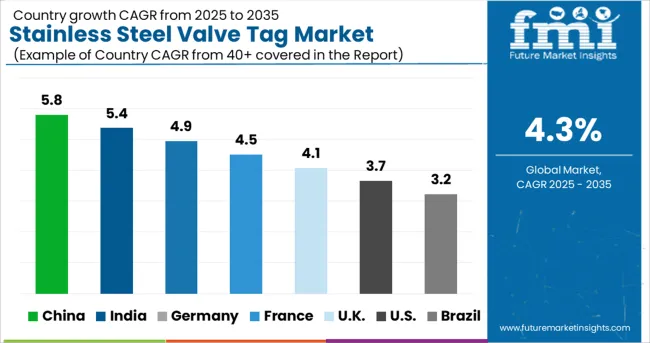
Which Region is the Biggest for Stainless Steel Valve Tag Market?

Stainless Steel Valve Tag Market Cagr Analysis By Country

The Asia Pacific, excluding Japan (APEJ) region is expected to be at the forefront in terms of market share of the global stainless steel valve tag market during the forecast period.

The presence of high growth economies, coupled with a rapid expansion of end-use industries, is expected to drive the growth of the APEJ stainless steel valve tag market during the forecast period. India and ASEAN countries are expected to register the peak growth rate of the stainless steel valve tag market during the forecast period.

Latin America and the Middle East and Africa are expected to create significant demand for stainless steel valve tag markets during the forecast period. Expansion of various end-user industries and the presence of emerging economies are the factors driving the stainless-steel valve tag market in Latin America and the Middle East & Africa region.

Western Europe and North America are significant shareholders of the global stainless steel valve tag market and are likely to register notable CAGR during the forecast period.

Germany in Western Europe and the USA in North America are expected to be highly attractive in terms of the market share of stainless-steel valve tags during the forecast period. Japan's stainless steel valve tag market is anticipated to expand with moderate CAGR during the forecast period.
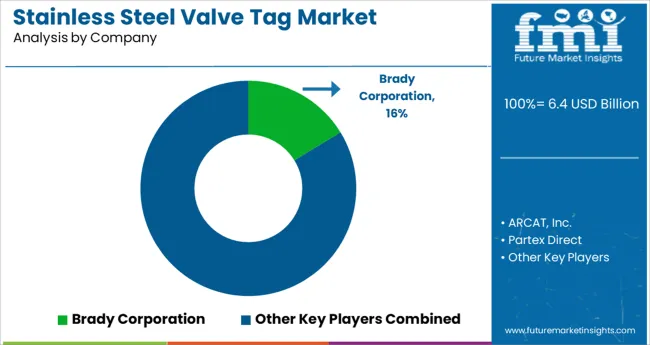
How’s the Competitive Landscape in Stainless Steel Valve Tag Market?

Stainless Steel Valve Tag Market Analysis By Company

The key players of the Stainless steel valve tag market is focusing on. The competitors also focus on factors like product launches, partnerships for better access to distribution channels. Companies also work on durability, design and new market specific sizes that drive the demand for Stainless steel valve tag business. This drives the sales of Stainless steel valve tag.

Key players in Stainless steel valve tag market include Seton – A Brandy Corporation Company, Metal Marker Manufacturing, Inland Products, Big City Manufacturing, Tag-It Industries, Ketchum Manufacturing Inc and National Band & Tag company.

Recent Market Development:

  • Big city manufacturing has increased its production capacity, adding new sizes and shapes to the tags with better quality, increasing the sales of stainless steel valve tags.
  • National Band & Tag company has completed 119 years in the tag business and will be increasing its production facilities in North American region, increasing the sales of stainless steel valve tags.

Report Scope

Report Attribute Details
Growth Rate CAGR of 4.3% from 2025 to 2035
Base year for estimation 2024
Historical data 2020 to 2024
Forecast period 2025 to 2035
Quantitative units Revenue in million, volume in kilotons, and CAGR from 2025 to 2035
Report coverage Revenue forecast, volume forecast, company ranking, competitive landscape, growth factors, and trends, Pricing Analysis,
Segments covered Stainless Steel, Thickness Type, Sales Channel, End Use, Region
Regional scope North America; Western Europe; Eastern Europe; Middle East; Africa; ASEAN; South Asia; Rest of Asia; Australia and New Zealand
Country scope USA, Canada, Mexico, Germany, UK, France, Italy, Spain, Russia, Belgium, Poland, Czech Republic, China, India, Japan, Australia, Brazil, Argentina, Colombia, Saudi Arabia, UAE, Iran, South Africa
Key companies profiled Seton – A Brandy Corporation Company; Metal Marker Manufacturing; Inland Products; Big City Manufacturing; Tag-It Industries; Ketchum Manufacturing Inc and National Band & Tag company
Customization scope Free report customization (equivalent to up to 8 analysts working days) with purchase. Addition or alteration to country, regional & segment scope.
Pricing and purchase options Avail customized purchase options to meet your exact research needs.

Segments

By Thickness:

  • Less than 30 mm
  • 30-50 mm
  • Above 50 mm

By Product Type:

  • Engraved
  • Blank

By Distribution Channel:

  • Online
  • Offline

By Region:

  • North America
  • Latin America
  • Western Europe
  • Eastern Europe
  • East Asia
  • South Asia and Pacific
  • Middle East & Africa

Table of Content

  1. Executive Summary
    • Global Market Outlook
    • Demand-side Trends
    • Supply-side Trends
    • Technology Roadmap Analysis
    • Analysis and Recommendations
  2. Market Overview
    • Market Coverage / Taxonomy
    • Market Definition / Scope / Limitations
  3. Market Background
    • Market Dynamics
      • Drivers
      • Restraints
      • Opportunity
      • Trends
    • Scenario Forecast
      • Demand in Optimistic Scenario
      • Demand in Likely Scenario
      • Demand in Conservative Scenario
    • Opportunity Map Analysis
    • Product Life Cycle Analysis
    • Supply Chain Analysis
    • Investment Feasibility Matrix
    • Value Chain Analysis
    • PESTLE and Porter’s Analysis
    • Regulatory Landscape
    • Regional Parent Market Outlook
    • Production and Consumption Statistics
    • Import and Export Statistics
  4. Global Market Analysis 2020-2024 and Forecast, 2025-2035
    • Historical Market Size Value (USD Million) Analysis, 2020-2024
    • Current and Future Market Size Value (USD Million) Projections, 2025-2035
      • Y-o-Y Growth Trend Analysis
      • Absolute $ Opportunity Analysis
  5. Global Market Pricing Analysis 2020-2024 and Forecast 2025-2035
  6. Global Market Analysis 2020-2024 and Forecast 2025-2035, By Thickness
    • Introduction / Key Findings
    • Historical Market Size Value (USD Million) Analysis By Thickness , 2020-2024
    • Current and Future Market Size Value (USD Million) Analysis and Forecast By Thickness , 2025-2035
      • Less than 30 mm
      • 30-50 mm
      • Above 50 mm
    • Y-o-Y Growth Trend Analysis By Thickness , 2020-2024
    • Absolute $ Opportunity Analysis By Thickness , 2025-2035
  7. Global Market Analysis 2020-2024 and Forecast 2025-2035, By Product Type
    • Introduction / Key Findings
    • Historical Market Size Value (USD Million) Analysis By Product Type, 2020-2024
    • Current and Future Market Size Value (USD Million) Analysis and Forecast By Product Type, 2025-2035
      • Engraved
      • Blank
    • Y-o-Y Growth Trend Analysis By Product Type, 2020-2024
    • Absolute $ Opportunity Analysis By Product Type, 2025-2035
  8. Global Market Analysis 2020-2024 and Forecast 2025-2035, By Distribution Channel
    • Introduction / Key Findings
    • Historical Market Size Value (USD Million) Analysis By Distribution Channel, 2020-2024
    • Current and Future Market Size Value (USD Million) Analysis and Forecast By Distribution Channel, 2025-2035
      • Online
      • Offline
    • Y-o-Y Growth Trend Analysis By Distribution Channel, 2020-2024
    • Absolute $ Opportunity Analysis By Distribution Channel, 2025-2035
  9. Global Market Analysis 2020-2024 and Forecast 2025-2035, By Region
    • Introduction
    • Historical Market Size Value (USD Million) Analysis By Region, 2020-2024
    • Current Market Size Value (USD Million) Analysis and Forecast By Region, 2025-2035
      • North America
      • Latin America
      • Western Europe
      • Eastern Europe
      • East Asia
      • South Asia and Pacific
      • Middle East & Africa
    • Market Attractiveness Analysis By Region
  10. North America Market Analysis 2020-2024 and Forecast 2025-2035, By Country
    • Historical Market Size Value (USD Million) Trend Analysis By Market Taxonomy, 2020-2024
    • Market Size Value (USD Million) Forecast By Market Taxonomy, 2025-2035
      • By Country
        • U.S.
        • Canada
        • Mexico
      • By Thickness
      • By Product Type
      • By Distribution Channel
    • Market Attractiveness Analysis
      • By Country
      • By Thickness
      • By Product Type
      • By Distribution Channel
    • Key Takeaways
  11. Latin America Market Analysis 2020-2024 and Forecast 2025-2035, By Country
    • Historical Market Size Value (USD Million) Trend Analysis By Market Taxonomy, 2020-2024
    • Market Size Value (USD Million) Forecast By Market Taxonomy, 2025-2035
      • By Country
        • Brazil
        • Chile
        • Rest of Latin America
      • By Thickness
      • By Product Type
      • By Distribution Channel
    • Market Attractiveness Analysis
      • By Country
      • By Thickness
      • By Product Type
      • By Distribution Channel
    • Key Takeaways
  12. Western Europe Market Analysis 2020-2024 and Forecast 2025-2035, By Country
    • Historical Market Size Value (USD Million) Trend Analysis By Market Taxonomy, 2020-2024
    • Market Size Value (USD Million) Forecast By Market Taxonomy, 2025-2035
      • By Country
        • Germany
        • U.K.
        • Italy
        • Spain
        • France
        • Nordic
        • BENELUX
        • Rest of Western Europe
      • By Thickness
      • By Product Type
      • By Distribution Channel
    • Market Attractiveness Analysis
      • By Country
      • By Thickness
      • By Product Type
      • By Distribution Channel
    • Key Takeaways
  13. Eastern Europe Market Analysis 2020-2024 and Forecast 2025-2035, By Country
    • Historical Market Size Value (USD Million) Trend Analysis By Market Taxonomy, 2020-2024
    • Market Size Value (USD Million) Forecast By Market Taxonomy, 2025-2035
      • By Country
        • Russia
        • Poland
        • Hungary
        • Balkan & Baltic
        • Rest of Eastern Europe
      • By Thickness
      • By Product Type
      • By Distribution Channel
    • Market Attractiveness Analysis
      • By Country
      • By Thickness
      • By Product Type
      • By Distribution Channel
    • Key Takeaways
  14. East Asia Market Analysis 2020-2024 and Forecast 2025-2035, By Country
    • Historical Market Size Value (USD Million) Trend Analysis By Market Taxonomy, 2020-2024
    • Market Size Value (USD Million) Forecast By Market Taxonomy, 2025-2035
      • By Country
        • China
        • Japan
        • South Korea
      • By Thickness
      • By Product Type
      • By Distribution Channel
    • Market Attractiveness Analysis
      • By Country
      • By Thickness
      • By Product Type
      • By Distribution Channel
    • Key Takeaways
  15. South Asia and Pacific Market Analysis 2020-2024 and Forecast 2025-2035, By Country
    • Historical Market Size Value (USD Million) Trend Analysis By Market Taxonomy, 2020-2024
    • Market Size Value (USD Million) Forecast By Market Taxonomy, 2025-2035
      • By Country
        • India
        • ASEAN
        • Australia & New Zealand
        • Rest of South Asia and Pacific
      • By Thickness
      • By Product Type
      • By Distribution Channel
    • Market Attractiveness Analysis
      • By Country
      • By Thickness
      • By Product Type
      • By Distribution Channel
    • Key Takeaways
  16. Middle East & Africa Market Analysis 2020-2024 and Forecast 2025-2035, By Country
    • Historical Market Size Value (USD Million) Trend Analysis By Market Taxonomy, 2020-2024
    • Market Size Value (USD Million) Forecast By Market Taxonomy, 2025-2035
      • By Country
        • Kingdom of Saudi Arabia
        • Other GCC Countries
        • Turkiye
        • South Africa
        • Other African Union
        • Rest of Middle East & Africa
      • By Thickness
      • By Product Type
      • By Distribution Channel
    • Market Attractiveness Analysis
      • By Country
      • By Thickness
      • By Product Type
      • By Distribution Channel
    • Key Takeaways
  17. Key Countries Market Analysis
    • U.S.
      • Pricing Analysis
      • Market Share Analysis, 2024
        • By Thickness
        • By Product Type
        • By Distribution Channel
    • Canada
      • Pricing Analysis
      • Market Share Analysis, 2024
        • By Thickness
        • By Product Type
        • By Distribution Channel
    • Mexico
      • Pricing Analysis
      • Market Share Analysis, 2024
        • By Thickness
        • By Product Type
        • By Distribution Channel
    • Brazil
      • Pricing Analysis
      • Market Share Analysis, 2024
        • By Thickness
        • By Product Type
        • By Distribution Channel
    • Chile
      • Pricing Analysis
      • Market Share Analysis, 2024
        • By Thickness
        • By Product Type
        • By Distribution Channel
    • Germany
      • Pricing Analysis
      • Market Share Analysis, 2024
        • By Thickness
        • By Product Type
        • By Distribution Channel
    • U.K.
      • Pricing Analysis
      • Market Share Analysis, 2024
        • By Thickness
        • By Product Type
        • By Distribution Channel
    • Italy
      • Pricing Analysis
      • Market Share Analysis, 2024
        • By Thickness
        • By Product Type
        • By Distribution Channel
    • Spain
      • Pricing Analysis
      • Market Share Analysis, 2024
        • By Thickness
        • By Product Type
        • By Distribution Channel
    • France
      • Pricing Analysis
      • Market Share Analysis, 2024
        • By Thickness
        • By Product Type
        • By Distribution Channel
    • India
      • Pricing Analysis
      • Market Share Analysis, 2024
        • By Thickness
        • By Product Type
        • By Distribution Channel
    • ASEAN
      • Pricing Analysis
      • Market Share Analysis, 2024
        • By Thickness
        • By Product Type
        • By Distribution Channel
    • Australia & New Zealand
      • Pricing Analysis
      • Market Share Analysis, 2024
        • By Thickness
        • By Product Type
        • By Distribution Channel
    • China
      • Pricing Analysis
      • Market Share Analysis, 2024
        • By Thickness
        • By Product Type
        • By Distribution Channel
    • Japan
      • Pricing Analysis
      • Market Share Analysis, 2024
        • By Thickness
        • By Product Type
        • By Distribution Channel
    • South Korea
      • Pricing Analysis
      • Market Share Analysis, 2024
        • By Thickness
        • By Product Type
        • By Distribution Channel
    • Russia
      • Pricing Analysis
      • Market Share Analysis, 2024
        • By Thickness
        • By Product Type
        • By Distribution Channel
    • Poland
      • Pricing Analysis
      • Market Share Analysis, 2024
        • By Thickness
        • By Product Type
        • By Distribution Channel
    • Hungary
      • Pricing Analysis
      • Market Share Analysis, 2024
        • By Thickness
        • By Product Type
        • By Distribution Channel
    • Kingdom of Saudi Arabia
      • Pricing Analysis
      • Market Share Analysis, 2024
        • By Thickness
        • By Product Type
        • By Distribution Channel
    • Turkiye
      • Pricing Analysis
      • Market Share Analysis, 2024
        • By Thickness
        • By Product Type
        • By Distribution Channel
    • South Africa
      • Pricing Analysis
      • Market Share Analysis, 2024
        • By Thickness
        • By Product Type
        • By Distribution Channel
  18. Market Structure Analysis
    • Competition Dashboard
    • Competition Benchmarking
    • Market Share Analysis of Top Players
      • By Regional
      • By Thickness
      • By Product Type
      • By Distribution Channel
  19. Competition Analysis
    • Competition Deep Dive
      • Brady Corporation
        • Overview
        • Product Portfolio
        • Profitability by Market Segments (Product/Age /Sales Channel/Region)
        • Sales Footprint
        • Strategy Overview
          • Marketing Strategy
          • Product Strategy
          • Channel Strategy
      • ARCAT, Inc.
      • Partex Direct
      • TUFFA Products
      • Creative Safety Supply
      • Marking Services Canada
      • Brimar Industries, LLC.
      • CABLECRAFT
      • Identitag Limited
      • Monroe Specialty Company, Inc.
      • Hartac
      • Uticom System Inc.
  20. Assumptions & Acronyms Used
  21. Research Methodology

List of Tables

  • Table 1: Global Market Value (USD Million) Forecast by Region, 2020-2035
  • Table 2: North America Market Value (USD Million) Forecast by Country, 2020-2035
  • Table 3: Latin America Market Value (USD Million) Forecast by Country, 2020-2035
  • Table 4: Western Europe Market Value (USD Million) Forecast by Country, 2020-2035
  • Table 5: Eastern Europe Market Value (USD Million) Forecast by Country, 2020-2035
  • Table 6: East Asia Market Value (USD Million) Forecast by Country, 2020-2035
  • Table 7: South Asia and Pacific Market Value (USD Million) Forecast by Country, 2020-2035
  • Table 8: Middle East & Africa Market Value (USD Million) Forecast by Country, 2020-2035

List of Figures

  • Figure 1: Global Market Pricing Analysis
  • Figure 2: Global Market Value (USD Million) Forecast 2020-2035
  • Figure 3: Global Market Value (USD Million) Share and BPS Analysis by Region, 2025 and 2035
  • Figure 4: Global Market Y-o-Y Growth Comparison by Region, 2025-2035
  • Figure 5: Global Market Attractiveness Analysis by Region
  • Figure 6: North America Market Incremental $ Opportunity, 2025-2035
  • Figure 7: Latin America Market Incremental $ Opportunity, 2025-2035
  • Figure 8: Western Europe Market Incremental $ Opportunity, 2025-2035
  • Figure 9: Eastern Europe Market Incremental $ Opportunity, 2025-2035
  • Figure 10: East Asia Market Incremental $ Opportunity, 2025-2035
  • Figure 11: South Asia and Pacific Market Incremental $ Opportunity, 2025-2035
  • Figure 12: Middle East & Africa Market Incremental $ Opportunity, 2025-2035
  • Figure 13: North America Market Value Share and BPS Analysis by Country, 2025 and 2035
  • Figure 14: Latin America Market Value Share and BPS Analysis by Country, 2025 and 2035
  • Figure 15: Western Europe Market Value Share and BPS Analysis by Country, 2025 and 2035
  • Figure 16: Eastern Europe Market Value Share and BPS Analysis by Country, 2025 and 2035
  • Figure 17: East Asia Market Value Share and BPS Analysis by Country, 2025 and 2035
  • Figure 18: South Asia and Pacific Market Value Share and BPS Analysis by Country, 2025 and 2035
  • Figure 19: Middle East & Africa Market Value Share and BPS Analysis by Country, 2025 and 2035
  • Figure 20: Global Market - Tier Structure Analysis
  • Figure 21: Global Market - Company Share Analysis

Frequently Asked Questions

How big is the stainless steel valve tag market in 2025?

The global stainless steel valve tag market is estimated to be valued at USD 6.4 billion in 2025.

What will be the market size for the stainless steel valve tag market in 2035?

It is projected to reach USD 9.8 billion by 2035.

How much will be the CAGR of the stainless steel valve tag market between 2025 and 2035?

The market is expected to grow at a 4.3% CAGR between 2025 and 2035.

What are the key product types in the stainless steel valve tag market?

The key product types are less than 30 mm, 30-50 mm and above 50 mm.

Which engraved segment is expected to dominate the stainless steel valve tag market in 2025?

engraved segment is expected to dominate with a 57.8% industry share in 2025.

Explore Similar Insights

Future Market Insights

Stainless Steel Valve Tag Market