Stainless Steel Water Bottles Market Size and Share Forecast Outlook 2025 to 2035

The global stainless steel water bottles market is projected to grow from USD 1.5 billion in 2025 to USD 2.6 billion by 2035, registering a CAGR of 5.5% during the forecast period. Sales in 2024 were recorded at USD 1,432.3 million.
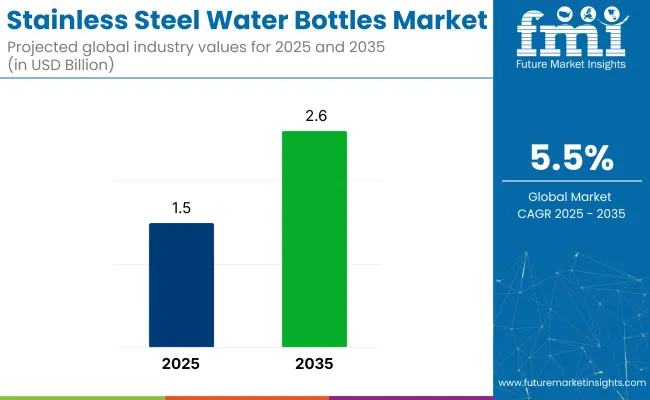
Quick Stats of Stainless Steel Water Bottles Market

  • Market Value (2025): USD 1.5 billion
  • Forecast Value (2035): USD 2.6 billion
  • Forecast CAGR: 5.5%
  • Capacity Leader in 2025: 750 ml to 1000 ml (36.8% market share)
  • Top Usage: Everyday usage (42.5% share)
  • Key Growth Country: East Asia (China is the fastest-growing market with 6.4% CAGR)

Stainless Steel Water Bottles Market

Metric Value
Market Size (2025E) USD 1.5 billion
Market Value (2035F) USD 2.6 billion
CAGR (2025 to 2035) 5.5%

This growth is primarily attributed to rising environmental concerns, regulations banning single-use plastics, and increasing consumer demand for durable, safe hydration options.Stainless steel bottles offer temperature insulation, corrosion resistance, and reusability, making them attractive to health-conscious and eco-aware consumers. Aesthetic customization, lifestyle branding, and portability have made these bottles a preferred choice across urban, fitness, and student populations.

In January 2025, YETI Holdings, a leading premium drinkware and outdoor lifestyle brand, reported a 22% increase in international sales, now comprising 23% of total revenue. This strategic growth was driven by YETI’s expanded footprint in the European and Asia-Pacific markets, supported by investments in regional distribution and digital retail infrastructure.

“We’re focused on reducing our reliance on Chinese manufacturing while expanding our brand presence in key global markets,” stated Matt Reintjes, President and CEO of YETI, during the Q1 2025 earnings call. The company aims to reduce sourcing from China to below 5% for the USA market by the end of 2025. These moves underline YETI’s long-term strategy to diversify its supply chain and strengthen global market penetration across premium stainless steel hydration products.

Recent innovations include smart lids, magnetic caps, temperature indicators, and triple-wall insulation. Brands are integrating 18/10 food-grade steel for enhanced longevity and launching customized designs with matte coatings and sustainable packaging.

The market is expected to grow rapidly across Asia-Pacific, fueled by urbanization, online retail growth, and increasing government regulation on plastic usage. Manufacturers are likely to prioritize ergonomic, affordable, and region-specific product offerings to sustain competitive growth.

Analyzing by stainless steel water bottles market Top Investment Segment

The market has been segmented based on capacity, usage, sales channel, and region. By capacity, up to 500 ml, 501 ml to 750 ml, 750 ml to 1000 ml, and more than 1000 ml variants have been developed to address hydration needs ranging from compact portability to extended outdoor use.

Every day, sports, office, recreation, and other usage categories (including travel) have been adopted to align with consumers’ lifestyle, work environment, and fitness preferences. Sales channels have been divided into manufacturers (direct sales), retail, hypermarkets, supermarkets, convenience stores, distributors, and online platforms to reflect evolving purchase behavior across urban and rural geographies.

Regional segmentation has been conducted for North America, Latin America, East Asia, South Asia & Pacific, Western Europe, Eastern Europe, and the Middle East & Africa to capture differences in health consciousness, retail penetration, and environmental policy trends impacting sustainable product adoption.
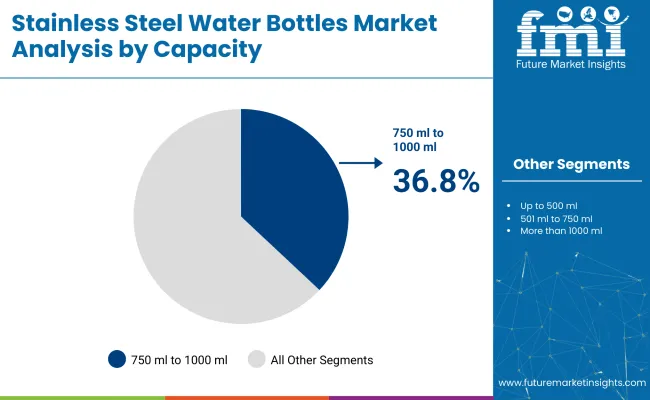
750 ml to 1000 ml Segment Gains Maximum Preference for Optimal Portability and Capacity

Stainless Steel Water Bottles Market Analysis By Capacity

The 750 ml to 1000 ml segment is projected to dominate the stainless steel water bottles market with a 36.8% share in 2025, attributed to its ideal balance between volume, portability, and consumer hydration needs. This capacity range is widely adopted across lifestyle, sports, and office use cases where consumers prefer bottles that last several hours without being bulky.

These bottles offer practical hydration for daily routines, gym sessions, and short hikes, catering to growing health-conscious behaviors and sustainable living trends. Their mid-range size also meets the bottle-size limits preferred by backpack users, cyclists, and commuters, particularly in urban and travel environments. Brands such as Hydro Flask and Thermos have capitalized on this preference, offering vacuum-insulated, leak-proof options with aesthetic finishes and ergonomic grips within this volume bracket.

Advanced designs featuring temperature retention (up to 24 hours cold / 12 hours hot), wide-mouth openings, and compatibility with cup holders have further reinforced the 750 ml to 1000 ml segment's versatility. Moreover, regulatory momentum against single-use plastic bottles in schools, workplaces, and government facilities has contributed to its widespread appeal. As demand for mid-size, reusable hydration gear expands, this segment is poised to remain a core contributor to overall market value through 2035.
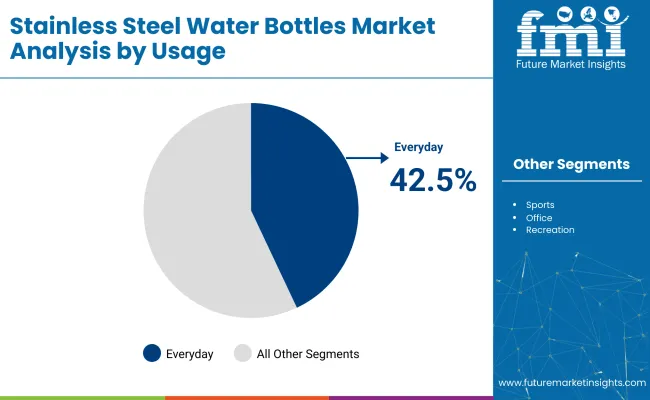
Everyday Usage Leads Application Share Amidst Lifestyle Shifts and Eco-Conscious Adoption

Stainless Steel Water Bottles Market Analysis By Usage

The everyday usage segment is forecasted to lead the application category in the stainless steel water bottles market with a 42.5% share in 2025, driven by rising awareness about hydration, environmental sustainability, and long-term health. Consumers increasingly opt for durable, reusable water bottles as part of their daily carry essentials at work, school, commuting, or during errands.

This usage trend aligns with broader shifts toward eco-friendly products in response to climate change discourse and plastic waste reduction goals. Stainless steel bottles offer a superior alternative to single-use plastics by ensuring BPA-free, rust-resistant, and odor-neutral hydration solutions. With urban consumers seeking practical and stylish accessories, manufacturers have introduced slim-profile bottles with minimalist aesthetics, integrated handles, and detachable lids for convenience during every day routines.

Retail brands have also targeted the daily use demographic through smart marketing campaigns around wellness, zero-waste lifestyles, and corporate giveaways. Online marketplaces, department stores, and lifestyle brands continue to bundle every day-use bottles in seasonal and gift packaging to drive volume sales. This segment’s resilience lies in its wide demographic appeal from students and professionals to homemakers making it a strategic focal point for brand expansion and innovation.

Challenges and Opportunities

Challenge

High Production Costs and Market Competition

To mitigate the high demand for stainless steel water bottles, the challenge lies in elevated production costs for raw materials and manufacturing processes. Alternative reusable bottle materials, including glass and BPA-free plastics, also provide competition that results in pressure on pricing and brand standing.

Opportunity

Innovation in Design and Smart Bottles

The market has lucrative growth opportunities driven by technological advancements in stainless steel water bottle features, such as enhancements in temperature retention and built-in filtration systems, as well as smart hydration tracking.

Businesses that focus on innovative designs and customization are likely to secure a niche in the market. The market will be further driven by collaborations with fitness and wellness brands and growing distribution networks.
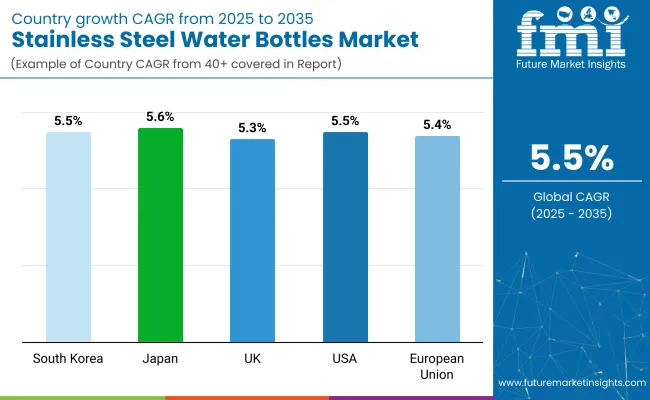
Country-wise Insights

Country Wise Analysis Of Stainless Steel Water Bottles Market

United States

The USA stainless steel water bottles market is driven by increasing awareness of sustainability, growing demand for an eco-friendly alternative over plastic bottles, rising demand from outdoor activities and pet owners, and higher adoption of healthy hydration habits across the population fuels the market expansion in this region.

Product safety, the materials used and environmental impact are governed by Regulatory bodies such as the USA Food and Drug Administration (FDA) and the Environmental Protection Agency (EPA).

The major trends projected to drive the overall market include rising preference for insulated stainless-steel bottles, continuing penetration of BPA-free and food-grade stainless steel and flourishing investments in customized and smart water bottles, with temperature regulator and hydration tracking. In addition, market growth is being propelled by corporate sustainability initiatives and the boot of single-use plastics across multiple states.

Country CAGR (2025 to 2035)
USA 5.5%

United Kingdom

The UK stainless steel water bottles market is growing slowly. More people care about the planet. The government limits single-use plastics. Shoppers like fancy, insulated bottles more. For example, the UK's Environment Agency and the British Standards Institution set rules for the materials used to make sure the bottles are good and safe.

The market is seeing a shift to green and light designs. There is a rise in buying branded and luxury bottles. Online shops and special stores are also selling more of these bottles. There is a growing adoption of reusable drinkware also from the corporate wellness programs which promote their use.

Country CAGR (2025 to 2035)
UK 5.3%

European Union

As the European Union has stringent environmental regulations and consumers prefer durable and recyclable drinkware, sales of stainless steel water bottles are expected to create a substantial market opportunity in this region, accompanied by rising demand for high-end and customizable bottles. The same goes for the European Chemicals Agency (ECHA) and the European Commission (EC) who govern product safety, material quality, and environmental impact.

Germany, France, and the Netherlands also dominate the market because of a high level of consumer awareness of sustainability, a strong retail distribution network, and corporate efforts to reduce plastic waste. Moreover, increasing usage of vacuum-insulated bottles for keeping beverages temperature stable is fuelling innovation.

Country CAGR (2025 to 2035)
European Union (EU) 5.4%

Japan

The stainless steel water bottles market in Japan is thriving due to high consumer demand for durable, leak-proof, and insulated bottles, increasing health-conscious habits, and government initiatives promoting sustainable and plastic-free alternatives. The MHLW and JSSA governs the safety of materials and quality of products.

Important trends in the market are complex product designs featuring smooth, ergonomic aesthetics,high sales of thermos-style and vacuum-insulated bottles and growing demand for lightweight stainless steel bottles such as those used for outdoors or debt use. Japan’s high-tech approach to hydration is also driving demand for smart and sensor-enabled stainless steel bottles.

Country CAGR (2025 to 2035)
Japan 5.6%

South Korea

The South Korea market for stainless steel water bottles is segmented on the basis of product type, and distribution channel. Korea Ministry of Environment (MOE) regulation on product safety and Korean Agency for Technology and Standards (KATS) regulation on product sustainability standard.

Rising adoption of personalized and premium range of stainless steel bottles, growing demand for insulated and multifunctional bottles for hot and cold beverages, and increasing innovation in compact and foldable designs for convenience. K-lifestyle trends are also propelling partnerships between beverage and reusable bottle brands.

Country CAGR (2025 to 2035)
South Korea 5.5%

Competitive Outlook

The market for stainless steel water bottles is growing fast. People like eco-friendly and reusable drink containers. They worry about plastic waste. New tech keeps drinks hot or cold longer. Buyers want bottles that last, that don't leak harmful chemicals, and that keep drinks at the right temp.

Firms are making new designs and using green methods. Some bottles even have smart tech for drinking. Big bottle makers, lifestyle brands, and green firms are in this market.

Key Companies

  • Thermos LLC
  • BRITA GmbH
  • SIGG Switzerland Bottles AG
  • Tiger Corporation
  • Zojirushi America Corporation.
  • ZheJiang Haers Vacuum Containers Co., Ltd
  • Cool Gear International, LLC.
  • Klean Kanteen, Inc.
  • Probott
  • Safeshine Industrial Limited

Key Segmentation

By Capacity:

  • Up to 500 ml
  • 501 ml to 750 ml
  • 750 ml to 1000 ml
  • More than 1000 ml

By Usage:

  • Everyday
  • Sports
  • Office
  • Recreation
  • Others (Travel, etc.)

By Sales Channel:

  • Manufacturers (Direct Sales)
  • Retail
  • Hypermarket
  • Supermarket
  • Convenience Stores
  • Distributors
  • Online

By Region:

  • North America
  • Latin America
  • East Asia
  • South Asia & Pacific
  • Western Europe
  • Eastern Europe
  • Middle East and Africa (MEA)

Table of Content

  1. Executive Summary
    • Global Market Outlook
    • Demand-side Trends
    • Supply-side Trends
    • Technology Roadmap Analysis
    • Analysis and Recommendations
  2. Market Overview
    • Market Coverage/Taxonomy
    • Market Definition/Scope/Limitations
  3. Market Background
    • Market Dynamics
      • Drivers
      • Restraints
      • Opportunity
      • Trends
    • Scenario Forecast
      • Demand in Optimistic Scenario
      • Demand in Likely Scenario
      • Demand in Conservative Scenario
    • Opportunity Map Analysis
    • Product Life Cycle Analysis
    • Supply Chain Analysis
      • Supply Side Participants and their Roles
        • Producers
        • Mid-Level Participants (Traders/ Agents/ Brokers)
        • Wholesalers and Distributors
      • Value Added and Value Created at Node in the Supply Chain
      • List of Raw Material Suppliers
      • List of Existing and Potential Buyer’s
    • Investment Feasibility Matrix
    • Value Chain Analysis
      • Profit Margin Analysis
      • Wholesalers and Distributors
      • Retailers
    • PESTLE and Porter’s Analysis
    • Regulatory Landscape
      • By Key Regions
      • By Key Countries
    • Regional Parent Market Outlook
    • Production and Consumption Statistics
    • Import and Export Statistics
  4. Global Market Analysis 2020 to 2024 and Forecast, 2025 to 2035
    • Historical Market Size Value (USD Million) & Volume (Units) Analysis, 2020 to 2024
    • Current and Future Market Size Value (USD Million) & Volume (Units) Projections, 2025 to 2035
      • Y-o-Y Growth Trend Analysis
      • Absolute $ Opportunity Analysis
  5. Global Market Pricing Analysis 2020 to 2024 and Forecast 2025 to 2035
  6. Global Market Analysis 2020 to 2024 and Forecast 2025 to 2035, By Capacity
    • Introduction/Key Findings
    • Historical Market Size Value (USD Million) & Volume (Units) Analysis By Capacity, 2020 to 2024
    • Current and Future Market Size Value (USD Million) & Volume (Units) Analysis and Forecast By Capacity, 2025 to 2035
      • Up to 500 ml
      • 501 ml to 750 ml
      • 750 ml to 1000 ml
      • More than 1000 ml
    • Y-o-Y Growth Trend Analysis By Capacity, 2020 to 2024
    • Absolute $ Opportunity Analysis By Capacity, 2025 to 2035
  7. Global Market Analysis 2020 to 2024 and Forecast 2025 to 2035, By Usage
    • Introduction/Key Findings
    • Historical Market Size Value (USD Million) & Volume (Units) Analysis By Usage, 2020 to 2024
    • Current and Future Market Size Value (USD Million) & Volume (Units) Analysis and Forecast By Usage, 2025 to 2035
      • Everyday
      • Sports
      • Office
      • Recreation
      • Others (Travel, etc.)
    • Y-o-Y Growth Trend Analysis By Usage, 2020 to 2024
    • Absolute $ Opportunity Analysis By Usage, 2025 to 2035
  8. Global Market Analysis 2020 to 2024 and Forecast 2025 to 2035, By Sales Channel
    • Introduction/Key Findings
    • Historical Market Size Value (USD Million) & Volume (Units) Analysis By Sales Channel, 2020 to 2024
    • Current and Future Market Size Value (USD Million) & Volume (Units) Analysis and Forecast By Sales Channel, 2025 to 2035
      • Manufacturers (Direct Sales)
      • Retail
      • Hypermarket
      • Supermarket
      • Convenience Stores
      • Distributors
      • Online
    • Y-o-Y Growth Trend Analysis By Sales Channel, 2020 to 2024
    • Absolute $ Opportunity Analysis By Sales Channel, 2025 to 2035
  9. Global Market Analysis 2020 to 2024 and Forecast 2025 to 2035, By Region
    • Introduction
    • Historical Market Size Value (USD Million) & Volume (Units) Analysis By Region, 2020 to 2024
    • Current Market Size Value (USD Million) & Volume (Units) Analysis and Forecast By Region, 2025 to 2035
      • North America
      • Latin America
      • Europe
      • East Asia
      • South Asia
      • Oceania
      • MEA
    • Market Attractiveness Analysis By Region
  10. North America Market Analysis 2020 to 2024 and Forecast 2025 to 2035, By Country
    • Historical Market Size Value (USD Million) & Volume (Units) Trend Analysis By Market Taxonomy, 2020 to 2024
    • Market Size Value (USD Million) & Volume (Units) Forecast By Market Taxonomy, 2025 to 2035
      • By Country
        • USA
        • Canada
      • By Capacity
      • By Usage
      • By Sales Channel
    • Market Attractiveness Analysis
      • By Country
      • By Capacity
      • By Usage
      • By Sales Channel
    • Key Takeaways
  11. Latin America Market Analysis 2020 to 2024 and Forecast 2025 to 2035, By Country
    • Historical Market Size Value (USD Million) & Volume (Units) Trend Analysis By Market Taxonomy, 2020 to 2024
    • Market Size Value (USD Million) & Volume (Units) Forecast By Market Taxonomy, 2025 to 2035
      • By Country
        • Brazil
        • Mexico
        • Argentina
        • Chile
        • Peru
        • Rest of Latin America
      • By Capacity
      • By Usage
      • By Sales Channel
    • Market Attractiveness Analysis
      • By Country
      • By Capacity
      • By Usage
      • By Sales Channel
    • Key Takeaways
  12. Europe Market Analysis 2020 to 2024 and Forecast 2025 to 2035, By Country
    • Historical Market Size Value (USD Million) & Volume (Units) Trend Analysis By Market Taxonomy, 2020 to 2024
    • Market Size Value (USD Million) & Volume (Units) Forecast By Market Taxonomy, 2025 to 2035
      • By Country
        • Germany
        • Italy
        • France
        • UK
        • Spain
        • Russia
        • BENELUX
        • Rest of Europe
      • By Capacity
      • By Usage
      • By Sales Channel
    • Market Attractiveness Analysis
      • By Country
      • By Capacity
      • By Usage
      • By Sales Channel
    • Key Takeaways
  13. East Asia Market Analysis 2020 to 2024 and Forecast 2025 to 2035, By Country
    • Historical Market Size Value (USD Million) & Volume (Units) Trend Analysis By Market Taxonomy, 2020 to 2024
    • Market Size Value (USD Million) & Volume (Units) Forecast By Market Taxonomy, 2025 to 2035
      • By Country
        • China
        • Japan
        • South Korea
      • By Capacity
      • By Usage
      • By Sales Channel
    • Market Attractiveness Analysis
      • By Country
      • By Capacity
      • By Usage
      • By Sales Channel
    • Key Takeaways
  14. South Asia Market Analysis 2020 to 2024 and Forecast 2025 to 2035, By Country
    • Historical Market Size Value (USD Million) & Volume (Units) Trend Analysis By Market Taxonomy, 2020 to 2024
    • Market Size Value (USD Million) & Volume (Units) Forecast By Market Taxonomy, 2025 to 2035
      • By Country
        • India
        • Thailand
        • Malaysia
        • Indonesia
        • Rest of South Asia
      • By Capacity
      • By Usage
      • By Sales Channel
    • Market Attractiveness Analysis
      • By Country
      • By Capacity
      • By Usage
      • By Sales Channel
    • Key Takeaways
  15. Oceania Market Analysis 2020 to 2024 and Forecast 2025 to 2035, By Country
    • Historical Market Size Value (USD Million) & Volume (Units) Trend Analysis By Market Taxonomy, 2020 to 2024
    • Market Size Value (USD Million) & Volume (Units) Forecast By Market Taxonomy, 2025 to 2035
      • By Country
        • Australia
        • New Zealand
      • By Capacity
      • By Usage
      • By Sales Channel
    • Market Attractiveness Analysis
      • By Country
      • By Capacity
      • By Usage
      • By Sales Channel
    • Key Takeaways
  16. MEA Market Analysis 2020 to 2024 and Forecast 2025 to 2035, By Country
    • Historical Market Size Value (USD Million) & Volume (Units) Trend Analysis By Market Taxonomy, 2020 to 2024
    • Market Size Value (USD Million) & Volume (Units) Forecast By Market Taxonomy, 2025 to 2035
      • By Country
        • GCC
        • Rest of MEA
      • By Capacity
      • By Usage
      • By Sales Channel
    • Market Attractiveness Analysis
      • By Country
      • By Capacity
      • By Usage
      • By Sales Channel
    • Key Takeaways
  17. Key Countries Market Analysis
    • USA
      • Pricing Analysis
      • Market Share Analysis, 2024
        • By Capacity
        • By Usage
        • By Sales Channel
    • Canada
      • Pricing Analysis
      • Market Share Analysis, 2024
        • By Capacity
        • By Usage
        • By Sales Channel
    • Brazil
      • Pricing Analysis
      • Market Share Analysis, 2024
        • By Capacity
        • By Usage
        • By Sales Channel
    • Mexico
      • Pricing Analysis
      • Market Share Analysis, 2024
        • By Capacity
        • By Usage
        • By Sales Channel
    • Argentina
      • Pricing Analysis
      • Market Share Analysis, 2024
        • By Capacity
        • By Usage
        • By Sales Channel
  18. Market Structure Analysis
    • Competition Dashboard
    • Competition Benchmarking
    • Market Share Analysis of Top Players
      • By Regional
      • By Capacity
      • By Usage
      • By Sales Channel
  19. Competition Analysis
    • Competition Deep Dive
      • Thermos LLC
        • Overview
        • Product Portfolio
        • Profitability by Market Segments (Product/Age /Sales Channel/Region)
        • Sales Footprint
        • Strategy Overview
          • Marketing Strategy
          • Product Strategy
          • Channel Strategy
      • BRITA GmbH
        • Overview
        • Product Portfolio
        • Profitability by Market Segments (Product/Age /Sales Channel/Region)
        • Sales Footprint
        • Strategy Overview
          • Marketing Strategy
          • Product Strategy
          • Channel Strategy
      • SIGG Switzerland Bottles AG
        • Overview
        • Product Portfolio
        • Profitability by Market Segments (Product/Age /Sales Channel/Region)
        • Sales Footprint
        • Strategy Overview
          • Marketing Strategy
          • Product Strategy
          • Channel Strategy
      • Tiger Corporation
        • Overview
        • Product Portfolio
        • Profitability by Market Segments (Product/Age /Sales Channel/Region)
        • Sales Footprint
        • Strategy Overview
          • Marketing Strategy
          • Product Strategy
          • Channel Strategy
      • Zojirushi America Corporation.
        • Overview
        • Product Portfolio
        • Profitability by Market Segments (Product/Age /Sales Channel/Region)
        • Sales Footprint
        • Strategy Overview
          • Marketing Strategy
          • Product Strategy
          • Channel Strategy
      • ZheJiang Haers Vacuum Containers Co., Ltd
        • Overview
        • Product Portfolio
        • Profitability by Market Segments (Product/Age /Sales Channel/Region)
        • Sales Footprint
        • Strategy Overview
          • Marketing Strategy
          • Product Strategy
          • Channel Strategy
      • Cool Gear International, LLC.
        • Overview
        • Product Portfolio
        • Profitability by Market Segments (Product/Age /Sales Channel/Region)
        • Sales Footprint
        • Strategy Overview
          • Marketing Strategy
          • Product Strategy
          • Channel Strategy
      • Klean Kanteen, Inc.
        • Overview
        • Product Portfolio
        • Profitability by Market Segments (Product/Age /Sales Channel/Region)
        • Sales Footprint
        • Strategy Overview
          • Marketing Strategy
          • Product Strategy
          • Channel Strategy
      • Probott
        • Overview
        • Product Portfolio
        • Profitability by Market Segments (Product/Age /Sales Channel/Region)
        • Sales Footprint
        • Strategy Overview
          • Marketing Strategy
          • Product Strategy
          • Channel Strategy
      • Safeshine Industrial Limited
        • Overview
        • Product Portfolio
        • Profitability by Market Segments (Product/Age /Sales Channel/Region)
        • Sales Footprint
        • Strategy Overview
          • Marketing Strategy
          • Product Strategy
          • Channel Strategy
  20. Assumptions & Acronyms Used
  21. Research Methodology

List of Tables

  • Table 1: Global Market Value (USD Million) Forecast by Region, 2020-2035
  • Table 2: Global Market Volume (Units) Forecast by Region, 2020-2035
  • Table 3: Global Market Value (USD Million) Forecast by Sealing Process, 2020-2035
  • Table 4: Global Market Volume (Units) Forecast by Sealing Process, 2020-2035
  • Table 5: Global Market Value (USD Million) Forecast by Technology Type, 2020-2035
  • Table 6: Global Market Volume (Units) Forecast by Technology Type, 2020-2035
  • Table 7: Global Market Value (USD Million) Forecast by Application, 2020-2035
  • Table 8: Global Market Volume (Units) Forecast by Application, 2020-2035
  • Table 9: Global Market Value (USD Million) Forecast by Material Type, 2020-2035
  • Table 10: Global Market Volume (Units) Forecast by Material Type, 2020-2035
  • Table 11: North America Market Value (USD Million) Forecast by Country, 2020-2035
  • Table 12: North America Market Volume (Units) Forecast by Country, 2020-2035
  • Table 13: North America Market Value (USD Million) Forecast by Sealing Process, 2020-2035
  • Table 14: North America Market Volume (Units) Forecast by Sealing Process, 2020-2035
  • Table 15: North America Market Value (USD Million) Forecast by Technology Type, 2020-2035
  • Table 16: North America Market Volume (Units) Forecast by Technology Type, 2020-2035
  • Table 17: North America Market Value (USD Million) Forecast by Application, 2020-2035
  • Table 18: North America Market Volume (Units) Forecast by Application, 2020-2035
  • Table 19: North America Market Value (USD Million) Forecast by Material Type, 2020-2035
  • Table 20: North America Market Volume (Units) Forecast by Material Type, 2020-2035
  • Table 21: Latin America Market Value (USD Million) Forecast by Country, 2020-2035
  • Table 22: Latin America Market Volume (Units) Forecast by Country, 2020-2035
  • Table 23: Latin America Market Value (USD Million) Forecast by Sealing Process, 2020-2035
  • Table 24: Latin America Market Volume (Units) Forecast by Sealing Process, 2020-2035
  • Table 25: Latin America Market Value (USD Million) Forecast by Technology Type, 2020-2035
  • Table 26: Latin America Market Volume (Units) Forecast by Technology Type, 2020-2035
  • Table 27: Latin America Market Value (USD Million) Forecast by Application, 2020-2035
  • Table 28: Latin America Market Volume (Units) Forecast by Application, 2020-2035
  • Table 29: Latin America Market Value (USD Million) Forecast by Material Type, 2020-2035
  • Table 30: Latin America Market Volume (Units) Forecast by Material Type, 2020-2035
  • Table 31: Europe Market Value (USD Million) Forecast by Country, 2020-2035
  • Table 32: Europe Market Volume (Units) Forecast by Country, 2020-2035
  • Table 33: Europe Market Value (USD Million) Forecast by Sealing Process, 2020-2035
  • Table 34: Europe Market Volume (Units) Forecast by Sealing Process, 2020-2035
  • Table 35: Europe Market Value (USD Million) Forecast by Technology Type, 2020-2035
  • Table 36: Europe Market Volume (Units) Forecast by Technology Type, 2020-2035
  • Table 37: Europe Market Value (USD Million) Forecast by Application, 2020-2035
  • Table 38: Europe Market Volume (Units) Forecast by Application, 2020-2035
  • Table 39: Europe Market Value (USD Million) Forecast by Material Type, 2020-2035
  • Table 40: Europe Market Volume (Units) Forecast by Material Type, 2020-2035
  • Table 41: East Asia Market Value (USD Million) Forecast by Country, 2020-2035
  • Table 42: East Asia Market Volume (Units) Forecast by Country, 2020-2035
  • Table 43: East Asia Market Value (USD Million) Forecast by Sealing Process, 2020-2035
  • Table 44: East Asia Market Volume (Units) Forecast by Sealing Process, 2020-2035
  • Table 45: East Asia Market Value (USD Million) Forecast by Technology Type, 2020-2035
  • Table 46: East Asia Market Volume (Units) Forecast by Technology Type, 2020-2035
  • Table 47: East Asia Market Value (USD Million) Forecast by Application, 2020-2035
  • Table 48: East Asia Market Volume (Units) Forecast by Application, 2020-2035
  • Table 49: East Asia Market Value (USD Million) Forecast by Material Type, 2020-2035
  • Table 50: East Asia Market Volume (Units) Forecast by Material Type, 2020-2035
  • Table 51: South Asia Market Value (USD Million) Forecast by Country, 2020-2035
  • Table 52: South Asia Market Volume (Units) Forecast by Country, 2020-2035
  • Table 53: South Asia Market Value (USD Million) Forecast by Sealing Process, 2020-2035
  • Table 54: South Asia Market Volume (Units) Forecast by Sealing Process, 2020-2035
  • Table 55: South Asia Market Value (USD Million) Forecast by Technology Type, 2020-2035
  • Table 56: South Asia Market Volume (Units) Forecast by Technology Type, 2020-2035
  • Table 57: South Asia Market Value (USD Million) Forecast by Application, 2020-2035
  • Table 58: South Asia Market Volume (Units) Forecast by Application, 2020-2035
  • Table 59: South Asia Market Value (USD Million) Forecast by Material Type, 2020-2035
  • Table 60: South Asia Market Volume (Units) Forecast by Material Type, 2020-2035
  • Table 61: Oceania Market Value (USD Million) Forecast by Country, 2020-2035
  • Table 62: Oceania Market Volume (Units) Forecast by Country, 2020-2035
  • Table 63: Oceania Market Value (USD Million) Forecast by Sealing Process, 2020-2035
  • Table 64: Oceania Market Volume (Units) Forecast by Sealing Process, 2020-2035
  • Table 65: Oceania Market Value (USD Million) Forecast by Technology Type, 2020-2035
  • Table 66: Oceania Market Volume (Units) Forecast by Technology Type, 2020-2035
  • Table 67: Oceania Market Value (USD Million) Forecast by Application, 2020-2035
  • Table 68: Oceania Market Volume (Units) Forecast by Application, 2020-2035
  • Table 69: Oceania Market Value (USD Million) Forecast by Material Type, 2020-2035
  • Table 70: Oceania Market Volume (Units) Forecast by Material Type, 2020-2035
  • Table 71: MEA Market Value (USD Million) Forecast by Country, 2020-2035
  • Table 72: MEA Market Volume (Units) Forecast by Country, 2020-2035
  • Table 73: MEA Market Value (USD Million) Forecast by Sealing Process, 2020-2035
  • Table 74: MEA Market Volume (Units) Forecast by Sealing Process, 2020-2035
  • Table 75: MEA Market Value (USD Million) Forecast by Technology Type, 2020-2035
  • Table 76: MEA Market Volume (Units) Forecast by Technology Type, 2020-2035
  • Table 77: MEA Market Value (USD Million) Forecast by Application, 2020-2035
  • Table 78: MEA Market Volume (Units) Forecast by Application, 2020-2035
  • Table 79: MEA Market Value (USD Million) Forecast by Material Type, 2020-2035
  • Table 80: MEA Market Volume (Units) Forecast by Material Type, 2020-2035

List of Figures

  • Figure 1: Global Market Volume (Units) Forecast 2020-2035
  • Figure 2: Global Market Pricing Analysis
  • Figure 3: Global Market Value (USD Million) Forecast 2020-2035
  • Figure 4: Global Market Value Share and BPS Analysis by Sealing Process, 2025 and 2035
  • Figure 5: Global Market Y-o-Y Growth Comparison by Sealing Process, 2025-2035
  • Figure 6: Global Market Attractiveness Analysis by Sealing Process
  • Figure 7: Global Market Value Share and BPS Analysis by Technology Type, 2025 and 2035
  • Figure 8: Global Market Y-o-Y Growth Comparison by Technology Type, 2025-2035
  • Figure 9: Global Market Attractiveness Analysis by Technology Type
  • Figure 10: Global Market Value Share and BPS Analysis by Application, 2025 and 2035
  • Figure 11: Global Market Y-o-Y Growth Comparison by Application, 2025-2035
  • Figure 12: Global Market Attractiveness Analysis by Application
  • Figure 13: Global Market Value Share and BPS Analysis by Material Type, 2025 and 2035
  • Figure 14: Global Market Y-o-Y Growth Comparison by Material Type, 2025-2035
  • Figure 15: Global Market Attractiveness Analysis by Material Type
  • Figure 16: Global Market Value (USD Million) Share and BPS Analysis by Region, 2025 and 2035
  • Figure 17: Global Market Y-o-Y Growth Comparison by Region, 2025-2035
  • Figure 18: Global Market Attractiveness Analysis by Region
  • Figure 19: North America Market Incremental $ Opportunity, 2025-2035
  • Figure 20: Latin America Market Incremental $ Opportunity, 2025-2035
  • Figure 21: Europe Market Incremental $ Opportunity, 2025-2035
  • Figure 22: East Asia Market Incremental $ Opportunity, 2025-2035
  • Figure 23: South Asia Market Incremental $ Opportunity, 2025-2035
  • Figure 24: Oceania Market Incremental $ Opportunity, 2025-2035
  • Figure 25: MEA Market Incremental $ Opportunity, 2025-2035
  • Figure 26: North America Market Value Share and BPS Analysis by Country, 2025 and 2035
  • Figure 27: North America Market Value Share and BPS Analysis by Sealing Process, 2025 and 2035
  • Figure 28: North America Market Y-o-Y Growth Comparison by Sealing Process, 2025-2035
  • Figure 29: North America Market Attractiveness Analysis by Sealing Process
  • Figure 30: North America Market Value Share and BPS Analysis by Technology Type, 2025 and 2035
  • Figure 31: North America Market Y-o-Y Growth Comparison by Technology Type, 2025-2035
  • Figure 32: North America Market Attractiveness Analysis by Technology Type
  • Figure 33: North America Market Value Share and BPS Analysis by Application, 2025 and 2035
  • Figure 34: North America Market Y-o-Y Growth Comparison by Application, 2025-2035
  • Figure 35: North America Market Attractiveness Analysis by Application
  • Figure 36: North America Market Value Share and BPS Analysis by Material Type, 2025 and 2035
  • Figure 37: North America Market Y-o-Y Growth Comparison by Material Type, 2025-2035
  • Figure 38: North America Market Attractiveness Analysis by Material Type
  • Figure 39: Latin America Market Value Share and BPS Analysis by Country, 2025 and 2035
  • Figure 40: Latin America Market Value Share and BPS Analysis by Sealing Process, 2025 and 2035
  • Figure 41: Latin America Market Y-o-Y Growth Comparison by Sealing Process, 2025-2035
  • Figure 42: Latin America Market Attractiveness Analysis by Sealing Process
  • Figure 43: Latin America Market Value Share and BPS Analysis by Technology Type, 2025 and 2035
  • Figure 44: Latin America Market Y-o-Y Growth Comparison by Technology Type, 2025-2035
  • Figure 45: Latin America Market Attractiveness Analysis by Technology Type
  • Figure 46: Latin America Market Value Share and BPS Analysis by Application, 2025 and 2035
  • Figure 47: Latin America Market Y-o-Y Growth Comparison by Application, 2025-2035
  • Figure 48: Latin America Market Attractiveness Analysis by Application
  • Figure 49: Latin America Market Value Share and BPS Analysis by Material Type, 2025 and 2035
  • Figure 50: Latin America Market Y-o-Y Growth Comparison by Material Type, 2025-2035
  • Figure 51: Latin America Market Attractiveness Analysis by Material Type
  • Figure 52: Europe Market Value Share and BPS Analysis by Country, 2025 and 2035
  • Figure 53: Europe Market Value Share and BPS Analysis by Sealing Process, 2025 and 2035
  • Figure 54: Europe Market Y-o-Y Growth Comparison by Sealing Process, 2025-2035
  • Figure 55: Europe Market Attractiveness Analysis by Sealing Process
  • Figure 56: Europe Market Value Share and BPS Analysis by Technology Type, 2025 and 2035
  • Figure 57: Europe Market Y-o-Y Growth Comparison by Technology Type, 2025-2035
  • Figure 58: Europe Market Attractiveness Analysis by Technology Type
  • Figure 59: Europe Market Value Share and BPS Analysis by Application, 2025 and 2035
  • Figure 60: Europe Market Y-o-Y Growth Comparison by Application, 2025-2035
  • Figure 61: Europe Market Attractiveness Analysis by Application
  • Figure 62: Europe Market Value Share and BPS Analysis by Material Type, 2025 and 2035
  • Figure 63: Europe Market Y-o-Y Growth Comparison by Material Type, 2025-2035
  • Figure 64: Europe Market Attractiveness Analysis by Material Type
  • Figure 65: East Asia Market Value Share and BPS Analysis by Country, 2025 and 2035
  • Figure 66: East Asia Market Value Share and BPS Analysis by Sealing Process, 2025 and 2035
  • Figure 67: East Asia Market Y-o-Y Growth Comparison by Sealing Process, 2025-2035
  • Figure 68: East Asia Market Attractiveness Analysis by Sealing Process
  • Figure 69: East Asia Market Value Share and BPS Analysis by Technology Type, 2025 and 2035
  • Figure 70: East Asia Market Y-o-Y Growth Comparison by Technology Type, 2025-2035
  • Figure 71: East Asia Market Attractiveness Analysis by Technology Type
  • Figure 72: East Asia Market Value Share and BPS Analysis by Application, 2025 and 2035
  • Figure 73: East Asia Market Y-o-Y Growth Comparison by Application, 2025-2035
  • Figure 74: East Asia Market Attractiveness Analysis by Application
  • Figure 75: East Asia Market Value Share and BPS Analysis by Material Type, 2025 and 2035
  • Figure 76: East Asia Market Y-o-Y Growth Comparison by Material Type, 2025-2035
  • Figure 77: East Asia Market Attractiveness Analysis by Material Type
  • Figure 78: South Asia Market Value Share and BPS Analysis by Country, 2025 and 2035
  • Figure 79: South Asia Market Value Share and BPS Analysis by Sealing Process, 2025 and 2035
  • Figure 80: South Asia Market Y-o-Y Growth Comparison by Sealing Process, 2025-2035
  • Figure 81: South Asia Market Attractiveness Analysis by Sealing Process
  • Figure 82: South Asia Market Value Share and BPS Analysis by Technology Type, 2025 and 2035
  • Figure 83: South Asia Market Y-o-Y Growth Comparison by Technology Type, 2025-2035
  • Figure 84: South Asia Market Attractiveness Analysis by Technology Type
  • Figure 85: South Asia Market Value Share and BPS Analysis by Application, 2025 and 2035
  • Figure 86: South Asia Market Y-o-Y Growth Comparison by Application, 2025-2035
  • Figure 87: South Asia Market Attractiveness Analysis by Application
  • Figure 88: South Asia Market Value Share and BPS Analysis by Material Type, 2025 and 2035
  • Figure 89: South Asia Market Y-o-Y Growth Comparison by Material Type, 2025-2035
  • Figure 90: South Asia Market Attractiveness Analysis by Material Type
  • Figure 91: Oceania Market Value Share and BPS Analysis by Country, 2025 and 2035
  • Figure 92: Oceania Market Value Share and BPS Analysis by Sealing Process, 2025 and 2035
  • Figure 93: Oceania Market Y-o-Y Growth Comparison by Sealing Process, 2025-2035
  • Figure 94: Oceania Market Attractiveness Analysis by Sealing Process
  • Figure 95: Oceania Market Value Share and BPS Analysis by Technology Type, 2025 and 2035
  • Figure 96: Oceania Market Y-o-Y Growth Comparison by Technology Type, 2025-2035
  • Figure 97: Oceania Market Attractiveness Analysis by Technology Type
  • Figure 98: Oceania Market Value Share and BPS Analysis by Application, 2025 and 2035
  • Figure 99: Oceania Market Y-o-Y Growth Comparison by Application, 2025-2035
  • Figure 100: Oceania Market Attractiveness Analysis by Application
  • Figure 101: Oceania Market Value Share and BPS Analysis by Material Type, 2025 and 2035
  • Figure 102: Oceania Market Y-o-Y Growth Comparison by Material Type, 2025-2035
  • Figure 103: Oceania Market Attractiveness Analysis by Material Type
  • Figure 104: MEA Market Value Share and BPS Analysis by Country, 2025 and 2035
  • Figure 105: MEA Market Value Share and BPS Analysis by Sealing Process, 2025 and 2035
  • Figure 106: MEA Market Y-o-Y Growth Comparison by Sealing Process, 2025-2035
  • Figure 107: MEA Market Attractiveness Analysis by Sealing Process
  • Figure 108: MEA Market Value Share and BPS Analysis by Technology Type, 2025 and 2035
  • Figure 109: MEA Market Y-o-Y Growth Comparison by Technology Type, 2025-2035
  • Figure 110: MEA Market Attractiveness Analysis by Technology Type
  • Figure 111: MEA Market Value Share and BPS Analysis by Application, 2025 and 2035
  • Figure 112: MEA Market Y-o-Y Growth Comparison by Application, 2025-2035
  • Figure 113: MEA Market Attractiveness Analysis by Application
  • Figure 114: MEA Market Value Share and BPS Analysis by Material Type, 2025 and 2035
  • Figure 115: MEA Market Y-o-Y Growth Comparison by Material Type, 2025-2035
  • Figure 116: MEA Market Attractiveness Analysis by Material Type
  • Figure 117: Global Market - Tier Structure Analysis
  • Figure 118: Global Market - Company Share Analysis

Frequently Asked Questions

What was the overall size of the stainless steel water bottles market in 2025?

The overall market size for the stainless steel water bottles market was USD 1.5 billion in 2025.

How big is the stainless steel water bottles market expected to be in 2035?

The stainless steel water bottles market is expected to reach USD 2.6 billion in 2035.

What will drive the demand for the stainless steel water bottles market during the forecast period?

Growing consumer awareness of sustainability, increasing concerns about plastic pollution, rising preference for durable and reusable hydration solutions, and advancements in insulated bottle technology will drive market growth.

List the top 5 countries contributing to the stainless steel water bottles market.

The USA, China, Germany, India, and the UK are key contributors.

Which segment in distribution channel is expected to lead in the stainless steel water bottles market?

The online retail segment is expected to lead due to the increasing penetration of e-commerce, wide product variety, and convenience of doorstep delivery.

Explore Similar Insights

Future Market Insights

Stainless Steel Water Bottles Market