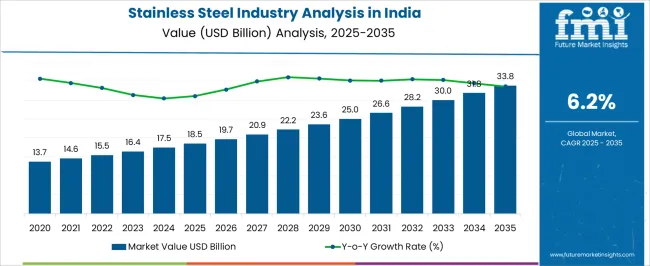
The Stainless Steel Industry Analysis in India is estimated to be valued at USD 18.5 billion in 2025 and is projected to reach USD 33.8 billion by 2035, registering a compound annual growth rate (CAGR) of 6.2% over the forecast period.
The stainless steel industry in India is experiencing robust growth, driven by rising domestic demand from infrastructure, automotive, construction, and industrial sectors. Increasing investments in manufacturing, urbanization, and large-scale infrastructure projects are boosting consumption of high-performance steel products. Technological advancements in steelmaking, including enhanced alloy compositions, recycling techniques, and energy-efficient production methods, are improving product quality and operational efficiency.
The growing emphasis on sustainability and compliance with environmental regulations is further encouraging the adoption of high-grade stainless steel products. Flat products, long products, and specialty grades are being increasingly used in applications requiring corrosion resistance, strength, and durability.
Additionally, rising exports to global markets and strategic government initiatives supporting the Make in India program are enhancing production capacities and competitiveness As industries prioritize quality, reliability, and cost-effective materials for long-term applications, the Indian stainless steel sector is positioned for sustained growth, with innovation, domestic consumption, and strategic investments creating opportunities for market expansion in the coming decade.
| Metric | Value |
|---|---|
| Stainless Steel Industry Analysis in India Estimated Value in (2025 E) | USD 18.5 billion |
| Stainless Steel Industry Analysis in India Forecast Value in (2035 F) | USD 33.8 billion |
| Forecast CAGR (2025 to 2035) | 6.2% |
The market is segmented by Type, Form, Grade, and End-Use and region. By Type, the market is divided into Austenitic Stainless Steel, Ferritic Stainless Steel, Duplex Stainless Steel, Martensitic Stainless Steel, and Precipitation Hardening Stainless Steel. In terms of Form, the market is classified into Flat Products and Long Products. Based on Grade, the market is segmented into 300 Series, 200 Series, 400 Series, and Other Grades. By End-Use, the market is divided into Building & Construction, Industrial Machinery & Components, Automotive & Transportation, Consumer Goods, Medical & Surgical Tools, Aerospace & Defense, Marine, Oil & Gas, and Other End-Uses. Regionally, the market is classified into North America, Latin America, Western Europe, Eastern Europe, Balkan & Baltic Countries, Russia & Belarus, Central Asia, East Asia, South Asia & Pacific, and the Middle East & Africa.
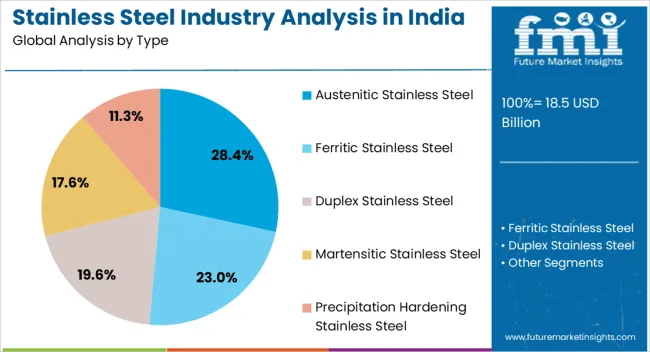
The austenitic stainless steel segment is projected to hold 28.4% of the Indian market revenue in 2025, positioning it as the leading type. Its growth is being driven by superior corrosion resistance, formability, and mechanical strength, which make it suitable for diverse applications across industrial, construction, and automotive sectors. Austenitic stainless steel offers excellent performance in high-temperature and corrosive environments, supporting usage in chemical plants, food processing, and kitchenware manufacturing.
Continuous innovations in alloy compositions have improved durability and reduced maintenance requirements, enhancing long-term operational efficiency. The ability to integrate this type into advanced manufacturing processes, including precision fabrication and welding, has further reinforced its adoption.
Rising awareness among end users regarding lifecycle costs and material reliability has strengthened market preference With increasing demand for high-performance steel in both domestic and export markets, the austenitic segment is expected to retain its leadership position, driven by quality, adaptability, and technological advancement in steel production.
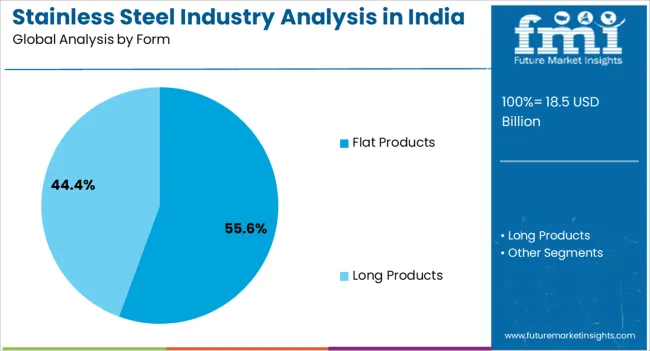
The flat products form segment is anticipated to account for 55.6% of the Indian stainless steel market revenue in 2025, making it the leading form category. Growth is being driven by its extensive application in construction, automotive panels, kitchen appliances, and industrial equipment, where flat sheets and plates provide structural stability and design flexibility. The segment benefits from high-volume production capabilities and ease of processing into finished products through cutting, bending, and forming operations.
Flat products allow manufacturers to optimize performance parameters, including strength, thickness, and surface finish, enhancing applicability across diverse sectors. Technological advancements in rolling, surface treatment, and coating processes have improved quality, durability, and corrosion resistance, supporting wider adoption.
Increasing infrastructure development, urbanization, and industrialization in India are driving demand for flat products as the preferred form of stainless steel As domestic consumption grows and manufacturing capabilities expand, the flat products segment is expected to maintain its dominant market position, reinforced by operational efficiency and versatile application potential.
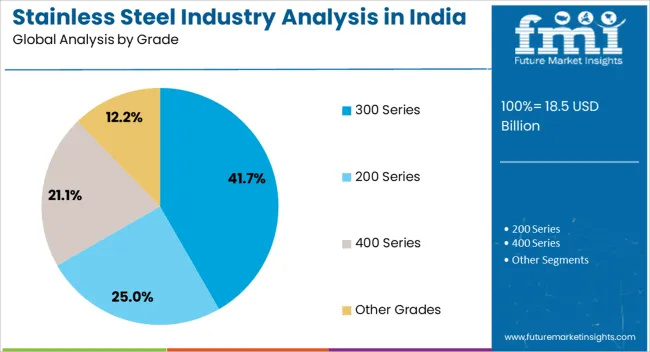
The 300 series grade segment is projected to hold 41.7% of the market revenue in 2025, establishing it as the leading grade in India. Its growth is being driven by superior corrosion resistance, high strength, and excellent thermal stability, making it suitable for applications in construction, automotive, kitchenware, and chemical processing industries. This grade is preferred for environments requiring high durability and long-term reliability under varied operational conditions.
Continuous advancements in alloying techniques and stainless steel processing have enhanced the quality, consistency, and surface finish of the 300 series, reinforcing its adoption. Increasing awareness among end users about product lifecycle benefits, maintenance efficiency, and safety standards has strengthened market preference.
The 300 series grade also supports fabrication into diverse forms, including sheets, plates, and coils, facilitating wide applicability across multiple sectors As demand for high-performance and reliable stainless steel continues to rise in India, the 300 series grade is expected to retain its leading position, driven by operational efficiency, adaptability, and technological enhancements in production processes.
Revenue to Grow Over 1.8X through 2035
As per the latest analysis, stainless steel revenue in India is forecast to grow by 1.8X through 2035, amid a 1.8% surge in predicted CAGR compared to the historical one. This is attributable to rising stainless steel usage across diverse industries, including automotive and construction.
Stainless steel consumption in India will also rise because of robust industrialization, growing authorities’ expenditure for infrastructure improvement, and developing city populace. By 2035, the total revenue in India is set to reach USD 31,905.2 million.
West India to Remain the Hotbed for Stainless Steel Manufacturers
As per the latest analysis, West India remains the prominent consumer of stainless steel. It is set to hold around 43.0% of the India stainless steel industry share in 2035. This is attributed to the following factors:
Proximity to Raw Materials: States like Gujarat and Maharashtra in West India are strategically located near major ports and have access to abundant resources like iron ore and nickel, essential for stainless steel production. This proximity minimizes transportation costs and ensures a steady supply chain, providing a competitive advantage to manufacturers in the region.
Growing Industrial Infrastructure: West India boasts robust industrial infrastructure, including Special Economic Zones (SEZs), industrial parks, and manufacturing clusters. Cities like Ahmedabad, Surat, and Mumbai are home to numerous stainless steel plants benefiting from skilled labor, supportive government policies, and investment-friendly environments, fueling growth and innovation in the sector.
Presence of Diverse End-user Industries: The region hosts a diverse range of end-user industries, including automotive, petrochemicals, construction, and pharmaceuticals, all of which require stainless steel for various applications. This diverse industrial base creates a sustained demand for stainless steel products, driving continuous growth and investment in manufacturing facilities in West India.
Export Opportunities: West India's proximity to major ports like Mundra, Nhava Sheva, and Kandla facilitates export opportunities, enabling stainless steel manufacturers to access international markets efficiently. This strategic advantage, coupled with the region's well-developed transportation infrastructure, positions West India as a key player in the global stainless steel trade.
Austenitic Stainless Steel Remains Top-selling Type in India
Austenitic stainless steel has become widely used in India, holding a volume share of about 72.7% in 2025. This can be attributed to its versatility, flexibility, cost-effectiveness, and other advantages.
Austenitic stainless steel can be easily formed into sheets, increasing its application spectrum. Its welding ability also helps in diversifying its application portfolios, from any shape and design without sacrificing structural integrity. This makes it suitable for various manufacturing processes such as forging, machining, and fabrication.
Austenitic stainless steel shows good strength and toughness even at high temperatures. This is making it an ideal choice for heat-sensitive uses, such as air filters in industries, industrial furnaces, and aerospace spare parts. Similarly, the high corrosion-resistant properties of this stainless steel type enhance its popularity.
India’s growing manufacturing and infrastructure sectors are key factors boosting growth of the stainless steel industry. Stainless steel is commonly used in the manufacture of building materials, roofing, textiles, and furniture because of its durability, corrosion resistance, and aesthetic properties.
Stainless steel also finds application in the chemical, oil, gas, food processing and pharmaceutical industries due to its thermal and corrosion resistance. Thus, rapid industrial growth across India will continue to propel demand for stainless steel products.
Indian government has launched initiatives like 'Make in India' as well as infrastructure projects, including the Smart Cities Mission. These initiatives and projects are set to positively influence stainless steel manufacturing in India.
India is also developing as a primary player in stainless-steel exports due to its low manufacturing and lower costs. On the other hand, fluctuation in raw material prices could restrain India's stainless steel industry growth.
Sales of stainless steel in India increased at a CAGR of 4.4% between 2020 and 2025. Total revenue reached about USD 16,486.7 million in 2025. From 2025 to 2035, India’s stainless steel demand is set to grow at a CAGR of 6.2%.
| Historical CAGR (2020 to 2025) | 4.4% |
|---|---|
| Forecast CAGR (2025 to 2035) | 6.2% |
High penetration of industrialization is acting as a catalyst triggering growth of India stainless steel industry. This is because stainless steel is widely used in the industrial sector for making different parts, components, and equipment.
Robust expansion of automotive industry is set to create lucrative growth opportunities for stainless steel manufacturers in India. Subsequently, growing popularity of stainless steel kitchenware due to its hygiene, aesthetic appeal, and durability will boost stainless steel fabrication industry in India.
Growing Demand from Automotive and Transportation Sector
The automotive and transportation industry is witnessing high adoption of stainless steel due to its exceptional properties. Stainless steel’s corrosion resistance, tensile strength, durability and aesthetics are encouraging in motors’ parts and structural components.
Stainless steel is widely used for exhaust systems, catalytic converters, gas tanks, brake strains, chassis or frames and body panels within the vehicle industry. They are very precious in exhaust structures as they operate at high temperatures and come into contact with corroding gasses.
The high electricity-to-weight ratio of stainless steel allows lighter vehicles to be designed without sacrificing protection or performance. Similarly, stainless steel is selected for luxurious car decorative trims, including grilles and indoor accents, because of its esthetic enchantment and long-lasting look.
Stainless steel is also used in rail tracks, bridges, and rolling inventory in the transportation domain. This is due to its corrosion resistance and structural stability. Thus, rising stainless steel applications in the automotive and transportation sectors will fuel sales growth.
Booming Building & Construction Sector
A significant demand for stainless steel arises from the constructing and construction industry. Its resistance to corrosion, sturdiness, aesthetics, and eco-friendliness have made it a famous choice of architects and engineers for various construction tasks.
Stainless steel is used in beams, columns, and reinforcing bars in the construction industry. The fact that stainless steel has an excessive electricity-to-weight ratio and does not rust makes it a very good material for making the structural components of both residential houses and commercial buildings.
Stainless steel is also commonly used in architectural applications like façades, cladding, and roofing. Its aesthetic appeal, versatility, and capacity to resist harsh climatic situations make it suitable for architectural designs.
Rising Demand from Industrial Machinery and Components
Another key factor fueling stainless steel demand is its rising usage in industrial machinery and components. Because of its strength, resistance to corrosion, thermal balance, and adaptability, stainless steel is becoming ideal for manufacturing industrial equipment and components.
Many commercial equipment and tooling components, such as cutting gear, dies, molds, and punches, are crafted from stainless steel. Because of its hardness, toughness, and resistance to wear, stainless steel is a superb material for machining, stamping, and forming operations.
Supply Disruptions and Massive Fluctuation in Steel Prices
The disruption in supply channels and significant price fluctuations are the major constraints faced by the stainless steel industry. Differences in demand dynamics, excess inventory caused by broadened production, and greater economic uncertainty are often the causes of these fluctuations.
The table below highlights key states’ stainless steel industry revenues. Maharashtra, Tamil Nadu, and Uttar Pradesh are set to remain the top three consumers of stainless steel, with valuations of USD 33.8 million, USD 1399.3 million, and USD 1241.3 million, respectively, in 2035.
| States | Stainless Steel Industry Revenue (2035) |
|---|---|
| Maharashtra | USD 33.8 million |
| Tamil Nadu | USD 1399.3 million |
| Uttar Pradesh | USD 1241.3 million |
| Karnataka | USD 1209.8 million |
| Haryana | USD 991.7 million |
| Gujrat | USD 842.3 million |
The table below shows the estimated growth rates of the top five countries. Goa, Punjab, and Rajasthan are set to record high CAGRs of 7.7%, 7.4%, and 7.4%, respectively, through 2035.
| States | Stainless Steel Industry CAGR (2025 to 2035) |
|---|---|
| Goa | 7.7% |
| Punjab | 7.4% |
| Rajasthan | 7.4% |
| Karnataka | 7.2% |
| Telangana | 6.9% |
| Haryana | 6.8% |
FMI’s new report estimates the Maharashtra stainless steel industry size to reach USD 33.8 million by 2035. Demand for stainless steel in Maharashtra is set to rise at 6.1% CAGR between 2025 and 2035.
Maharashtra is the industrial hub of India with production industries such as aerospace, engineering, and automotive witnessing strong growth. This, in turn, is uplifting stainless steel demand in the state as these industries often use stainless steel for different purposes.
With its massive coastline, Maharashtra is home to vital ports, including Ratnagiri Port, Jawaharlal Nehru Port (Nhava Sheva), and Mumbai Port. Due to this key location, the state can import raw materials, and export completed stainless-steel merchandise greater profitably, thereby assisting the expansion of the stainless-steel sector.
Many well-known manufacturers of stainless steel, like Mukand Limited and Jindal Stainless, are based totally in Maharashtra. Through innovation, product diversification, and industry penetration, these companies help Maharashtra hold its dominance in India.
Favorable government support is also playing a key role in enhancing the stainless steel industry share of Maharashtra. The state government is launching various initiatives, such as 'Make in Maharashtra', prompting stainless steel manufacturers to establish their business in the state.
Sales of stainless steel in Tamil Nadu are forecast to soar at a CAGR of around 5.5%, resulting in a valuation of USD 1399.3 million by 2035. This can be attributed to expansion of industries like automotive and construction in the states.
Leading automakers like Hyundai, Ford, and Renault-Nissan are primarily based in Tamil Nadu, a huge hub for automotive production in India. This expansion of auto sector is positively impacting sales of stainless steel as it is widely used for making body panels, gasoline tanks, and exhaust structures.
Infrastructure in Tamil Nadu is growing quickly, creating demand for various stainless steel-based products. Because stainless steel is robust, shiny, and corrosion-resistant, it is often utilized in infrastructure projects, including strength plant life, bridges, and railroad stations.
The section below shows the austenitic stainless steel segment dominating the stainless steel sector in India. It is forecast to record a CAGR of 6.1% between 2025 and 2035, prompting stainless steel manufacturers to invest in this product type to succeed.
| Top Segment (Type) | Austenitic Stainless Steel |
|---|---|
| CAGR (2025 to 2035) | 6.1% |
Despite availability of different stainless steel types, end users mostly prefer austenitic stainless steel, with its usage set to increase at 6.1% CAGR. This can be attributed to its versatility, high corrosion resistance, and other properties. It will generate revenue of about USD 8,589 million by 2035.
Austenitic stainless steel is more immune to corrosion than other types. This makes it ideal to be used in harsh conditions like the ones found within the metal processing, chemical, and maritime sectors.
Austenitic stainless steel is effortlessly fabricated right into different shapes and designs due to its terrific formability, weldability, and ductility. Because of its adaptability, it can be utilized in a number of sectors, including automobile and domestic home equipment.
Austenitic chrome steel is appropriate for applications requiring thermal stability, including warmness exchangers, cryogenic tanks, and excessive-temperature equipment. This is because it keeps its mechanical features at low and high temperatures.
The smooth surface finish of austenitic stainless steel makes it easy to clean and maintain, meeting stringent hygiene requirements in industries like pharmaceuticals, healthcare, and food processing. Hence, it is forecast to hold a significant volume share of 72.9% in 2025.
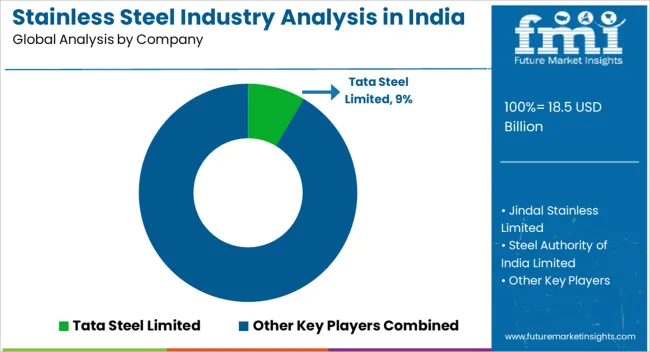
The Indian stainless steel industry displays a noticeable dualistic pattern, as major players secure a substantial share, estimated at around 55% to 53%. Key industry frontrunners such as Arcelor Mittal, Jindal Stainless Limited, and Nippon Steel Corporation significantly influence the industry dynamics.
A considerable share ranging from 40% to 45% is distributed among other participants. This underscores a diverse terrain characterized by emerging contenders and specialized niche players.
Key manufacturers of stainless steel in India are investing in research and development for product innovation and development in the technology. They are concentrating on producing high-grade stainless steel with extra corrosion resistance and other enhanced features.
Well-structured and efficient supply chain networks, acquisitions, partnerships, and collaborations with other companies are other growth strategies employed by players. They are also making long-term agreements with the distributors and traders to maintain and increase revenue.
Recent Developments in India's Stainless Steel Industry
| Attribute | Details |
|---|---|
| Industry Value in 2025 | USD 18.5 billion |
| Industry Size in 2035 | USD 33.8 billion |
| Growth Rate (2025 to 2035) | 6.2% CAGR |
| Historical Data | 2020 to 2025 |
| Forecast Period | 2025 to 2035 |
| Quantitative Units | Value (USD million) and Volume (million tons) |
| Report Coverage | Revenue Forecast, Volume Forecast, Company Ranking, Competitive Landscape, Growth Factors, Trends, and Pricing Analysis |
| Key Segments Covered | Type, Form, Grade, End-use |
| Key Countries Covered | India |
| Key Companies Profiled | Arcelor Mittal; Nippon Steel Corporation; Baosteel Group Corporation.; Baowu Steel Group Corporation Limited; JFE Steel Corporation; Jindal Stainless Limited; Tata Steel Limited; Posco International; Steel Authority of India Limited; JSW Steel Limited; Mangalam Worldwide Limited; Mishra Dhatu Nigam Limited; Mittal Corp Limited; Mukand Limited; Outokumpu India Pvt Ltd; Panchmahal Steel Ltd; Shah Alloys Ltd; Shyam Sel & Power Limited; Star Wire (India) Limited; Sunflag Iron & Steel Co Ltd; Synergy Steels Limited; Vikas Hitech Castings; Welspun Specialty Solutions Ltd; DeTech Pumps Works; Ambica Steels Limited; Viraj Profiles Limited; Hisar Metal Industries Limited; BRG Group; Ratnamani Metals & Tubes Ltd.; Rimjhim Stainless Ltd.; Adhunik Metalliks; Panchmahal Steels, Ltd.; Avtar Steel Ltd.; Laxcon Steels Limited |
The global stainless steel industry analysis in india is estimated to be valued at USD 18.5 billion in 2025.
The market size for the stainless steel industry analysis in india is projected to reach USD 33.8 billion by 2035.
The stainless steel industry analysis in india is expected to grow at a 6.2% CAGR between 2025 and 2035.
The key product types in stainless steel industry analysis in india are austenitic stainless steel, ferritic stainless steel, duplex stainless steel, martensitic stainless steel and precipitation hardening stainless steel.
In terms of form, flat products segment to command 55.6% share in the stainless steel industry analysis in india in 2025.


Full Research Suite comprises of:
Market outlook & trends analysis
Interviews & case studies
Strategic recommendations
Vendor profiles & capabilities analysis
5-year forecasts
8 regions and 60+ country-level data splits
Market segment data splits
12 months of continuous data updates
DELIVERED AS:
PDF EXCEL ONLINE
Stainless Steel Miniature Screw Market Size and Share Forecast Outlook 2025 to 2035
Stainless Steel Welded Pipe Market Size and Share Forecast Outlook 2025 to 2035
Stainless Steel Market Size and Share Forecast Outlook 2025 to 2035
Stainless Steel Turning Inserts Market Size and Share Forecast Outlook 2025 to 2035
Stainless Steel Electrical Cabinet Market Size and Share Forecast Outlook 2025 to 2035
Stainless Steel Bars and Bar Size Shapes Market Size and Share Forecast Outlook 2025 to 2035
Stainless Steel Casks Market Size and Share Forecast Outlook 2025 to 2035
Stainless Steel Valve Tag Market Size and Share Forecast Outlook 2025 to 2035
Stainless Steel Foil Market Analysis - Size and Share Forecast Outlook 2025 to 2035
Stainless Steel Water Bottles Market Size, Share & Forecast 2025 to 2035
Stainless Steel Control Valve Market Size, Share, and Forecast 2025 to 2035
Key Companies & Market Share in the Stainless Steel Welded Pipe Sector
Stainless Steel IBC Industry Analysis in United States Insights - Trends & Forecast 2025 to 2035
Precision Stainless Steel Market Size and Share Forecast Outlook 2025 to 2035
Automotive Stainless Steel Market Size and Share Forecast Outlook 2025 to 2035
Steel Drum Market Size and Share Forecast Outlook 2025 to 2035
Steel Drums & IBCs Market Size and Share Forecast Outlook 2025 to 2035
Steel Roll-on Tube Market Size and Share Forecast Outlook 2025 to 2035
Steel Salvage Drums Market Size and Share Forecast Outlook 2025 to 2035
Steel Wire Market Size and Share Forecast Outlook 2025 to 2035

Thank you!
You will receive an email from our Business Development Manager. Please be sure to check your SPAM/JUNK folder too.
Chat With
MaRIA