Reports

- Global Locations -

Headquarters

Future Market Insights, Inc.

Christiana Corporate, 200
Continental Drive, Suite 401,
Newark, Delaware - 19713,
United States

T: +1-845-579-5705

Americas

Future Market Insights, Inc.

616 Corporate Way, Suite 2-9018,
Valley Cottage, NY 10989, United States

T: +1-347-918-3531

MEA

Future Market Insights

1602-6 Jumeirah Bay X2 Tower, Plot No: JLT-PH2-X2A,
Jumeirah Lakes Towers, Dubai,
United Arab Emirates

Europe

Future Market Insights

3rd Floor, 207 Regent Street,
W1B 3HH London
United Kingdom

T: + 44 (0) 20 8123 9659
D: +44 (0) 20 3287 4268

Asia Pacific

Future Market Insights

IndiaLand Global Tech Park, Unit UG-1, Behind Grand HighStreet, Phase 1, Hinjawadi, MH, Pune – 411057, India

Steel Drums & IBCs Market

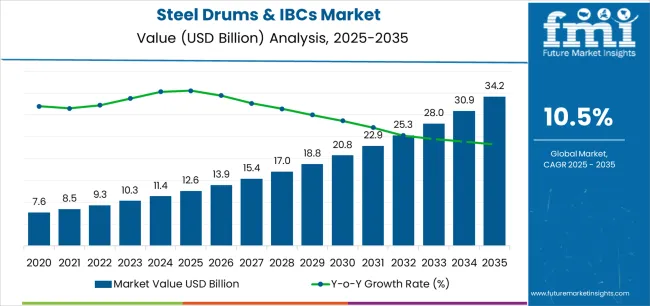
The global steel drums & IBCs market is estimated to hit a market value of US$ 13,995.9 million in 2023. The market is expected to reach US$ 21,735.2 million expanding at a CAGR of 4.5% from 2023 to 2033.

Emerging Trends in Steel Drum and IBC Manufacturing

The steel drum and IBC manufacturers are facing a rapidly changing market as the demand for IBC/drums continues to grow. One of the emerging trends is the focus on sustainability and eco-friendliness. Manufacturers are investing in new technologies and processes that reduce waste and minimize their carbon footprint.

The demand for customized solutions is also increasing, as clients seek containers that meet their specific needs. Companies in the steel drum and IBC industry are responding to these trends by developing innovative solutions that meet the changing needs of their clients.

Opportunities in Steel Drums End Usage

Steel drums are used in a variety of industries, from chemicals and pharmaceuticals to food and beverage. This creates new opportunities for the steel drum industry as companies in these sectors seek high-quality, reliable containers for their products. As a result, steel drum manufacturers are investing in new technologies and processes that allow them to produce containers that meet the specific needs of their clients. The trend towards customized solutions is expected to drive growth in the steel drum industry as companies seek to differentiate themselves in a competitive market.

Growth Drivers for IBC Demand in the Steel Drums Industry

The IBC market is experiencing strong demand as companies seek more efficient and cost-effective solutions for the transportation and storage of liquids and other materials. The steel drums industry is capitalizing on this trend by developing innovative IBC solutions that meet the changing needs of their clients.

Another growth driver is the increasing demand for sustainable and eco-friendly solutions, as companies seek to reduce their carbon footprint and minimize waste. Furthermore, the trend toward automation is upsurging the market, as companies seek more efficient ways to transport and store their products.

Sales Drivers for Steel Drums and IBC Manufacturers

The steel drum and IBC manufacturers are facing increasing competition as new players enter the market. To remain competitive, companies are focusing on sales and marketing strategies that differentiate them from their competitors. One sales driver is the trend toward digitalization, as companies invest in e-commerce, social media, and search engine optimization to reach a wider audience.

Among emerging trends, customers' inclination toward customization has also increased, as companies seek to provide containers that meet the specific needs of their clients. These sales and marketing strategies are expected to be key drivers of growth in the steel drum and IBC industry as companies seek to expand their customer base and increase their sales revenue.

Attribute Details
Steel Drums & IBCs Market Size (2023E) US$ 13,995.9.3 million
Projected Steel Drums & IBCs Market Size (2033F) US$ 21,735.2 million
Value CAGR (2023 to 2033) 4.5%
Top 5 Companies' Market Share 37%

Don't pay for what you don't need

Customize your report by selecting specific countries or regions and save 30%!

Historical (2017 to 2022) and Forecast (2023 to 2033) Market Outlook for Steel Drums & IBCs Market

Future Market Insights predict a comparison and review analysis for the dynamics of the steel drums & IBCs industry, which is principally subjected to an array of industry factors along with a few definite influences regarding the availability of alternatives such as fiber drums as well as the Flexi tanks is further expected to hamper the market growth.

Some new advances that have taken place in the market include the usage of drums which are more reliable and reusable. In June 2022, SCHÜTZ Container Systems expanded its production capacity in North America for the collection and eco-friendly reconditioning of packaging.

The market for the steel drums & IBCs is expected to surge by 50 basis share points (BPS) in H1-2022 (O) against comparison with H1-2021, according to an FMI analysis. However, when comparing the H1-2022 projected and H1-2022 outlook period, a rise in BPS change by 30 BPS has been noticed.

Steel drums & IBCs are expected to hold around 23% of the overall industrial packaging market of US$ 70 billion in 2023.

H1 2021 4.5%
H1 2022 Projected 4.7%
H1 2022 Expected 5.0%
BPS Change - H1, 2022 (O) - H1, 2022 (P) (+) 30 ↑
BPS Change - H1, 2022 (O) - H1, 2021 (+) 50 ↑

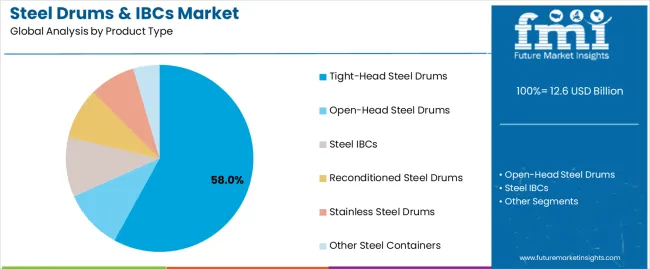
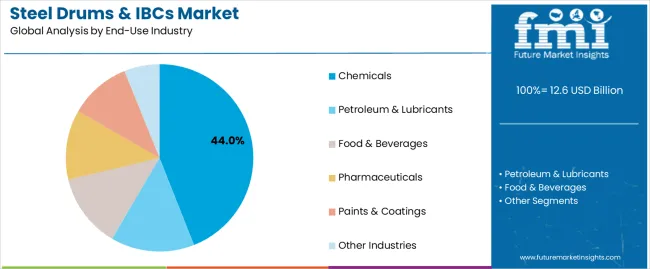
Steel drums & IBCs have been traditionally consumed for storage and transportation of chemicals, petroleum and lubricants, and food and beverage. 200 Litres steel drums, which is the most extensively availed capacity of steel drums are expected to attain a CAGR of 4.7% during the forecast period 2023 to 2033.

Steel drums and immediate bulk containers (IBCs) are standard shipping containers used to transport industrial and non-industrial produce. They are also built safely to ship hazardous chemicals, metals, and liquids based on requirements. Immediate bulk containers (IBCs) could be molded from plastic, metal, and alloys. The steel drums & IBCs market is expected to flourish in the market due to factors like re-usability, versatility, and safeguarding against environmental hazards.

The key reason for this change in growth rate is due to IBCs and steel drums are considered one of the safest forms of packaging for hazardous goods such as chemicals. Despite these prospects, steel drums and IBC are estimated to have accelerated growth due to their environmentally friendly properties.

Comparative View of the Steel Drums & IBCs Market

Steel Drums & IBCs Market:

Attributes Steel Drums & IBCs Market
CAGR (2023 to 2033) 4.5%
Market Value (2033) US$ 21,735.2 million
Opportunity Increasing demand for eco-friendly and customized solutions
Key Trends Adoption of automation and new technologies for efficient transportation and storage

Intermediate Bulk Container Market:

Attributes Intermediate Bulk Container Market
CAGR (2023 to 2033) 5.1%
Market Value (2033) US$ 24,340 million
Opportunity Growing demand for cost-effective and efficient storage solutions
Key Trends Increasing focus on sustainability and eco-friendliness

Steel Drum Market:

Attributes Steel Drum Market
CAGR (2023 to 2033) 5.6%
Market Value (2033) US$ 20,800 million
Opportunity Diverse end-use applications across various industries
Key Trends Focus on customization and innovative solutions to meet specific client needs.
Ismail Sutaria
Ismail Sutaria

Principal Consultant

Talk to Analyst

Find your sweet spots for generating winning opportunities in this market.

How Shift in Material is Responsible for Growth in Demand of IBCs?

The global market for rigid bulk packaging is increasingly witnessing the trend of using composite IBCs. Composite IBCs are intermediate bulk containers (IBCs) made of rigid plastic materials and equipped with outer casings made of metals such as steel or iron. The global packaging market is characterized by continuous product development specifically aimed at enhancing effectiveness derived from material capabilities. Manufacturers are implementing material changes that result in cost and functional improvements.

The global market for rigid bulk packaging is increasingly shifting towards the use of plastics to produce and supply bulk packaging solutions. Like metal IBCs, composite IBCs are reusable upon reconditioning, and hence, are increasingly being preferred by end consumers. Growing preference among end consumers for lightweight solutions is resulting in composite IBCs gaining a higher market share in the global market for rigid bulk packaging.

Which Technological Advancement is Shaping the future of the Steel Drums & IBCs Market?

RFID technology has not only benefited manufacturers and suppliers but has also proved to be an effective cost-saving tool for consumers. End consumers are increasingly using steel drums & IBCs to ship products to save costs by eliminating physical counting of inventory by implementing RFID tags to manage and control overall inventory. Effective functionality has encouraged numerous IBC manufacturers to invest in RFID technology to enhance customer service and save overall operational costs.

Get the data you need at a Fraction of the cost

Personalize your report by choosing insights you need
and save 40%!

Country-wise Insights

Countries Expected Market Value (US million) in 2023
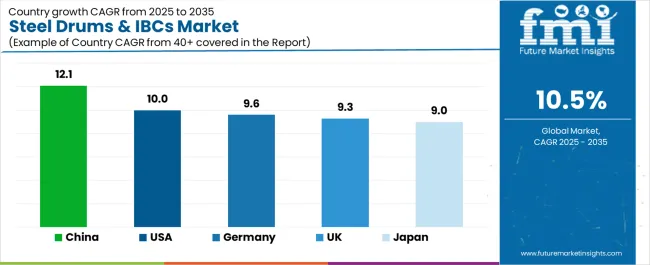
United States US$ 1,314.9 million
China US$ 5,721.4 million
Japan US$ 637.8 million
South Korea US$ 458.5 million
Germany US$ 668.6 million

Rising Demand for Customized and Eco-Friendly Steel Drums & IBCs in the United States

The steel drums & IBCs market in the United States is expected to reach a value of US$ 1,314.9 million in 2023. Increasing demand for eco-friendly and sustainable solutions is one of the emerging trends in this region. The market is also seeing an increase in demand for customized solutions that cater to specific industries, such as food and beverage and pharmaceuticals. In addition, the adoption of automation and new technologies for efficient transportation and storage is also contributing to the growth of the market.

China to Witness Growing Focus on Sustainability and High Demand for IBCs/Drums

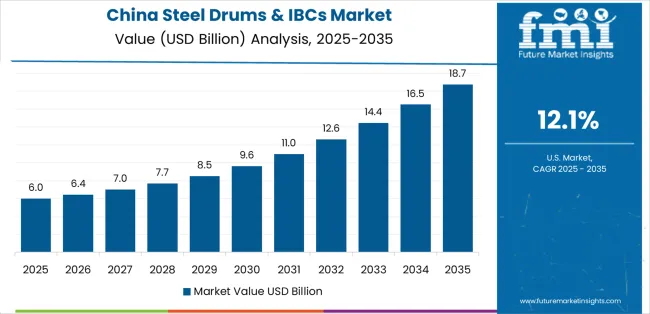
The steel drums & IBCs market in China is anticipated to reach a value of US$ 5,721.4 million in 2023. One of the key trends in this region is the increasing focus on sustainability and eco-friendliness, with companies investing in new technologies and processes to reduce waste and minimize their carbon footprint. Another trend is the growing demand for customized solutions that cater to specific industries, such as chemicals and lubricants. The market is also seeing an increase in demand for intermediate bulk containers (IBC), as companies seek more efficient and cost-effective solutions for the transportation and storage of liquids and other materials.

Increasing Demand for Reliable and Customized Steel Drums in Japan

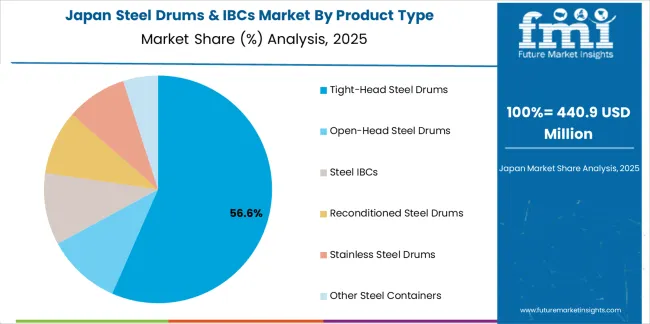
The steel drums & IBCs market in Japan is projected to reach a value of US$ 637.8 million in 2023. One of the key trends in this region is the increasing demand for high-quality and reliable containers, especially in the chemical and pharmaceutical industries. The market is also seeing an increase in demand for customized solutions that cater to specific industries, such as cosmetics and food and beverage. In addition, the adoption of automation and new technologies for efficient transportation and storage is also contributing to the growth of the market.

Manufacturers in South Korea to Witness Rising Demand for Eco-Friendly Steel Drums & IBCs in 2023

The steel drums & IBCs market in South Korea is likely to reach a value of US$ 458.5 million in 2023. Increasing demand for eco-friendly and sustainable solutions, with companies investing in new technologies and processes to reduce waste and minimize their carbon footprint, is driving the market. Another trend is the growing demand for intermediate bulk containers (IBC), as companies seek more efficient and cost-effective solutions for the transportation and storage of liquids and other materials. The market is also seeing an increase in demand for customized solutions that cater to specific industries, such as electronics and automotive.

Increasing Demand for IBCs and New Technologies in Steel Drum & IBCs Market in 2023

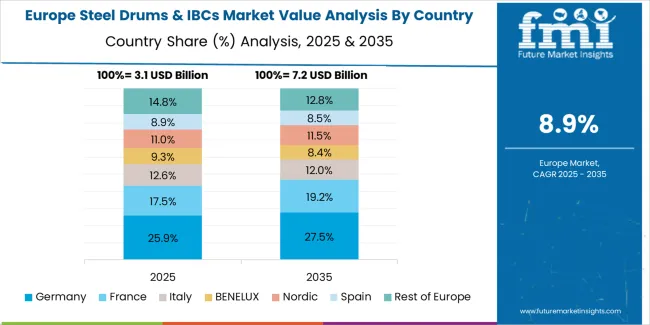
The steel drums & IBCs market in Germany is expected to reach a value of US$ 668.6 million in 2023. One of the prime trends in this region is the increasing demand for intermediate bulk containers (IBC), as companies seek more efficient and cost-effective solutions for the transportation and storage of liquids and other materials. The market is also seeing an increase in demand for customized solutions that cater to specific industries, such as chemicals and pharmaceuticals. In addition, the adoption of automation and new technologies for efficient transportation and storage is also contributing to the growth of the market.

How Indian Steel Industry Picking up Pace to compete with the World?

According to the Ministry of Steel, India is the second-largest producer of crude steel in the world in 2019. The country produced almost 111.2 million Tonnes (MT) of steel, marking a year-on-year growth of 1.8% from 2018. The steel industry in the industry is facing cut-throat competition as many North American and European end industries have shifted their businesses from China to India during 2020.

Under the union budget of 2021 to 22, the government of India has allocated an amount of US$ 5.4 million to the ministry of steel. Increasing demand for crude steel is expected to shape the demand for steel drums in the country. Moreover, emerging countries in the Asia Pacific are expected to address the demand for steel drums by surplus production in 2021-2022.

Why Food Industry in France is a Chief Driver of IBCs in Europe?

European Flexible Intermediate Bulk Container Association (EFIBCA) represents a consolidation of more than 50 IBC manufacturers in Europe. The organization also declared IBCs as a ‘priority product’ in 2020 to fight the effects of the COVID-19 virus to be used as a mode of transport to move essential healthcare and food items between borders.

Safe food supplies, protective equipment, and other vital supplies were a part of the products transported in IBCs during the pandemic. Agricultural produce is also widely transported in European nations via the means of IBCs. France is a leading food producer in Europe and thus makes use of IBCs the most to transport its products. The growing demand for food and healthcare products in Europe is expected to fuel the demand for IBCs in the region.

Category-wise Insights

Category By Capacity Type
Leading Segment Name 200 L
Expected Value in US$ million (2023) 13,297.2
Category By End Use
Leading Segment Name Chemicals
Expected Value in US$ million (2023) 5,675.7

Increasing Demand for 200 L Steel Drums & IBCs in the Chemical Industry Expected to Drive Growth in 2023

The 200 L steel drum segment is expected to dominate the steel drums & IBCs market, with an expected value of US$ 13,297.2 million in 2023. This segment is preferred for its high capacity, durability, and cost-effectiveness. The 200 L steel drums & IBCs are widely used in the storage and transportation of various liquids and solids, including chemicals, food and beverage, and pharmaceuticals. The increasing demand for customized solutions and eco-friendly materials is expected to drive the growth of the 200 L steel drums segment in 2023.

Growing Demand for Steel Drums & IBCs in the Chemical Industry to Propel Market Growth in 2023

The chemicals segment is expected to be the leading end-use segment in the steel drums & IBCs market, with an expected value of US$ 5,675.7 million in 2023. Steel drums & IBCs are the preferred choice for the storage and transportation of chemicals due to their durability, resistance to corrosion, and cost-effectiveness. With the increasing demand for chemicals across industries such as agriculture, pharmaceuticals, and manufacturing, the demand for steel drums & IBCs is also expected to grow in 2023. The trend towards eco-friendly and sustainable solutions is also expected to drive growth in this segment.

Competitive Landscape

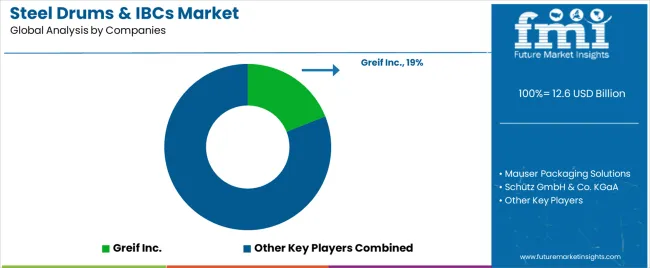
The steel drums & IBCs industry is highly fragmented, with several players operating in the market. Some key players in the market include Greif, Inc., Mauser Group, Schutz Container Systems, and Hoover Container Solutions. These companies dominate the market, with a significant presence in both domestic and international markets.

The industry is highly competitive, with companies competing based on product quality, price, and customer service. To stay ahead in the market, companies are increasingly focusing on product innovation and expanding their product portfolio to cater to a wider range of industries.

In recent years, there has been a trend toward consolidation in the industry, with leading players acquiring smaller companies to expand their product portfolios and increase their global reach. This consolidation has resulted in the formation of several large multinational companies, such as Greif, Inc. and Mauser Group.

Apart from mergers and acquisitions, companies are also focusing on strategic collaborations and partnerships to strengthen their market position.

  • In 2019, Schutz Container Systems announced a strategic partnership with Greif, Inc. to expand its product offerings and increase its global presence.
  • In Jan 2022, Greif Inc. had a joint venture with Gulf Refined Packaging (GRP) to diversify 50% of its shares. This is expected to help the company with debt repayment.
  • In November 2020, Hoover Ferguson Group opened up a new art-of-state facility for the chemical tank and tanker truck servicing.

Scope of the Report

Attribute Details
Forecast Period 2023 to 2033
Historical Data Available for 2017 to 2022
Market Analysis US$ million for Value
Key Regions Covered North America, Latin America, Europe, Asia Pacific, South Asia, East Asia, Oceania, and the Middle East & Africa
Key Countries Covered United States, Brazil, Mexico, Germany, United Kingdom, China, India, Japan, Australia, and GCC Countries
Key Segments Covered Capacity, End Use, and Region
Key Companies Profiled
  • Greif Inc.
  • Hoover Ferguson Group
  • Snyder Industries, Inc.
  • SCHÜTZ GmbH & Co. KGaA
  • Mauser Packaging Solutions
  • Thielmann US LLC
  • Time Technoplast Ltd.
  • Custom Metalcraft, Inc.
  • Automationstechnik GmbH
  • Transtainer
  • Hawman Container Services
  • Schafer Werke Gmbh
  • Obal Centrum s.r.o.
  • Sicagen India Limited
  • Balmer Lawrie & Co. Limited
  • Industrial Container Services, Inc.
  • Myers Container, LLC.
  • Orlando Drum & Container Corporation
  • Great Western Containers Inc.
  • Meyer Steel Drum, Inc.
  • Peninsula Drums CC
Report Coverage Market Forecast, Company Share Analysis, Competition Intelligence, DROT Analysis, Market Dynamics and Challenges, and Strategic Growth Initiatives
Customization & Pricing Available upon Request

Steel Drums & IBCs Market by Category

By Capacity Type:

  • Steel Drums
    • 200 Litre
    • More than 200 Litre
  • IBCs
    • Up to 500 Litre
    • 501-1,000 Litre
    • 1,001-1,500 Litre
    • Above 1,500 Litre

By End Use:

  • Chemicals
  • Petroleum & Lubricants
  • Paints, Inks, & Dyes
  • Food & Beverage
  • Building & Construction
  • Healthcare & Pharmaceuticals
  • Others (Agriculture, etc.)

By Region:

  • North America
  • Latin America
  • Europe
  • South Asia
  • East Asia
  • Oceania
  • The Middle East and Africa (MEA)

Frequently Asked Questions

What is the Present Market Value of Steel Drums & IBCs Available around the World?

The global steel drums & IBCs market might create a value up to US$ 13,995.9 million in 2023.

What will be the Growth Rate for the Sales of Steel Drums & IBCs in the Coming Days?

The global adoption of steel drums & IBCs is forecasted to surge at 4.5% CAGR through 2033.

What is the Key Trend Driving the Demand for Steel Drums & IBCs in Recent Years?

Use of RFID technology has boosted the demand for steel drums & IBCs in recent years.

What is the Performance of the Steel Drums & IBCs Market in the United Sates?

The United States is expected to retain its dominance with US$ 1,314.9 million revenue in 2023.

Which is the Leading Segment in the Market, Based on Capacity?

The 200 L steel drum segment leads with an expected more than 90% global market share.

Table of Content

1. Executive Summary | Steel Drums & IBCs Market

    1.1. Global Market Outlook

    1.2. Demand-side Trends

    1.3. Supply-side Trends

    1.4. Technology Roadmap Analysis

    1.5. Analysis and Recommendations

2. Market Overview

    2.1. Market Coverage / Taxonomy

    2.2. Market Definition / Scope / Limitations

3. Market Background

    3.1. Market Dynamics

        3.1.1. Drivers

        3.1.2. Restraints

        3.1.3. Opportunity

        3.1.4. Trends

    3.2. Scenario Forecast

        3.2.1. Demand in Optimistic Scenario

        3.2.2. Demand in Likely Scenario

        3.2.3. Demand in Conservative Scenario

    3.3. Opportunity Map Analysis

    3.4. Product Life Cycle Analysis

    3.5. Supply Chain Analysis

        3.5.1. Supply Side Participants and their Roles

            3.5.1.1. Producers

            3.5.1.2. Mid-Level Participants (Traders/ Agents/ Brokers)

            3.5.1.3. Wholesalers and Distributors

        3.5.2. Value Added and Value Created at Node in the Supply Chain

        3.5.3. List of Raw Material Suppliers

        3.5.4. List of Existing and Potential Buyer’s

    3.6. Investment Feasibility Matrix

    3.7. Value Chain Analysis

        3.7.1. Profit Margin Analysis

        3.7.2. Wholesalers and Distributors

        3.7.3. Retailers

    3.8. PESTLE and Porter’s Analysis

    3.9. Regulatory Landscape

        3.9.1. By Key Regions

        3.9.2. By Key Countries

    3.10. Regional Parent Market Outlook

    3.11. Production and Consumption Statistics

    3.12. Import and Export Statistics

4. Global Market Analysis 2018 to 2022 and Forecast, 2023 to 2033

    4.1. Historical Market Size Value (US$ Million) & Volume (Units) Analysis, 2018 to 2022

    4.2. Current and Future Market Size Value (US$ Million) & Volume (Units) Projections, 2023 to 2033

        4.2.1. Y-o-Y Growth Trend Analysis

        4.2.2. Absolute $ Opportunity Analysis

5. Global Market Analysis 2018 to 2022 and Forecast 2023 to 2033, By Capacity Type

    5.1. Introduction / Key Findings

    5.2. Historical Market Size Value (US$ Million) & Volume (Units) Analysis By Capacity Type, 2018 to 2022

    5.3. Current and Future Market Size Value (US$ Million) & Volume (Units) Analysis and Forecast By Capacity Type, 2023 to 2033

        5.3.1. Steel Drums

            5.3.1.1. 200 Litre

            5.3.1.2. More than 200 Litre

        5.3.2. IBCs

            5.3.2.1. Up to 500 Litre

            5.3.2.2. 501-1,000 Litre

            5.3.2.3. 1,001-1,500 Litre

            5.3.2.4. Above 1,500 Litre

    5.4. Y-o-Y Growth Trend Analysis By Capacity Type, 2018 to 2022

    5.5. Absolute $ Opportunity Analysis By Capacity Type, 2023 to 2033

6. Global Market Analysis 2018 to 2022 and Forecast 2023 to 2033, By End Use

    6.1. Introduction / Key Findings

    6.2. Historical Market Size Value (US$ Million) & Volume (Units) Analysis By End Use, 2018 to 2022

    6.3. Current and Future Market Size Value (US$ Million) & Volume (Units) Analysis and Forecast By End Use, 2023 to 2033

        6.3.1. Chemicals

        6.3.2. Petroleum & Lubricants

        6.3.3. Paints, Inks & Dyes

        6.3.4. Food & Beverage

        6.3.5. Building & Construction

        6.3.6. Other End Uses

    6.4. Y-o-Y Growth Trend Analysis By End Use, 2018 to 2022

    6.5. Absolute $ Opportunity Analysis By End Use, 2023 to 2033

7. Global Market Analysis 2018 to 2022 and Forecast 2023 to 2033, By Region

    7.1. Introduction

    7.2. Historical Market Size Value (US$ Million) & Volume (Units) Analysis By Region, 2018 to 2022

    7.3. Current Market Size Value (US$ Million) & Volume (Units) Analysis and Forecast By Region, 2023 to 2033

        7.3.1. North America

        7.3.2. Latin America

        7.3.3. Europe

        7.3.4. Asia Pacific

        7.3.5. MEA

    7.4. Market Attractiveness Analysis By Region

8. North America Market Analysis 2018 to 2022 and Forecast 2023 to 2033, By Country

    8.1. Historical Market Size Value (US$ Million) & Volume (Units) Trend Analysis By Market Taxonomy, 2018 to 2022

    8.2. Market Size Value (US$ Million) & Volume (Units) Forecast By Market Taxonomy, 2023 to 2033

        8.2.1. By Country

            8.2.1.1. U.S.

            8.2.1.2. Canada

        8.2.2. By Capacity Type

        8.2.3. By End Use

    8.3. Market Attractiveness Analysis

        8.3.1. By Country

        8.3.2. By Capacity Type

        8.3.3. By End Use

    8.4. Key Takeaways

9. Latin America Market Analysis 2018 to 2022 and Forecast 2023 to 2033, By Country

    9.1. Historical Market Size Value (US$ Million) & Volume (Units) Trend Analysis By Market Taxonomy, 2018 to 2022

    9.2. Market Size Value (US$ Million) & Volume (Units) Forecast By Market Taxonomy, 2023 to 2033

        9.2.1. By Country

            9.2.1.1. Brazil

            9.2.1.2. Mexico

            9.2.1.3. Rest of Latin America

        9.2.2. By Capacity Type

        9.2.3. By End Use

    9.3. Market Attractiveness Analysis

        9.3.1. By Country

        9.3.2. By Capacity Type

        9.3.3. By End Use

    9.4. Key Takeaways

10. Europe Market Analysis 2018 to 2022 and Forecast 2023 to 2033, By Country

    10.1. Historical Market Size Value (US$ Million) & Volume (Units) Trend Analysis By Market Taxonomy, 2018 to 2022

    10.2. Market Size Value (US$ Million) & Volume (Units) Forecast By Market Taxonomy, 2023 to 2033

        10.2.1. By Country

            10.2.1.1. Germany

            10.2.1.2. United kingdom

            10.2.1.3. France

            10.2.1.4. Spain

            10.2.1.5. Italy

            10.2.1.6. Rest of Europe

        10.2.2. By Capacity Type

        10.2.3. By End Use

    10.3. Market Attractiveness Analysis

        10.3.1. By Country

        10.3.2. By Capacity Type

        10.3.3. By End Use

    10.4. Key Takeaways

11. Asia Pacific Market Analysis 2018 to 2022 and Forecast 2023 to 2033, By Country

    11.1. Historical Market Size Value (US$ Million) & Volume (Units) Trend Analysis By Market Taxonomy, 2018 to 2022

    11.2. Market Size Value (US$ Million) & Volume (Units) Forecast By Market Taxonomy, 2023 to 2033

        11.2.1. By Country

            11.2.1.1. China

            11.2.1.2. Japan

            11.2.1.3. South Korea

            11.2.1.4. Singapore

            11.2.1.5. Thailand

            11.2.1.6. Indonesia

            11.2.1.7. Australia

            11.2.1.8. New Zealand

            11.2.1.9. Rest of Asia Pacific

        11.2.2. By Capacity Type

        11.2.3. By End Use

    11.3. Market Attractiveness Analysis

        11.3.1. By Country

        11.3.2. By Capacity Type

        11.3.3. By End Use

    11.4. Key Takeaways

12. MEA Market Analysis 2018 to 2022 and Forecast 2023 to 2033, By Country

    12.1. Historical Market Size Value (US$ Million) & Volume (Units) Trend Analysis By Market Taxonomy, 2018 to 2022

    12.2. Market Size Value (US$ Million) & Volume (Units) Forecast By Market Taxonomy, 2023 to 2033

        12.2.1. By Country

            12.2.1.1. GCC Countries

            12.2.1.2. South Africa

            12.2.1.3. Israel

            12.2.1.4. Rest of MEA

        12.2.2. By Capacity Type

        12.2.3. By End Use

    12.3. Market Attractiveness Analysis

        12.3.1. By Country

        12.3.2. By Capacity Type

        12.3.3. By End Use

    12.4. Key Takeaways

13. Key Countries Market Analysis

    13.1. USA

        13.1.1. Pricing Analysis

        13.1.2. Market Share Analysis, 2022

            13.1.2.1. By Capacity Type

            13.1.2.2. By End Use

    13.2. Canada

        13.2.1. Pricing Analysis

        13.2.2. Market Share Analysis, 2022

            13.2.2.1. By Capacity Type

            13.2.2.2. By End Use

    13.3. Brazil

        13.3.1. Pricing Analysis

        13.3.2. Market Share Analysis, 2022

            13.3.2.1. By Capacity Type

            13.3.2.2. By End Use

    13.4. Mexico

        13.4.1. Pricing Analysis

        13.4.2. Market Share Analysis, 2022

            13.4.2.1. By Capacity Type

            13.4.2.2. By End Use

    13.5. Germany

        13.5.1. Pricing Analysis

        13.5.2. Market Share Analysis, 2022

            13.5.2.1. By Capacity Type

            13.5.2.2. By End Use

    13.6. United kingdom

        13.6.1. Pricing Analysis

        13.6.2. Market Share Analysis, 2022

            13.6.2.1. By Capacity Type

            13.6.2.2. By End Use

    13.7. France

        13.7.1. Pricing Analysis

        13.7.2. Market Share Analysis, 2022

            13.7.2.1. By Capacity Type

            13.7.2.2. By End Use

    13.8. Spain

        13.8.1. Pricing Analysis

        13.8.2. Market Share Analysis, 2022

            13.8.2.1. By Capacity Type

            13.8.2.2. By End Use

    13.9. Italy

        13.9.1. Pricing Analysis

        13.9.2. Market Share Analysis, 2022

            13.9.2.1. By Capacity Type

            13.9.2.2. By End Use

    13.10. China

        13.10.1. Pricing Analysis

        13.10.2. Market Share Analysis, 2022

            13.10.2.1. By Capacity Type

            13.10.2.2. By End Use

    13.11. Japan

        13.11.1. Pricing Analysis

        13.11.2. Market Share Analysis, 2022

            13.11.2.1. By Capacity Type

            13.11.2.2. By End Use

    13.12. South Korea

        13.12.1. Pricing Analysis

        13.12.2. Market Share Analysis, 2022

            13.12.2.1. By Capacity Type

            13.12.2.2. By End Use

    13.13. Singapore

        13.13.1. Pricing Analysis

        13.13.2. Market Share Analysis, 2022

            13.13.2.1. By Capacity Type

            13.13.2.2. By End Use

    13.14. Thailand

        13.14.1. Pricing Analysis

        13.14.2. Market Share Analysis, 2022

            13.14.2.1. By Capacity Type

            13.14.2.2. By End Use

    13.15. Indonesia

        13.15.1. Pricing Analysis

        13.15.2. Market Share Analysis, 2022

            13.15.2.1. By Capacity Type

            13.15.2.2. By End Use

    13.16. Australia

        13.16.1. Pricing Analysis

        13.16.2. Market Share Analysis, 2022

            13.16.2.1. By Capacity Type

            13.16.2.2. By End Use

    13.17. New Zealand

        13.17.1. Pricing Analysis

        13.17.2. Market Share Analysis, 2022

            13.17.2.1. By Capacity Type

            13.17.2.2. By End Use

    13.18. GCC Countries

        13.18.1. Pricing Analysis

        13.18.2. Market Share Analysis, 2022

            13.18.2.1. By Capacity Type

            13.18.2.2. By End Use

    13.19. South Africa

        13.19.1. Pricing Analysis

        13.19.2. Market Share Analysis, 2022

            13.19.2.1. By Capacity Type

            13.19.2.2. By End Use

    13.20. Israel

        13.20.1. Pricing Analysis

        13.20.2. Market Share Analysis, 2022

            13.20.2.1. By Capacity Type

            13.20.2.2. By End Use

14. Market Structure Analysis

    14.1. Competition Dashboard

    14.2. Competition Benchmarking

    14.3. Market Share Analysis of Top Players

        14.3.1. By Regional

        14.3.2. By Capacity Type

        14.3.3. By End Use

15. Competition Analysis

    15.1. Competition Deep Dive

        15.1.1. Greif Inc.

            15.1.1.1. Overview

            15.1.1.2. Product Portfolio

            15.1.1.3. Profitability by Market Segments

            15.1.1.4. Sales Footprint

            15.1.1.5. Strategy Overview

                15.1.1.5.1. Marketing Strategy

                15.1.1.5.2. Product Strategy

                15.1.1.5.3. Channel Strategy

        15.1.2. Hoover Ferguson Group

            15.1.2.1. Overview

            15.1.2.2. Product Portfolio

            15.1.2.3. Profitability by Market Segments

            15.1.2.4. Sales Footprint

            15.1.2.5. Strategy Overview

                15.1.2.5.1. Marketing Strategy

                15.1.2.5.2. Product Strategy

                15.1.2.5.3. Channel Strategy

        15.1.3. Snyder Industries, Inc.

            15.1.3.1. Overview

            15.1.3.2. Product Portfolio

            15.1.3.3. Profitability by Market Segments

            15.1.3.4. Sales Footprint

            15.1.3.5. Strategy Overview

                15.1.3.5.1. Marketing Strategy

                15.1.3.5.2. Product Strategy

                15.1.3.5.3. Channel Strategy

        15.1.4. SCHÜTZ GmbH & Co. KGaA

            15.1.4.1. Overview

            15.1.4.2. Product Portfolio

            15.1.4.3. Profitability by Market Segments

            15.1.4.4. Sales Footprint

            15.1.4.5. Strategy Overview

                15.1.4.5.1. Marketing Strategy

                15.1.4.5.2. Product Strategy

                15.1.4.5.3. Channel Strategy

        15.1.5. Mauser Packaging Solutions

            15.1.5.1. Overview

            15.1.5.2. Product Portfolio

            15.1.5.3. Profitability by Market Segments

            15.1.5.4. Sales Footprint

            15.1.5.5. Strategy Overview

                15.1.5.5.1. Marketing Strategy

                15.1.5.5.2. Product Strategy

                15.1.5.5.3. Channel Strategy

        15.1.6. Thielmann US LLC

            15.1.6.1. Overview

            15.1.6.2. Product Portfolio

            15.1.6.3. Profitability by Market Segments

            15.1.6.4. Sales Footprint

            15.1.6.5. Strategy Overview

                15.1.6.5.1. Marketing Strategy

                15.1.6.5.2. Product Strategy

                15.1.6.5.3. Channel Strategy

        15.1.7. Time Technoplast Ltd.

            15.1.7.1. Overview

            15.1.7.2. Product Portfolio

            15.1.7.3. Profitability by Market Segments

            15.1.7.4. Sales Footprint

            15.1.7.5. Strategy Overview

                15.1.7.5.1. Marketing Strategy

                15.1.7.5.2. Product Strategy

                15.1.7.5.3. Channel Strategy

        15.1.8. Custom Metalcraft, Inc.

            15.1.8.1. Overview

            15.1.8.2. Product Portfolio

            15.1.8.3. Profitability by Market Segments

            15.1.8.4. Sales Footprint

            15.1.8.5. Strategy Overview

                15.1.8.5.1. Marketing Strategy

                15.1.8.5.2. Product Strategy

                15.1.8.5.3. Channel Strategy

        15.1.9. Automationstechnik GmbH

            15.1.9.1. Overview

            15.1.9.2. Product Portfolio

            15.1.9.3. Profitability by Market Segments

            15.1.9.4. Sales Footprint

            15.1.9.5. Strategy Overview

                15.1.9.5.1. Marketing Strategy

                15.1.9.5.2. Product Strategy

                15.1.9.5.3. Channel Strategy

        15.1.10. Transtainer

            15.1.10.1. Overview

            15.1.10.2. Product Portfolio

            15.1.10.3. Profitability by Market Segments

            15.1.10.4. Sales Footprint

            15.1.10.5. Strategy Overview

                15.1.10.5.1. Marketing Strategy

                15.1.10.5.2. Product Strategy

                15.1.10.5.3. Channel Strategy

        15.1.11. Hawman Container Services

            15.1.11.1. Overview

            15.1.11.2. Product Portfolio

            15.1.11.3. Profitability by Market Segments

            15.1.11.4. Sales Footprint

            15.1.11.5. Strategy Overview

                15.1.11.5.1. Marketing Strategy

                15.1.11.5.2. Product Strategy

                15.1.11.5.3. Channel Strategy

        15.1.12. Schafer Werke Gmbh

            15.1.12.1. Overview

            15.1.12.2. Product Portfolio

            15.1.12.3. Profitability by Market Segments

            15.1.12.4. Sales Footprint

            15.1.12.5. Strategy Overview

                15.1.12.5.1. Marketing Strategy

                15.1.12.5.2. Product Strategy

                15.1.12.5.3. Channel Strategy

        15.1.13. Obal Centrum s.r.o.

            15.1.13.1. Overview

            15.1.13.2. Product Portfolio

            15.1.13.3. Profitability by Market Segments

            15.1.13.4. Sales Footprint

            15.1.13.5. Strategy Overview

                15.1.13.5.1. Marketing Strategy

                15.1.13.5.2. Product Strategy

                15.1.13.5.3. Channel Strategy

        15.1.14. Sicagen India Limited

            15.1.14.1. Overview

            15.1.14.2. Product Portfolio

            15.1.14.3. Profitability by Market Segments

            15.1.14.4. Sales Footprint

            15.1.14.5. Strategy Overview

                15.1.14.5.1. Marketing Strategy

                15.1.14.5.2. Product Strategy

                15.1.14.5.3. Channel Strategy

        15.1.15. Balmer Lawrie & Co. Limited

            15.1.15.1. Overview

            15.1.15.2. Product Portfolio

            15.1.15.3. Profitability by Market Segments

            15.1.15.4. Sales Footprint

            15.1.15.5. Strategy Overview

                15.1.15.5.1. Marketing Strategy

                15.1.15.5.2. Product Strategy

                15.1.15.5.3. Channel Strategy

        15.1.16. Industrial Container Services, Inc.

            15.1.16.1. Overview

            15.1.16.2. Product Portfolio

            15.1.16.3. Profitability by Market Segments

            15.1.16.4. Sales Footprint

            15.1.16.5. Strategy Overview

                15.1.16.5.1. Marketing Strategy

                15.1.16.5.2. Product Strategy

                15.1.16.5.3. Channel Strategy

        15.1.17. Myers Container, LLC.

            15.1.17.1. Overview

            15.1.17.2. Product Portfolio

            15.1.17.3. Profitability by Market Segments

            15.1.17.4. Sales Footprint

            15.1.17.5. Strategy Overview

                15.1.17.5.1. Marketing Strategy

                15.1.17.5.2. Product Strategy

                15.1.17.5.3. Channel Strategy

        15.1.18. Orlando Drum & Container Corporation

            15.1.18.1. Overview

            15.1.18.2. Product Portfolio

            15.1.18.3. Profitability by Market Segments

            15.1.18.4. Sales Footprint

            15.1.18.5. Strategy Overview

                15.1.18.5.1. Marketing Strategy

                15.1.18.5.2. Product Strategy

                15.1.18.5.3. Channel Strategy

        15.1.19. Great Western Containers Inc.

            15.1.19.1. Overview

            15.1.19.2. Product Portfolio

            15.1.19.3. Profitability by Market Segments

            15.1.19.4. Sales Footprint

            15.1.19.5. Strategy Overview

                15.1.19.5.1. Marketing Strategy

                15.1.19.5.2. Product Strategy

                15.1.19.5.3. Channel Strategy

        15.1.20. Meyer Steel Drum, Inc.

            15.1.20.1. Overview

            15.1.20.2. Product Portfolio

            15.1.20.3. Profitability by Market Segments

            15.1.20.4. Sales Footprint

            15.1.20.5. Strategy Overview

                15.1.20.5.1. Marketing Strategy

                15.1.20.5.2. Product Strategy

                15.1.20.5.3. Channel Strategy

16. Assumptions & Acronyms Used

17. Research Methodology

Don't pay for what you don't need

Customize your report by selecting specific countries or regions and save 30%!

List of Tables

Table 1: Global Market Value (US$ Million) Forecast by Region, 2018 to 2033

Table 2: Global Market Volume (Units) Forecast by Region, 2018 to 2033

Table 3: Global Market Value (US$ Million) Forecast by Capacity Type, 2018 to 2033

Table 4: Global Market Volume (Units) Forecast by Capacity Type, 2018 to 2033

Table 5: Global Market Value (US$ Million) Forecast by End Use, 2018 to 2033

Table 6: Global Market Volume (Units) Forecast by End Use, 2018 to 2033

Table 7: North America Market Value (US$ Million) Forecast by Country, 2018 to 2033

Table 8: North America Market Volume (Units) Forecast by Country, 2018 to 2033

Table 9: North America Market Value (US$ Million) Forecast by Capacity Type, 2018 to 2033

Table 10: North America Market Volume (Units) Forecast by Capacity Type, 2018 to 2033

Table 11: North America Market Value (US$ Million) Forecast by End Use, 2018 to 2033

Table 12: North America Market Volume (Units) Forecast by End Use, 2018 to 2033

Table 13: Latin America Market Value (US$ Million) Forecast by Country, 2018 to 2033

Table 14: Latin America Market Volume (Units) Forecast by Country, 2018 to 2033

Table 15: Latin America Market Value (US$ Million) Forecast by Capacity Type, 2018 to 2033

Table 16: Latin America Market Volume (Units) Forecast by Capacity Type, 2018 to 2033

Table 17: Latin America Market Value (US$ Million) Forecast by End Use, 2018 to 2033

Table 18: Latin America Market Volume (Units) Forecast by End Use, 2018 to 2033

Table 19: Europe Market Value (US$ Million) Forecast by Country, 2018 to 2033

Table 20: Europe Market Volume (Units) Forecast by Country, 2018 to 2033

Table 21: Europe Market Value (US$ Million) Forecast by Capacity Type, 2018 to 2033

Table 22: Europe Market Volume (Units) Forecast by Capacity Type, 2018 to 2033

Table 23: Europe Market Value (US$ Million) Forecast by End Use, 2018 to 2033

Table 24: Europe Market Volume (Units) Forecast by End Use, 2018 to 2033

Table 25: Asia Pacific Market Value (US$ Million) Forecast by Country, 2018 to 2033

Table 26: Asia Pacific Market Volume (Units) Forecast by Country, 2018 to 2033

Table 27: Asia Pacific Market Value (US$ Million) Forecast by Capacity Type, 2018 to 2033

Table 28: Asia Pacific Market Volume (Units) Forecast by Capacity Type, 2018 to 2033

Table 29: Asia Pacific Market Value (US$ Million) Forecast by End Use, 2018 to 2033

Table 30: Asia Pacific Market Volume (Units) Forecast by End Use, 2018 to 2033

Table 31: MEA Market Value (US$ Million) Forecast by Country, 2018 to 2033

Table 32: MEA Market Volume (Units) Forecast by Country, 2018 to 2033

Table 33: MEA Market Value (US$ Million) Forecast by Capacity Type, 2018 to 2033

Table 34: MEA Market Volume (Units) Forecast by Capacity Type, 2018 to 2033

Table 35: MEA Market Value (US$ Million) Forecast by End Use, 2018 to 2033

Table 36: MEA Market Volume (Units) Forecast by End Use, 2018 to 2033
Ismail Sutaria
Ismail Sutaria

Principal Consultant

Talk to Analyst

Find your sweet spots for generating winning opportunities in this market.

List of Charts

Figure 1: Global Market Value (US$ Million) by Capacity Type, 2023 to 2033

Figure 2: Global Market Value (US$ Million) by End Use, 2023 to 2033

Figure 3: Global Market Value (US$ Million) by Region, 2023 to 2033

Figure 4: Global Market Value (US$ Million) Analysis by Region, 2018 to 2033

Figure 5: Global Market Volume (Units) Analysis by Region, 2018 to 2033

Figure 6: Global Market Value Share (%) and BPS Analysis by Region, 2023 to 2033

Figure 7: Global Market Y-o-Y Growth (%) Projections by Region, 2023 to 2033

Figure 8: Global Market Value (US$ Million) Analysis by Capacity Type, 2018 to 2033

Figure 9: Global Market Volume (Units) Analysis by Capacity Type, 2018 to 2033

Figure 10: Global Market Value Share (%) and BPS Analysis by Capacity Type, 2023 to 2033

Figure 11: Global Market Y-o-Y Growth (%) Projections by Capacity Type, 2023 to 2033

Figure 12: Global Market Value (US$ Million) Analysis by End Use, 2018 to 2033

Figure 13: Global Market Volume (Units) Analysis by End Use, 2018 to 2033

Figure 14: Global Market Value Share (%) and BPS Analysis by End Use, 2023 to 2033

Figure 15: Global Market Y-o-Y Growth (%) Projections by End Use, 2023 to 2033

Figure 16: Global Market Attractiveness by Capacity Type, 2023 to 2033

Figure 17: Global Market Attractiveness by End Use, 2023 to 2033

Figure 18: Global Market Attractiveness by Region, 2023 to 2033

Figure 19: North America Market Value (US$ Million) by Capacity Type, 2023 to 2033

Figure 20: North America Market Value (US$ Million) by End Use, 2023 to 2033

Figure 21: North America Market Value (US$ Million) by Country, 2023 to 2033

Figure 22: North America Market Value (US$ Million) Analysis by Country, 2018 to 2033

Figure 23: North America Market Volume (Units) Analysis by Country, 2018 to 2033

Figure 24: North America Market Value Share (%) and BPS Analysis by Country, 2023 to 2033

Figure 25: North America Market Y-o-Y Growth (%) Projections by Country, 2023 to 2033

Figure 26: North America Market Value (US$ Million) Analysis by Capacity Type, 2018 to 2033

Figure 27: North America Market Volume (Units) Analysis by Capacity Type, 2018 to 2033

Figure 28: North America Market Value Share (%) and BPS Analysis by Capacity Type, 2023 to 2033

Figure 29: North America Market Y-o-Y Growth (%) Projections by Capacity Type, 2023 to 2033

Figure 30: North America Market Value (US$ Million) Analysis by End Use, 2018 to 2033

Figure 31: North America Market Volume (Units) Analysis by End Use, 2018 to 2033

Figure 32: North America Market Value Share (%) and BPS Analysis by End Use, 2023 to 2033

Figure 33: North America Market Y-o-Y Growth (%) Projections by End Use, 2023 to 2033

Figure 34: North America Market Attractiveness by Capacity Type, 2023 to 2033

Figure 35: North America Market Attractiveness by End Use, 2023 to 2033

Figure 36: North America Market Attractiveness by Country, 2023 to 2033

Figure 37: Latin America Market Value (US$ Million) by Capacity Type, 2023 to 2033

Figure 38: Latin America Market Value (US$ Million) by End Use, 2023 to 2033

Figure 39: Latin America Market Value (US$ Million) by Country, 2023 to 2033

Figure 40: Latin America Market Value (US$ Million) Analysis by Country, 2018 to 2033

Figure 41: Latin America Market Volume (Units) Analysis by Country, 2018 to 2033

Figure 42: Latin America Market Value Share (%) and BPS Analysis by Country, 2023 to 2033

Figure 43: Latin America Market Y-o-Y Growth (%) Projections by Country, 2023 to 2033

Figure 44: Latin America Market Value (US$ Million) Analysis by Capacity Type, 2018 to 2033

Figure 45: Latin America Market Volume (Units) Analysis by Capacity Type, 2018 to 2033

Figure 46: Latin America Market Value Share (%) and BPS Analysis by Capacity Type, 2023 to 2033

Figure 47: Latin America Market Y-o-Y Growth (%) Projections by Capacity Type, 2023 to 2033

Figure 48: Latin America Market Value (US$ Million) Analysis by End Use, 2018 to 2033

Figure 49: Latin America Market Volume (Units) Analysis by End Use, 2018 to 2033

Figure 50: Latin America Market Value Share (%) and BPS Analysis by End Use, 2023 to 2033

Figure 51: Latin America Market Y-o-Y Growth (%) Projections by End Use, 2023 to 2033

Figure 52: Latin America Market Attractiveness by Capacity Type, 2023 to 2033

Figure 53: Latin America Market Attractiveness by End Use, 2023 to 2033

Figure 54: Latin America Market Attractiveness by Country, 2023 to 2033

Figure 55: Europe Market Value (US$ Million) by Capacity Type, 2023 to 2033

Figure 56: Europe Market Value (US$ Million) by End Use, 2023 to 2033

Figure 57: Europe Market Value (US$ Million) by Country, 2023 to 2033

Figure 58: Europe Market Value (US$ Million) Analysis by Country, 2018 to 2033

Figure 59: Europe Market Volume (Units) Analysis by Country, 2018 to 2033

Figure 60: Europe Market Value Share (%) and BPS Analysis by Country, 2023 to 2033

Figure 61: Europe Market Y-o-Y Growth (%) Projections by Country, 2023 to 2033

Figure 62: Europe Market Value (US$ Million) Analysis by Capacity Type, 2018 to 2033

Figure 63: Europe Market Volume (Units) Analysis by Capacity Type, 2018 to 2033

Figure 64: Europe Market Value Share (%) and BPS Analysis by Capacity Type, 2023 to 2033

Figure 65: Europe Market Y-o-Y Growth (%) Projections by Capacity Type, 2023 to 2033

Figure 66: Europe Market Value (US$ Million) Analysis by End Use, 2018 to 2033

Figure 67: Europe Market Volume (Units) Analysis by End Use, 2018 to 2033

Figure 68: Europe Market Value Share (%) and BPS Analysis by End Use, 2023 to 2033

Figure 69: Europe Market Y-o-Y Growth (%) Projections by End Use, 2023 to 2033

Figure 70: Europe Market Attractiveness by Capacity Type, 2023 to 2033

Figure 71: Europe Market Attractiveness by End Use, 2023 to 2033

Figure 72: Europe Market Attractiveness by Country, 2023 to 2033

Figure 73: Asia Pacific Market Value (US$ Million) by Capacity Type, 2023 to 2033

Figure 74: Asia Pacific Market Value (US$ Million) by End Use, 2023 to 2033

Figure 75: Asia Pacific Market Value (US$ Million) by Country, 2023 to 2033

Figure 76: Asia Pacific Market Value (US$ Million) Analysis by Country, 2018 to 2033

Figure 77: Asia Pacific Market Volume (Units) Analysis by Country, 2018 to 2033

Figure 78: Asia Pacific Market Value Share (%) and BPS Analysis by Country, 2023 to 2033

Figure 79: Asia Pacific Market Y-o-Y Growth (%) Projections by Country, 2023 to 2033

Figure 80: Asia Pacific Market Value (US$ Million) Analysis by Capacity Type, 2018 to 2033

Figure 81: Asia Pacific Market Volume (Units) Analysis by Capacity Type, 2018 to 2033

Figure 82: Asia Pacific Market Value Share (%) and BPS Analysis by Capacity Type, 2023 to 2033

Figure 83: Asia Pacific Market Y-o-Y Growth (%) Projections by Capacity Type, 2023 to 2033

Figure 84: Asia Pacific Market Value (US$ Million) Analysis by End Use, 2018 to 2033

Figure 85: Asia Pacific Market Volume (Units) Analysis by End Use, 2018 to 2033

Figure 86: Asia Pacific Market Value Share (%) and BPS Analysis by End Use, 2023 to 2033

Figure 87: Asia Pacific Market Y-o-Y Growth (%) Projections by End Use, 2023 to 2033

Figure 88: Asia Pacific Market Attractiveness by Capacity Type, 2023 to 2033

Figure 89: Asia Pacific Market Attractiveness by End Use, 2023 to 2033

Figure 90: Asia Pacific Market Attractiveness by Country, 2023 to 2033

Figure 91: MEA Market Value (US$ Million) by Capacity Type, 2023 to 2033

Figure 92: MEA Market Value (US$ Million) by End Use, 2023 to 2033

Figure 93: MEA Market Value (US$ Million) by Country, 2023 to 2033

Figure 94: MEA Market Value (US$ Million) Analysis by Country, 2018 to 2033

Figure 95: MEA Market Volume (Units) Analysis by Country, 2018 to 2033

Figure 96: MEA Market Value Share (%) and BPS Analysis by Country, 2023 to 2033

Figure 97: MEA Market Y-o-Y Growth (%) Projections by Country, 2023 to 2033

Figure 98: MEA Market Value (US$ Million) Analysis by Capacity Type, 2018 to 2033

Figure 99: MEA Market Volume (Units) Analysis by Capacity Type, 2018 to 2033

Figure 100: MEA Market Value Share (%) and BPS Analysis by Capacity Type, 2023 to 2033

Figure 101: MEA Market Y-o-Y Growth (%) Projections by Capacity Type, 2023 to 2033

Figure 102: MEA Market Value (US$ Million) Analysis by End Use, 2018 to 2033

Figure 103: MEA Market Volume (Units) Analysis by End Use, 2018 to 2033

Figure 104: MEA Market Value Share (%) and BPS Analysis by End Use, 2023 to 2033

Figure 105: MEA Market Y-o-Y Growth (%) Projections by End Use, 2023 to 2033

Figure 106: MEA Market Attractiveness by Capacity Type, 2023 to 2033

Figure 107: MEA Market Attractiveness by End Use, 2023 to 2033

Figure 108: MEA Market Attractiveness by Country, 2023 to 2033

Recommendations

Packaging

Reconditioned Steel Drum Market

Published : January 2024

Packaging

Steel Drum Market

Published : February 2023

Explore Packaging Insights

View Reports

Steel Drums & IBCs Market