The global steel drum market is valued at USD 4,892 million in 2025 and is set to reach USD 8,647 million by 2035, growing at a CAGR of 5.9%. The market stands at the forefront of a transformative decade that promises to redefine industrial packaging infrastructure and bulk storage container excellence across chemical manufacturers, petroleum companies, food processors, and pharmaceutical sectors. The market's journey from USD 4,892 million in 2025 to USD 8,647 million by 2035 represents substantial growth, demonstrating the accelerating adoption of durable metal containers and sophisticated liquid storage preservation systems across manufacturing facilities, distribution centers, hazardous material handling, and industrial transportation applications.
The first half of the decade (2025-2030) will witness the market climbing from USD 4,892 million to approximately USD 6,421 million, adding USD 1,529 million in value, which constitutes 41% of the total forecast growth period. This phase will be characterized by the rapid adoption of industrial packaging solutions, driven by increasing demand for chemical storage containers and enhanced leak-proof containment requirements worldwide. Superior corrosion resistance capabilities and standardized capacity features will become standard expectations rather than premium options.
The latter half (2030-2035) will witness sustained growth from USD 6,421 million to USD 8,647 million, representing an addition of USD 2,226 million or 59% of the decade's expansion. This period will be defined by mass market penetration of specialized drum systems, integration with comprehensive manufacturing platforms, and seamless compatibility with existing material handling infrastructure. The market trajectory signals fundamental shifts in how industrial manufacturers and chemical companies approach bulk liquid storage solutions, with participants positioned to benefit from sustained demand across multiple industrial segments.
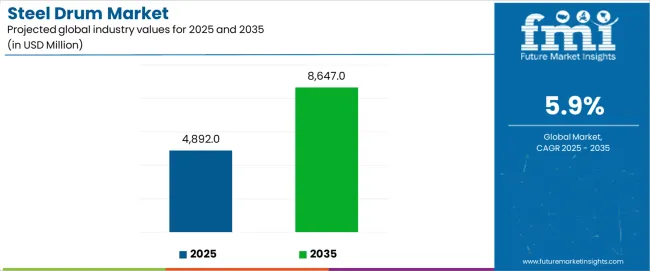
The steel drum market demonstrates distinct growth phases with varying market characteristics and competitive dynamics. Between 2025 and 2030, the market progresses through its industrial packaging adoption phase, expanding from USD 4,892 million to USD 6,421 million with steady annual increments averaging 5.6% growth. This period showcases the transition from basic steel containers to advanced corrosion-resistant and leak-proof systems with enhanced chemical compatibility and integrated handling mechanisms becoming mainstream features.
The 2025-2030 phase adds USD 1,529 million to market value, representing 41% of total decade expansion. Market maturation factors include standardization of capacity specifications, declining material costs for premium steel production, and increasing chemical manufacturer awareness of drum benefits reaching 80-85% effectiveness in bulk liquid applications. Competitive landscape evolution during this period features established manufacturers like Greif Inc. and Mauser Group expanding their product portfolios while new entrants focus on specialized food-grade steel solutions and enhanced closure technology.
From 2030 to 2035, market dynamics shift toward advanced customization and multi-industry deployment, with growth accelerating from USD 6,421 million to USD 8,647 million, adding USD 2,226 million or 59% of total expansion. This phase transition logic centers on universal steel drum systems, integration with automated filling equipment, and deployment across diverse industrial scenarios, becoming standard rather than specialized containers. The competitive environment matures with focus shifting from basic capacity to comprehensive containment performance and compatibility with high-speed industrial operations.
At-a-Glance Metrics
| Metric | Value |
|---|---|
| Market Value (2025) | USD 4,892 million |
| Market Forecast (2035) | USD 8,647 million |
| Growth Rate | 5.90% |
| Leading Capacity | 200-220 Liters |
| Primary Application → | Chemical Industry |
The market demonstrates strong fundamentals with 200-220 liter steel drums capturing a dominant share through optimal volume efficiency and standardized handling capabilities. Chemical industry applications drive primary demand, supported by increasing industrial manufacturing requirements and hazardous liquid storage solutions. Geographic expansion remains concentrated in developed markets with established chemical infrastructure, while emerging economies show accelerating adoption rates driven by industrial modernization projects and rising manufacturing activity.
The steel drum market represents a compelling intersection of industrial packaging innovation, leak-proof containment, and bulk storage management. With robust growth projected from USD 4,892 million in 2025 to USD 8,647 million by 2035 at a 5.90% CAGR, this market is driven by increasing chemical manufacturing expansion trends, petroleum storage requirements, and commercial demand for high-quality liquid transport formats.
The market's expansion reflects a fundamental shift in how manufacturers and industrial companies approach bulk liquid storage infrastructure. Strong growth opportunities exist across diverse applications, from chemical processing requiring hazardous material containers to food manufacturers demanding food-grade storage solutions. Geographic expansion is particularly pronounced in Asia-Pacific markets, led by China (7.2% CAGR) and India (6.8% CAGR), while established markets in North America and Europe drive innovation and specialized segment development.
The dominance of 200-220 liter capacities and chemical industry applications underscores the importance of proven containment technology and leak-proof integrity in driving adoption. Closure design and filling complexity remain key challenges, creating opportunities for companies that can deliver reliable performance while maintaining operational efficiency.
Market expansion rests on three fundamental shifts driving adoption across industrial and manufacturing sectors. Chemical industry growth creates compelling advantages through steel drum systems that provide comprehensive leak-proof containment with enhanced durability, enabling manufacturers to extend storage capabilities and maintain product integrity while justifying premium pricing over plastic alternatives. Industrial modernization accelerates as companies worldwide seek reliable bulk storage access that delivers consistent containment experiences directly to manufacturing environments, enabling operational differentiation that aligns with industrial efficiency expectations and maximizes storage capacity. Manufacturing operations optimization drives adoption from chemical facilities requiring efficient material handling solutions that maximize throughput per container while maintaining safety standards during transport and storage operations.
However, growth faces headwinds from closure complexity variations that differ across manufacturing facilities regarding equipment compatibility and filling speeds, potentially limiting performance reliability in high-volume processing categories. Container maintenance requirements also persist regarding cleaning protocols and reconditioning procedures that may increase operational complexity in markets with demanding safety standards.
Primary Classification: The market segments by capacity into 200-220 liters, 100-120 liters, 50-60 liters, and other capacity categories, representing the evolution from standard containers to specialized volume formats for comprehensive bulk liquid storage operations.
Secondary Breakdown: Application segmentation divides the market into chemical industry, petroleum & oil, food & beverages, pharmaceuticals, and others sectors, reflecting distinct requirements for capacity, chemical resistance, and containment performance.
Regional Classification: Geographic distribution covers North America, Europe, Asia Pacific, Latin America, and the Middle East & Africa, with developed markets leading adoption while emerging economies show accelerating growth patterns driven by industrial development programs.
The segmentation structure reveals technology progression from standard steel containers toward integrated containment platforms with enhanced corrosion resistance and leak-proof capabilities, while application diversity spans from chemical processing to pharmaceutical storage requiring comprehensive safety solutions and industrial handling systems.
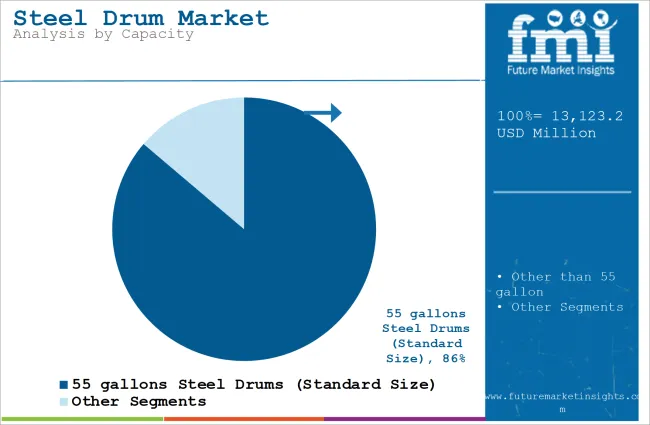
200-220 liters segment is estimated to account for 42% of the steel drum market share in 2025. The segment's leading position stems from its fundamental role as a critical component in bulk liquid storage applications and its extensive use across multiple chemical processing and petroleum sectors. The 200-220 liter capacity's dominance is attributed to its optimal volume efficiency, including standardized handling compatibility, excellent space utilization, and balanced transport economics that make it indispensable for industrial storage operations.
Market Position: 200-220 liter systems command the leading position in the steel drum market through advanced manufacturing technologies, including comprehensive wall thickness control, uniform structural integrity, and reliable closure performance that enable manufacturers to deploy containers across diverse industrial applications.
Value Drivers: The segment benefits from industry preference for proven capacity standards that provide exceptional volume optimization without requiring specialized handling protocols. Efficient loading capabilities enable deployment in chemical operations, petroleum services, and manufacturing applications where operational efficiency and storage density represent critical selection requirements.
Competitive Advantages: 200-220 liter systems differentiate through excellent volume optimization, proven durability characteristics, and compatibility with standard handling equipment that enhance storage efficiency while maintaining economical container profiles suitable for diverse industrial applications.
Key market characteristics:
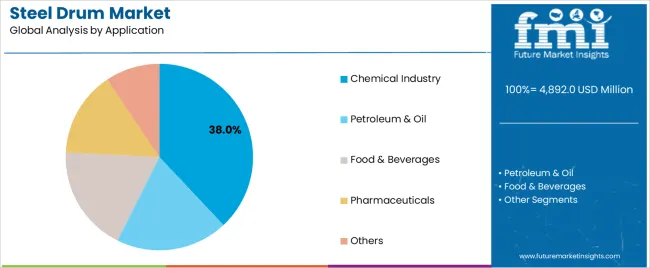
Chemical industry segment is projected to hold 38% of the steel drum market share in 2025. The segment's market leadership is driven by the extensive use of steel drums in chemical processing, hazardous material storage, industrial transport, and raw material handling, where containers serve as both containment systems and safety tools. The chemical manufacturing industry's consistent investment in safety compliance supports the segment's dominant position.
Market Context: Chemical industry applications dominate the market due to widespread adoption of bulk liquid storage and increasing focus on hazardous material containment, leak prevention, and regulatory compliance that extend manufacturing value while maintaining product integrity.
Appeal Factors: Chemical operators prioritize corrosion resistance, leak-proof construction, and integration with existing handling equipment that enable coordinated deployment across multiple processing points. The segment benefits from substantial chemical industry growth and safety standards that emphasize reliable containment access for industrial applications.
Growth Drivers: Chemical processing expansion programs incorporate steel drums as standard storage tools for raw material handling. At the same time, manufacturing safety initiatives are increasing demand for certified containers that comply with hazardous material regulations and enhance operational safety programs.
Market Challenges: Closure system variations and cleaning protocol requirements may limit deployment flexibility in ultra-high-volume operations or extreme cost-sensitive scenarios.
Application dynamics include:
Growth Accelerators: Chemical industry expansion drives primary adoption as steel drum systems provide exceptional leak-proof containment that enables product protection without compromising safety standards, supporting manufacturing revenue enhancement and regulatory compliance that require bulk liquid storage formats. Industrial modernization accelerates market growth as companies seek reliable containment experiences that maintain chemical characteristics during transport while enhancing operational flexibility through refined container design. Manufacturing efficiency increases worldwide, creating sustained demand for bulk storage access systems that complement industrial processes and provide competitive advantages in volume optimization.
Growth Inhibitors: Closure complexity challenges differ across manufacturing facilities regarding equipment capability and filling efficiency, which may limit market penetration and throughput in high-volume categories with demanding processing requirements. Container maintenance requirements persist regarding cleaning protocols and reconditioning procedures that may increase operational costs in safety-sensitive applications with strict regulatory specifications. Market fragmentation across multiple capacity sizes and closure types creates compatibility concerns between different handling equipment and existing manufacturing infrastructure.
Market Evolution Patterns: Adoption accelerates in chemical processing and petroleum sectors where bulk liquid storage justifies container investments, with geographic concentration in developed markets transitioning toward mainstream adoption in emerging economies driven by industrial culture development and manufacturing expansion. Technology development focuses on enhanced corrosion resistance, improved sealing mechanisms, and integration with automated handling systems that optimize product containment and operational efficiency. The market could face disruption if alternative packaging technologies or container innovations significantly challenge steel drum advantages in bulk liquid storage applications.
The steel drum market demonstrates varied regional dynamics with Growth Leaders including China (7.2% CAGR) and India (6.8% CAGR) driving expansion through industrial development and chemical manufacturing adoption. Steady Performers encompass the USA(6.5% CAGR), Germany (5.8% CAGR), and Japan (5.4% CAGR), benefiting from established manufacturing sectors and industrial packaging adoption.
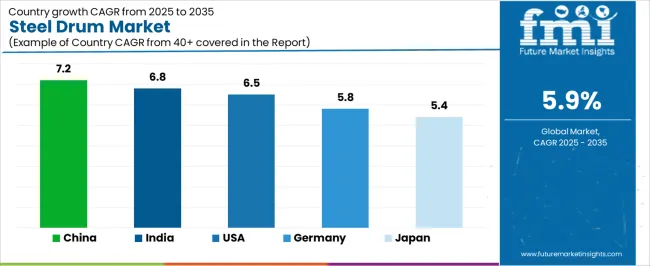
| Country | CAGR (2025-2035) |
|---|---|
| China | 7.2% |
| India | 6.8% |
| USA | 6.5% |
| Germany | 5.8% |
| Japan | 5.4% |
Regional synthesis reveals Asia-Pacific markets leading growth through industrial expansion and chemical manufacturing development, while European countries maintain steady expansion supported by traditional manufacturing heritage and premium container requirements. North American markets show strong growth driven by chemical industry proliferation and petroleum storage applications.
China establishes regional leadership through explosive chemical manufacturing expansion and comprehensive industrial modernization, integrating advanced steel drum systems as standard components in processing operations and bulk liquid applications. The country's 7.2% CAGR through 2035 reflects manufacturing preference evolution promoting chemical storage and domestic processing activity that mandate the use of leak-proof containers in industrial operations. Growth concentrates in major manufacturing centers, including Shanghai, Guangzhou, and Tianjin, where chemical facilities showcase integrated steel drum systems that appeal to industrial operators seeking reliable containment experiences and international safety standards.
Chinese manufacturers are developing innovative steel drum solutions that combine local production advantages with international containment specifications, including enhanced closure mechanisms and advanced corrosion resistance capabilities.
Strategic Market Indicators:
The Indian market emphasizes manufacturing applications, including rapid chemical industry development and comprehensive industrial modernization that increasingly incorporates steel drums for bulk liquid storage and processing applications. The country is projected to show a 6.8% CAGR through 2035, driven by massive industrial activity under chemical manufacturing initiatives and commercial demand for affordable, high-quality containment systems. Indian manufacturers prioritize cost-effectiveness with steel drums delivering bulk storage access through economical container usage and efficient containment capabilities.
Technology deployment channels include major chemical companies, petroleum manufacturers, and industrial suppliers that support high-volume usage for domestic and export applications.
Performance Metrics:
The USA market emphasizes advanced steel drum features, including innovative containment technologies and integration with comprehensive manufacturing platforms that manage bulk liquid storage, regulatory compliance, and safety control applications through unified container systems. The country is projected to show a 6.5% CAGR through 2035, driven by chemical industry expansion under industrial manufacturing trends and commercial demand for premium, reliable containment systems. American manufacturers prioritize operational efficiency with steel drums delivering comprehensive leak-proof performance through refined closure and corrosion resistance.
Technology deployment channels include major chemical companies, petroleum suppliers, and specialty container manufacturers that support custom development for premium operations.
Performance Metrics:
In Hamburg, Munich, and Cologne, German manufacturers and chemical companies are implementing advanced steel drum systems to enhance storage capabilities and support industrial processing that aligns with manufacturing protocols and safety standards. The German market demonstrates sustained growth with a 5.8% CAGR through 2035, driven by traditional manufacturing innovation programs and chemical industry investments that emphasize premium container systems for bulk liquid and specialty applications. German manufacturing facilities are prioritizing steel drum systems that provide exceptional containment quality while maintaining compliance with industrial safety standards and minimizing product contamination, particularly important in chemical operations and pharmaceutical manufacturing facilities.
Market expansion benefits from manufacturing excellence programs that mandate enhanced containment in container specifications, creating sustained demand across Germany's chemical and industrial sectors, where leak-proof integrity and container reliability represent critical requirements.
Strategic Market Indicators:
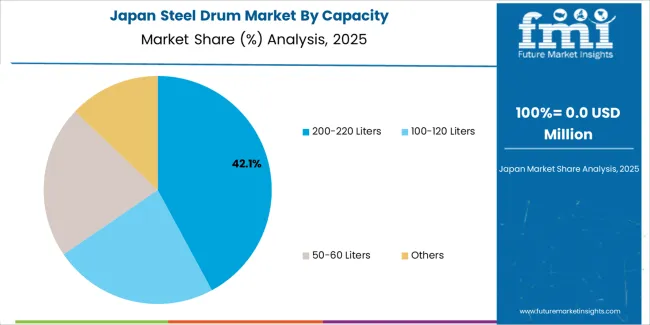
Japan's sophisticated manufacturing market demonstrates meticulous steel drum deployment, growing at 5.4% CAGR, with documented operational excellence in bulk liquid containment and industrial storage applications through integration with existing handling systems and quality assurance infrastructure. The country leverages engineering expertise in container manufacturing and closure precision to maintain market leadership. Manufacturing centers, including Tokyo, Osaka, and Nagoya, showcase advanced installations where steel drum systems integrate with comprehensive filling platforms and containment systems to optimize product integrity and operational efficiency.
Japanese manufacturers prioritize containment precision and container consistency in product development, creating demand for premium steel drum systems with advanced features, including ultra-reliable sealing and integration with automated handling protocols. The market benefits from established manufacturing infrastructure and willingness to invest in specialized containment technologies that provide superior leak prevention and regulatory compliance.
Market Intelligence Brief:
The steel drum market in Europe is projected to grow from USD 1,467 million in 2025 to USD 2,316 million by 2035, registering a CAGR of 4.6% over the forecast period. Germany is expected to maintain its leadership position with a 36.2% market share in 2025, declining slightly to 35.8% by 2035, supported by its manufacturing excellence and major chemical processing centers, including North Rhine-Westphalia and Bavaria.
United Kingdom follows with a 23.7% share in 2025, projected to reach 24.1% by 2035, driven by comprehensive chemical industry and petroleum sector adoption. France holds a 17.3% share in 2025, expected to maintain 17.6% by 2035 through established industrial manufacturing sectors and premium container adoption. Italy commands a 12.8% share, while Belgium accounts for 7.2% in 2025. The Rest of Europe region is anticipated to gain momentum, expanding its collective share from 2.8% to 3.1% by 2035, attributed to increasing industrial development in Eastern European countries and emerging Nordic manufacturing brands implementing premium container programs.
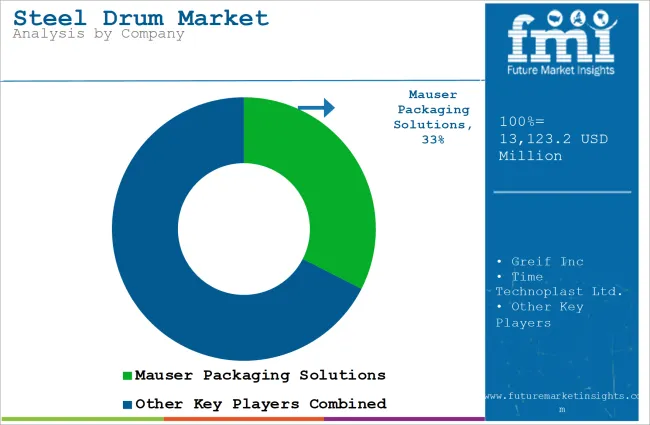
The steel drum market operates with moderate concentration, featuring approximately 20-28 participants, where leading companies control roughly 45-52% of the global market share through established distribution networks and comprehensive container manufacturing capabilities. Competition emphasizes containment performance, durability features, and handling compatibility rather than price-based rivalry.
Market leaders encompass Greif Inc., Mauser Group, and Industrial Container Services, which maintain competitive advantages through extensive container manufacturing expertise, global distribution networks, and comprehensive technical support capabilities that create customer loyalty and support industrial requirements. These companies leverage decades of industrial packaging experience and ongoing containment technology investments to develop advanced steel drum systems with exceptional leak-proof performance and corrosion resistance features. Greif Inc. leads with 10% share.
Specialty challengers include Schott AG, TPG Packaging, and Berlin Packaging, which compete through specialized industrial innovation focus and efficient containment solutions that appeal to chemical manufacturers seeking premium safety formats and custom capacity flexibility. These companies differentiate through design engineering emphasis and specialized industrial application focus.
Market dynamics favor participants that combine reliable containment performance with advanced handling support, including pressure management and closure precision. Competitive pressure intensifies as traditional packaging manufacturers expand into steel drum systems. At the same time, specialized industrial equipment suppliers challenge established players through innovative safety technologies and cost-effective production targeting emerging chemical manufacturing segments.
| Item | Value |
|---|---|
| Quantitative Units | USD 4,892 million |
| Capacity | 200-220 Liters, 100-120 Liters, 50-60 Liters, Others |
| Application | Chemical Industry, Petroleum & Oil, Food & Beverages, Pharmaceuticals, Others |
| Regions Covered | North America, Europe, Asia Pacific, Latin America, Middle East & Africa |
| Countries Covered | U.S., Germany, Japan, China, India, and 25+ additional countries |
| Key Companies Profiled | Greif Inc., Mauser Group, Industrial Container Services, Schott AG, TPG Packaging, Berlin Packaging |
| Additional Attributes | Dollar sales by capacity and application categories, regional adoption trends across North America, Europe, and Asia-Pacific, competitive landscape with container manufacturers and industrial equipment suppliers, manufacturer preferences for containment quality and handling compatibility, integration with filling equipment and closure systems, innovations in corrosion resistance technology and leak-proof design, and development of specialized containment solutions with enhanced safety capabilities and user-friendly features |
The global steel drum market is estimated to be valued at USD 4,892.0 million in 2025.
The market size for the steel drum market is projected to reach USD 8,647.0 million by 2035.
The steel drum market is expected to grow at a 5.9% CAGR between 2025 and 2035.
The key product types in steel drum market are 200-220 liters, 100-120 liters, 50-60 liters and others.
In terms of application, chemical industry segment to command 38.0% share in the steel drum market in 2025.


Our Research Products

The "Full Research Suite" delivers actionable market intel, deep dives on markets or technologies, so clients act faster, cut risk, and unlock growth.

The Leaderboard benchmarks and ranks top vendors, classifying them as Established Leaders, Leading Challengers, or Disruptors & Challengers.

Locates where complements amplify value and substitutes erode it, forecasting net impact by horizon

We deliver granular, decision-grade intel: market sizing, 5-year forecasts, pricing, adoption, usage, revenue, and operational KPIs—plus competitor tracking, regulation, and value chains—across 60 countries broadly.

Spot the shifts before they hit your P&L. We track inflection points, adoption curves, pricing moves, and ecosystem plays to show where demand is heading, why it is changing, and what to do next across high-growth markets and disruptive tech

Real-time reads of user behavior. We track shifting priorities, perceptions of today’s and next-gen services, and provider experience, then pace how fast tech moves from trial to adoption, blending buyer, consumer, and channel inputs with social signals (#WhySwitch, #UX).

Partner with our analyst team to build a custom report designed around your business priorities. From analysing market trends to assessing competitors or crafting bespoke datasets, we tailor insights to your needs.
Supplier Intelligence
Discovery & Profiling
Capacity & Footprint
Performance & Risk
Compliance & Governance
Commercial Readiness
Who Supplies Whom
Scorecards & Shortlists
Playbooks & Docs
Category Intelligence
Definition & Scope
Demand & Use Cases
Cost Drivers
Market Structure
Supply Chain Map
Trade & Policy
Operating Norms
Deliverables
Buyer Intelligence
Account Basics
Spend & Scope
Procurement Model
Vendor Requirements
Terms & Policies
Entry Strategy
Pain Points & Triggers
Outputs
Pricing Analysis
Benchmarks
Trends
Should-Cost
Indexation
Landed Cost
Commercial Terms
Deliverables
Brand Analysis
Positioning & Value Prop
Share & Presence
Customer Evidence
Go-to-Market
Digital & Reputation
Compliance & Trust
KPIs & Gaps
Outputs
Full Research Suite comprises of:
Market outlook & trends analysis
Interviews & case studies
Strategic recommendations
Vendor profiles & capabilities analysis
5-year forecasts
8 regions and 60+ country-level data splits
Market segment data splits
12 months of continuous data updates
DELIVERED AS:
PDF EXCEL ONLINE
Steel Drums & IBCs Market Size and Share Forecast Outlook 2025 to 2035
Steel Drum Industry Analysis in Southeast Asia Size and Share Forecast Outlook 2025 to 2035
Competitive Overview of Steel Drum Market Share
Examining Market Share Trends in Steel Drums and IBCs Industry
Japan Steel Drum Market Analysis – Trends & Forecast 2023-2033
Korea Steel Drum Market Growth – Trends & Forecast 2023-2033
Western Europe Steel Drum Market Insights – Trends & Forecast 2023-2033
Steel Salvage Drums Market Size and Share Forecast Outlook 2025 to 2035
India Steel Drum & IBC Market Size and Share Forecast Outlook 2025 to 2035
Reconditioned Steel Drum Market Size and Share Forecast Outlook 2025 to 2035
Industry Share Analysis for Reconditioned Steel Drum Providers
Drum Brake Shoe Market Size and Share Forecast Outlook 2025 to 2035
Drum Melters Market Size and Share Forecast Outlook 2025 to 2035
Steel Roll-on Tube Market Size and Share Forecast Outlook 2025 to 2035
Drum Filling Machine Market Size and Share Forecast Outlook 2025 to 2035
Steel Testing Equipment Market Size and Share Forecast Outlook 2025 to 2035
Steel Wire Reinforced Polyethylene Pipe Market Size and Share Forecast Outlook 2025 to 2035
Steel Wire Market Size and Share Forecast Outlook 2025 to 2035
Steel Strapping Market Size and Share Forecast Outlook 2025 to 2035
Steel Studs Market Size and Share Forecast Outlook 2025 to 2035

Thank you!
You will receive an email from our Business Development Manager. Please be sure to check your SPAM/JUNK folder too.
Chat With
MaRIA