Steel Market Size and Share Forecast Outlook 2025 to 2035

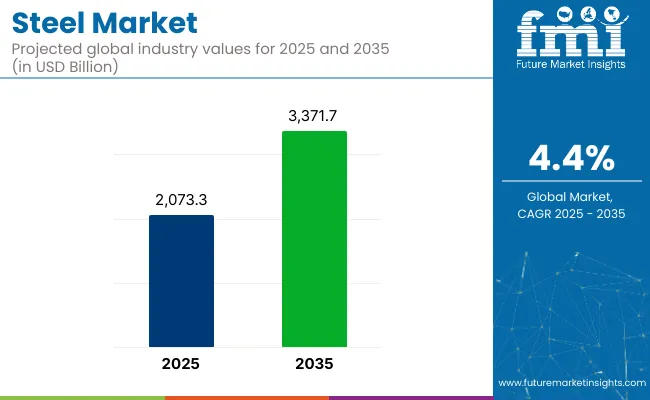
The steel market is valued at USD 2,073.3 billion in 2025 and is projected to reach USD 3,371.7 billion by 2035, expanding at a CAGR of 4.4%. Global demand for steel has been supported by construction, automotive, and infrastructure sectors. As economies invest in urban development and renewable energy, structural-grade and specialty steels are gaining attention for their durability, cost-effectiveness, and versatility in large-scale applications.
Quick Stats for Steel Market

  • Market Value (2025): USD 2,073.3 billion
  • Forecast Value (2035): USD 3,371.7 billion
  • Forecast CAGR: 4.4%
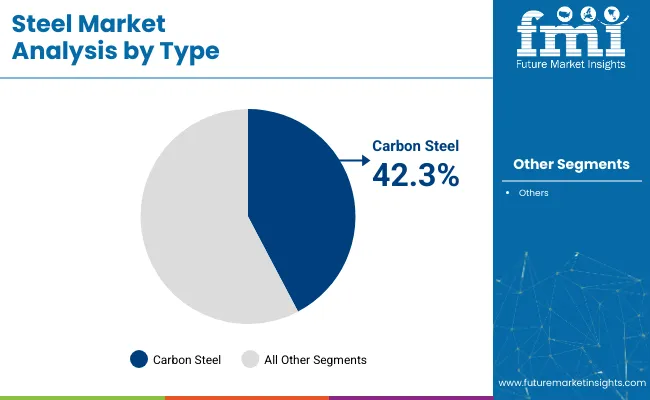
  • Type Leader in 2025: Carbon Steel (42.3% market share)
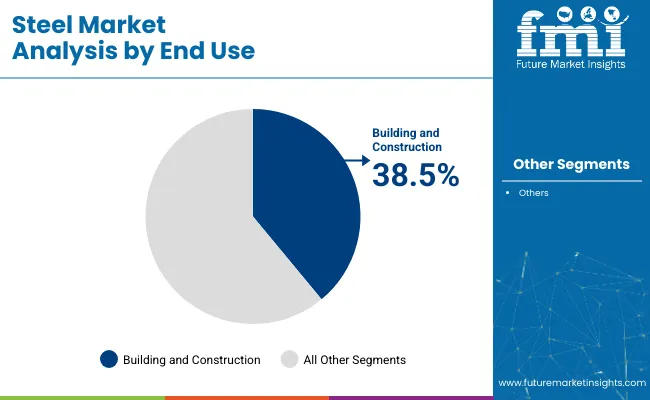
  • Top End-Use Segment: Building and Construction (38.5% market share)
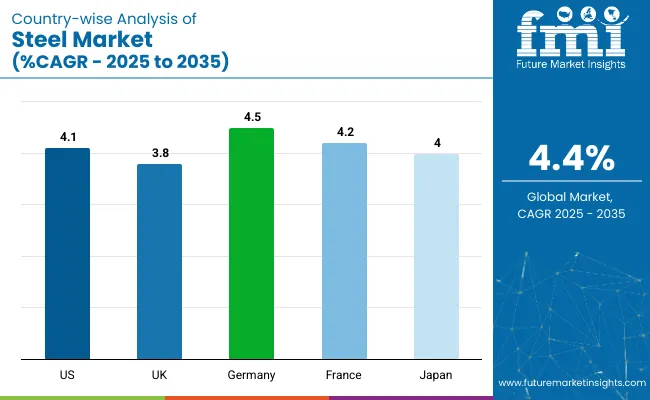
  • Key Growth Country: (Germany is the fastest-growing market with 4.5% CAGR)

Steel Market

Metric Value
Industry Value (2025E) USD 2,073.3 billion
Industry Value (2035F) USD 3,371.7 billion
CAGR (2025 to 2035) 4.4%

Carbon steel is anticipated to hold the highest share among material types due to its wide applications across infrastructure and machinery, contributing approximately 42.3% of total revenue in 2025. In end-use, building and construction is likely to lead with over 38.5% share. Meanwhile, Germany is expected to register the fastest growth at a CAGR of 4.5%, driven by its automotive and shipbuilding industries.

The steel market holds approximately 70% to 75% share in the ferrous metals market, given its dominant role among iron-based materials. Within the metals market, steel accounts for around 45% to 50%, supported by its widespread industrial use. In the construction materials market, it represents 30% to 35%, being vital for structural applications.

The automotive materials market sees a 25% to 30% share for steel, particularly in vehicle frames and body parts. Steel also holds about 20% in the industrial raw materials market and 15% to 20% in engineering materials, where strength, durability, and cost-efficiency are key factors.

Innovation in the steel market has focused on hydrogen-based production processes, electric arc furnace (EAF) integration, and lightweight high-strength alloys for EV manufacturing. Manufacturers are shifting toward customized steel grades for specific end-use industries, with R&D investments targeting better corrosion resistance, heat tolerance, and recyclability. Advanced digital manufacturing tools such as AI-driven quality monitoring and predictive maintenance are being adopted across production lines.

Sustainability has become a critical pillar of growth in the steel industry. Countries such as Germany, France, and Japan are incentivizing low-carbon technologies, while steelmakers globally are investing in green hydrogen, carbon capture, and EAF upgrades. Regulatory mechanisms like the Carbon Border Adjustment Mechanism (CBAM) in the EU and incentives under the USA’s Inflation Reduction Act are encouraging firms to accelerate their decarbonization roadmaps.

Geopolitical instability and raw material cost fluctuations have emerged as challenges in global steel production. In response, steel producers are securing long-term supplier agreements and building regional production hubs to strengthen supply chain resilience. Demand remains strong across EVs, offshore wind, and infrastructure sectors, suggesting continued market robustness through 2035.

Analyzing Steel Market by Top Investment Segments

The market is segmented by type, end use, and region. By type, the market is categorized into carbon steel (low-carbon steel, medium-carbon steel, high-carbon steel), stainless steel (austenitic, ferritic, martensitic, others), alloy steel (high strength steel, low alloy steel), tool steel, and others (weathering steel).

Based on end use, the market is segmented into building and construction (escalators and lifts, cladding, frames and supporting rails, piping, plumbing and drainage, roofing), automotive (chassis, automotive body parts, others), railways, shipbuilding and marine, aerospace, oil and gas and energy, heavy machinery and equipment, consumer appliances, and cutting tools and agriculture equipment. Regionally, the market is classified into North America, Latin America, Western Europe, Eastern Europe, East Asia, South Asia Pacific, Middle East and Africa.

Carbon Steel to Lead the Type Segment with 42.3% Market Share

Carbon steel is expected to dominate the steel type segment, capturing 42.3% of the global market share in 2025. Its widespread use in construction, automotive, pipelines, and heavy equipment is due to its cost-effectiveness, tensile strength, and versatility.
  • Widely adopted for construction-grade beams, bridges, and reinforcement structures.
  • Low-carbon steel remains preferred for structural applications and pipelines.
  • Medium and high-carbon steel grades used in tools, gears, and automotive components.
  • Increasing demand from developing countries for urban infrastructure and transport.

Steel Market Analysis By Type

Building and Construction Segment to Lead the End Use Category with 38.5% Market Share

The building and construction segment is projected to account for 38.5% of the global steel demand by 2025. The expansion of public infrastructure, housing projects, and commercial buildings has significantly contributed to the segment’s growth.
  • Strong demand for structural steel in beams, frames, and cladding.
  • Surge in high-rise construction across urban regions globally.
  • Durable, corrosion-resistant steel favored for drainage, plumbing, and roofing.
  • Government-led infrastructure programs in Asia and North America boosting demand.

Steel Market Analysis By End Use

Top Steel Market Dynamics

The global steel market is experiencing consistent growth, driven by rising infrastructure investment, demand from automotive and energy sectors, and decarbonization-led innovation. Manufacturers are increasingly shifting toward electric arc furnaces (EAFs) and green hydrogen technologies to align with carbon regulations and cost efficiency.

Recent Trends in the Steel Market

  • Shift toward hydrogen-based steelmaking to lower carbon emissions.
  • Increased demand for high-strength, lightweight steel in electric vehicle production.
  • Expansion of digitalization and AI-driven automation in steel manufacturing.
  • Strategic R&D on corrosion-resistant and recyclable steel grades.

Challenges in the Steel Market

  • High volatility in raw material prices such as iron ore and coking coal.
  • Carbon regulations tightening globally, raising compliance costs.
  • Supply chain disruptions impacting material flow and production planning.
  • Competitive pricing pressures from emerging Asian exporters.

Analyzing Top Countries Exporting and Supplying Steel

Country Wise Analysis Of Steel Market Cagr 2025 To 2035

Germany leads steel market growth among the listed countries with a projected CAGR of 4.5% (2025 to 2035), driven by EV demand, renewable energy investments, and hydrogen-based steelmaking. France follows at 4.2%, supported by offshore wind projects and green steel policies.

The USA shows a 4.1% CAGR, fueled by infrastructure spending and reshoring. Japan, at 4.0%, benefits from specialty steel exports and AI-integrated production despite slowing domestic demand. The UK lags slightly with a 3.8% CAGR, focusing on decarbonization and stainless steel applications. Across these regions, climate goals, EV sector growth, and digital transformation are shaping steel market expansion.

The report covers in-depth analysis of 40+ countries; five top-performing OECD countries are highlighted below.

USA Steel Market Analysis

The sales of steel in the USA is forecasted to grow at a CAGR of 4.1% from 2025 to 2035. This is driven by strong infrastructure spending, demand from EV and energy sectors, and reshoring initiatives aimed at reducing import reliance.

  • Government-funded infrastructure fueling steel consumption.
  • High demand for lightweight, high-strength steel in automotive.
  • Incentives under the Inflation Reduction Act promoting green steel.
  • Digitalization and AI boosting operational efficiency in steel plants.

Steel Sales Analysis in the UK

The steel revenues in the UK is projected to grow at a CAGR of 3.8% during the forecast period. Green steel initiatives and regulatory support for decarbonization are central to its transformation.

  • Focus on hydrogen-based steel and electric arc furnace transition.
  • Infrastructure projects boosting structural steel demand.
  • High operational costs limiting domestic competitiveness.
  • Increasing use of stainless steel in aerospace and rail.

Germany Steel Market Analysis

Demand for steel in Germany is expected to register a CAGR of 4.5% from 2025 to 2035. The country's leadership in automotive and renewable energy is enhancing demand for advanced, sustainable steel solutions.

  • Automotive sector prioritizing high-strength EV-grade steel.
  • Strong push for decarbonization under Federal Climate Protection Act.
  • EU’s CBAM providing local market protections.
  • Investment in hydrogen steel and electric furnaces.

France Steel Market Analysis

Steel sales in France is projected to expand with a CAGR of 4.2% through 2035. Offshore wind energy and EV sectors are key drivers, with strong regulatory support for low-emission steelmaking.

  • Growth in corrosion-resistant steel for wind turbines.
  • Hydrogen-based production supported by France 2030 plan.
  • Adoption of CBAM aiding domestic producers.
  • Lightweight steel alloys gaining traction in automotive.

Japan Steel Market Analysis

Japan’s steel revenue is anticipated to grow at a CAGR of 4.0% over the forecast period. High-quality specialty steel exports and precision manufacturing are sustaining growth.

  • High-end steel demand in aerospace and robotics.
  • Government subsidies for hydrogen steel technologies.
  • Focus on AI-driven predictive maintenance in steel plants.
  • Decline in domestic construction offset by export growth.

Leading Steel Suppliers and Distributors

The global steel market is moderately consolidated with dominant players and regional competitors shaping growth through sustainability, capacity expansion, and product innovation. Strategic partnerships, AI-integrated manufacturing, and investments in low-carbon technologies are key competitive levers.

Top-tier firms such as China Baowu Steel Group, ArcelorMittal, POSCO, Nippon Steel, and JSW Steel are scaling electric arc furnace (EAF) projects, advancing specialty steel production, and expanding into green hydrogen steelmaking.

Recent Steel Industry News

  • In June 2025,Nippon Steel acquired USA Steel Corporation for USD 14.9 billion, expanding its reach in North America.
  • In June 2024, Nucor announced its intent to acquire Rytec Corporation, high-performance door manufacturer. This deal helped it boost its position.

Steel Market Report Scope

Report Attributes Details
Current Total Market Size (2025) USD 2,073.3 billion
Projected Market Size (2035) USD 3,371.7 billion
CAGR (2025 to 2035) 4.4%
Base Year for Estimation 2024
Historical Period 2020 to 2024
Projections Period 2025 to 2035
Market Analysis Parameters Revenue in USD billions / Volume in metric tons
By Steel Type Carbon Steel (Low-, Medium-, High-Carbon), Stainless Steel (Austenitic, Ferritic , Martensitic , Others ), Alloy Steel (High Strength, Low Alloy ), Tool Steel, Others
By End Use Building and Construction (Escalators & Lifts, Cladding, Frames, Piping, Drainage, Roofing), Automotive (Chassis, Body Parts, Others), Railways, Shipbuilding and Marine, Aerospace, Oil & Gas and Energy, Heavy Machinery and Equipment, Consumer Appliances, Cutting Tools and Agriculture Equipment
Regions Covered North America, Latin America, Western Europe, Eastern Europe, East Asia, South Asia Pacific, Middle East, Africa
Countries Covered United States, United Kingdom, Germany, France, Japan, South Korea, China, Brazil, India, Italy
Key Players Baowu Group Corporation Limited, ArcelorMittal , Nippon Corporation, Thyssenkrupp AG, Nucor Corporation, JFE Corporation, Tata Limited, Posco International, Cleveland-Cliffs Inc , EVRAZ Plc, Gerdau S.A., Hyundai Co, Jiangsu Shagang Group Co., Ltd., United States Corp., Novolipetsk Steel, Severstal , Authority of India Limited, and JSW Limited.
Additional Attributes Market share analysis by steel type and region, policy impact tracking, decarbonization investment trend, and country-wise CAGR analysis

Key Segmentation

By Steel Type:

Carbon Steel, Low-Carbon Steel, Medium-Carbon Steel, High-Carbon Steel, Stainless Steel, Austenitic Stainless Steel, Ferritic Stainless Steel, Martensitic Stainless Steel, Others, Alloy Steel, High Strength Steel, Low Alloy Steel, Tool Steel, Others

By End-Use:

Building and Construction, Escalators and Lifts, Cladding, Frames and Supporting Rails, Piping, Plumbing and Drainage, Roofing, Automotive, Chassis, Automotive Body Parts, Others, Railways, Shipbuilding and Marine, Aerospace, Oil and Gas and Energy, Heavy Machinery and Equipment, Consumer Appliances, Cutting Tools and Agriculture Equipment

By Region:

North America, Latin America, Western Europe, Eastern Europe, East Asia, South Asia Pacific, Middle East, Africa

Table of Content

  1. Executive Summary
    • Global Market Outlook
    • Demand-side Trends
    • Supply-side Trends
    • Technology Roadmap Analysis
    • Analysis and Recommendations
  2. Market Overview
    • Market Coverage / Taxonomy
    • Market Definition / Scope / Limitations
  3. Market Background
    • Market Dynamics
      • Drivers
      • Restraints
      • Opportunity
      • Trends
    • Scenario Forecast
      • Demand in Optimistic Scenario
      • Demand in Likely Scenario
      • Demand in Conservative Scenario
    • Opportunity Map Analysis
    • Product Life Cycle Analysis
    • Supply Chain Analysis
      • Supply Side Participants and their Roles
        • Producers
        • Mid-Level Participants (Traders/ Agents/ Brokers)
        • Wholesalers and Distributors
      • Value Added and Value Created at Node in the Supply Chain
      • List of Raw Material Suppliers
      • List of Existing and Potential Buyer’s
    • Investment Feasibility Matrix
    • Value Chain Analysis
      • Profit Margin Analysis
      • Wholesalers and Distributors
      • Retailers
    • PESTLE and Porter’s Analysis
    • Regulatory Landscape
      • By Key Regions
      • By Key Countries
    • Regional Parent Market Outlook
    • Production and Consumption Statistics
    • Import and Export Statistics
  4. Global Market Analysis 2020 to 2024 and Forecast, 2025 to 2035
    • Historical Market Size Value (USD Billion) & Volume (Metric Tons) Analysis, 2020 to 2024
    • Current and Future Market Size Value (USD Billion) & Volume (Metric Tons) Projections, 2025 to 2035
      • Y-o-Y Growth Trend Analysis
      • Absolute $ Opportunity Analysis
  5. Global Market Pricing Analysis 2020 to 2024 and Forecast 2025 to 2035
  6. Global Market Analysis 2020 to 2024 and Forecast 2025 to 2035, By Type
    • Introduction / Key Findings
    • Historical Market Size Value (USD Billion) & Volume (Metric Tons) Analysis By Type, 2020 to 2024
    • Current and Future Market Size Value (USD Billion) & Volume (Metric Tons) Analysis and Forecast By Type, 2025 to 2035
      • Carbon Steel
        • Low-Carbon Steel
        • Medium-Carbon Steel
        • High-Carbon Steel
      • Stainless Steel
        • Austenitic Stainless Steel
        • Ferritic Stainless Steel
        • Martensitic Stainless Steel
        • Others
      • Alloy Steel
        • High Strength Steel
        • Low Alloy Steel
      • Tool Steel
      • Others
    • Y-o-Y Growth Trend Analysis By Type, 2020 to 2024
    • Absolute $ Opportunity Analysis By Type, 2025 to 2035
  7. Global Market Analysis 2020 to 2024 and Forecast 2025 to 2035, By End Use
    • Introduction / Key Findings
    • Historical Market Size Value (USD Billion) & Volume (Metric Tons) Analysis By End Use, 2020 to 2024
    • Current and Future Market Size Value (USD Billion) & Volume (Metric Tons) Analysis and Forecast By End Use, 2025 to 2035
      • Building and Construction
        • Escalators and Lifts
        • Cladding
        • Frames and Supporting Rails
        • Piping
        • Plumbing and Drainage
        • Roofing
      • Automotive
        • Chassis
        • Automotive Body Parts
        • Others
      • Railways
      • Shipbuilding and Marine
      • Aerospace
      • Oil and Gas and Energy
      • Heavy Machinery and Equipment
      • Consumer Appliances
      • Cutting Tools and Agriculture Equipment
    • Y-o-Y Growth Trend Analysis By End Use, 2020 to 2024
    • Absolute $ Opportunity Analysis By End Use, 2025 to 2035
  8. Global Market Analysis 2020 to 2024 and Forecast 2025 to 2035, By Region
    • Introduction
    • Historical Market Size Value (USD Billion) & Volume (Metric Tons) Analysis By Region, 2020 to 2024
    • Current Market Size Value (USD Billion) & Volume (Metric Tons) Analysis and Forecast By Region, 2025 to 2035
      • North America
      • Latin America
      • Western Europe
      • Eastern Europe
      • East Asia
      • South Asia & Pacific
      • Middle East and Africa
    • Market Attractiveness Analysis By Region
  9. North America Market Analysis 2020 to 2024 and Forecast 2025 to 2035, By Country
    • Historical Market Size Value (USD Billion) & Volume (Metric Tons) Trend Analysis By Market Taxonomy, 2020 to 2024
    • Market Size Value (USD Billion) & Volume (Metric Tons) Forecast By Market Taxonomy, 2025 to 2035
      • By Country
        • USA
        • Canada
        • Mexico
      • By Type
      • By End Use
    • Market Attractiveness Analysis
      • By Country
      • By Type
      • By End Use
    • Key Takeaways
  10. Latin America Market Analysis 2020 to 2024 and Forecast 2025 to 2035, By Country
    • Historical Market Size Value (USD Billion) & Volume (Metric Tons) Trend Analysis By Market Taxonomy, 2020 to 2024
    • Market Size Value (USD Billion) & Volume (Metric Tons) Forecast By Market Taxonomy, 2025 to 2035
      • By Country
        • Brazil
        • Argentina
        • Rest of LATAM
      • By Type
      • By End Use
    • Market Attractiveness Analysis
      • By Country
      • By Type
      • By End Use
    • Key Takeaways
  11. Western Europe Market Analysis 2020 to 2024 and Forecast 2025 to 2035, By Country
    • Historical Market Size Value (USD Billion) & Volume (Metric Tons) Trend Analysis By Market Taxonomy, 2020 to 2024
    • Market Size Value (USD Billion) & Volume (Metric Tons) Forecast By Market Taxonomy, 2025 to 2035
      • By Country
        • Germany
        • Italy
        • France
        • UK
        • Spain
        • BENELUX
        • Nordic
        • Rest of W.Europe
      • By Type
      • By End Use
    • Market Attractiveness Analysis
      • By Country
      • By Type
      • By End Use
    • Key Takeaways
  12. Eastern Europe Market Analysis 2020 to 2024 and Forecast 2025 to 2035, By Country
    • Historical Market Size Value (USD Billion) & Volume (Metric Tons) Trend Analysis By Market Taxonomy, 2020 to 2024
    • Market Size Value (USD Billion) & Volume (Metric Tons) Forecast By Market Taxonomy, 2025 to 2035
      • By Country
        • Russia
        • Hungary
        • Poland
        • Balkan & Baltics
        • Rest of E. Europe
      • By Type
      • By End Use
    • Market Attractiveness Analysis
      • By Country
      • By Type
      • By End Use
    • Key Takeaways
  13. East Asia Market Analysis 2020 to 2024 and Forecast 2025 to 2035, By Country
    • Historical Market Size Value (USD Billion) & Volume (Metric Tons) Trend Analysis By Market Taxonomy, 2020 to 2024
    • Market Size Value (USD Billion) & Volume (Metric Tons) Forecast By Market Taxonomy, 2025 to 2035
      • By Country
        • China
        • Japan
        • South Korea
      • By Type
      • By End Use
    • Market Attractiveness Analysis
      • By Country
      • By Type
      • By End Use
    • Key Takeaways
  14. South Asia & Pacific Market Analysis 2020 to 2024 and Forecast 2025 to 2035, By Country
    • Historical Market Size Value (USD Billion) & Volume (Metric Tons) Trend Analysis By Market Taxonomy, 2020 to 2024
    • Market Size Value (USD Billion) & Volume (Metric Tons) Forecast By Market Taxonomy, 2025 to 2035
      • By Country
        • India
        • Australia & New Zealand
        • ASEAN
        • Rest of SAP
      • By Type
      • By End Use
    • Market Attractiveness Analysis
      • By Country
      • By Type
      • By End Use
    • Key Takeaways
  15. Middle East and Africa Market Analysis 2020 to 2024 and Forecast 2025 to 2035, By Country
    • Historical Market Size Value (USD Billion) & Volume (Metric Tons) Trend Analysis By Market Taxonomy, 2020 to 2024
    • Market Size Value (USD Billion) & Volume (Metric Tons) Forecast By Market Taxonomy, 2025 to 2035
      • By Country
        • GCC Countries
        • Northern Africa
        • South Africa
        • Turkiye
        • Rest of MEA
      • By Type
      • By End Use
    • Market Attractiveness Analysis
      • By Country
      • By Type
      • By End Use
    • Key Takeaways
  16. Key Countries Market Analysis
    • USA
      • Pricing Analysis
      • Market Share Analysis, 2024
        • By Type
        • By End Use
    • Canada
      • Pricing Analysis
      • Market Share Analysis, 2024
        • By Type
        • By End Use
    • Brazil
      • Pricing Analysis
      • Market Share Analysis, 2024
        • By Type
        • By End Use
    • Mexico
      • Pricing Analysis
      • Market Share Analysis, 2024
        • By Type
        • By End Use
    • Argentina
      • Pricing Analysis
      • Market Share Analysis, 2024
        • By Type
        • By End Use
  17. Market Structure Analysis
    • Competition Dashboard
    • Competition Benchmarking
    • Market Share Analysis of Top Players
      • By Regional
      • By Type
      • By End Use
  18. Competition Analysis
    • Competition Deep Dive
      • Baowu Group Corporation Limited
        • Overview
        • Product Portfolio
        • Profitability by Market Segments (Product/Age /Sales Channel/Region)
        • Sales Footprint
        • Strategy Overview
          • Marketing Strategy
          • Product Strategy
          • Channel Strategy
      • ArcelorMittal
        • Overview
        • Product Portfolio
        • Profitability by Market Segments (Product/Age /Sales Channel/Region)
        • Sales Footprint
        • Strategy Overview
          • Marketing Strategy
          • Product Strategy
          • Channel Strategy
      • Nippon Corporation
        • Overview
        • Product Portfolio
        • Profitability by Market Segments (Product/Age /Sales Channel/Region)
        • Sales Footprint
        • Strategy Overview
          • Marketing Strategy
          • Product Strategy
          • Channel Strategy
      • Thyssenkrupp AG
        • Overview
        • Product Portfolio
        • Profitability by Market Segments (Product/Age /Sales Channel/Region)
        • Sales Footprint
        • Strategy Overview
          • Marketing Strategy
          • Product Strategy
          • Channel Strategy
      • Nucor Corporation
        • Overview
        • Product Portfolio
        • Profitability by Market Segments (Product/Age /Sales Channel/Region)
        • Sales Footprint
        • Strategy Overview
          • Marketing Strategy
          • Product Strategy
          • Channel Strategy
      • JFE Corporation
        • Overview
        • Product Portfolio
        • Profitability by Market Segments (Product/Age /Sales Channel/Region)
        • Sales Footprint
        • Strategy Overview
          • Marketing Strategy
          • Product Strategy
          • Channel Strategy
      • Tata Limited
        • Overview
        • Product Portfolio
        • Profitability by Market Segments (Product/Age /Sales Channel/Region)
        • Sales Footprint
        • Strategy Overview
          • Marketing Strategy
          • Product Strategy
          • Channel Strategy
      • Posco International
        • Overview
        • Product Portfolio
        • Profitability by Market Segments (Product/Age /Sales Channel/Region)
        • Sales Footprint
        • Strategy Overview
          • Marketing Strategy
          • Product Strategy
          • Channel Strategy
      • Cleveland-Cliffs Inc
        • Overview
        • Product Portfolio
        • Profitability by Market Segments (Product/Age /Sales Channel/Region)
        • Sales Footprint
        • Strategy Overview
          • Marketing Strategy
          • Product Strategy
          • Channel Strategy
      • EVRAZ Plc
        • Overview
        • Product Portfolio
        • Profitability by Market Segments (Product/Age /Sales Channel/Region)
        • Sales Footprint
        • Strategy Overview
          • Marketing Strategy
          • Product Strategy
          • Channel Strategy
      • Gerdau S.A.
        • Overview
        • Product Portfolio
        • Profitability by Market Segments (Product/Age /Sales Channel/Region)
        • Sales Footprint
        • Strategy Overview
          • Marketing Strategy
          • Product Strategy
          • Channel Strategy
      • Hyundai Co
        • Overview
        • Product Portfolio
        • Profitability by Market Segments (Product/Age /Sales Channel/Region)
        • Sales Footprint
        • Strategy Overview
          • Marketing Strategy
          • Product Strategy
          • Channel Strategy
      • Jiangsu Shagang Group Co., Ltd.
        • Overview
        • Product Portfolio
        • Profitability by Market Segments (Product/Age /Sales Channel/Region)
        • Sales Footprint
        • Strategy Overview
          • Marketing Strategy
          • Product Strategy
          • Channel Strategy
      • Value (USD Billion) & Volume (Metric Tons)ed States Corp.
        • Overview
        • Product Portfolio
        • Profitability by Market Segments (Product/Age /Sales Channel/Region)
        • Sales Footprint
        • Strategy Overview
          • Marketing Strategy
          • Product Strategy
          • Channel Strategy
      • Novolipetsk Steel
        • Overview
        • Product Portfolio
        • Profitability by Market Segments (Product/Age /Sales Channel/Region)
        • Sales Footprint
        • Strategy Overview
          • Marketing Strategy
          • Product Strategy
          • Channel Strategy
      • Severstal
        • Overview
        • Product Portfolio
        • Profitability by Market Segments (Product/Age /Sales Channel/Region)
        • Sales Footprint
        • Strategy Overview
          • Marketing Strategy
          • Product Strategy
          • Channel Strategy
      • Authority of India Limited
        • Overview
        • Product Portfolio
        • Profitability by Market Segments (Product/Age /Sales Channel/Region)
        • Sales Footprint
        • Strategy Overview
          • Marketing Strategy
          • Product Strategy
          • Channel Strategy
      • JSW Limited
        • Overview
        • Product Portfolio
        • Profitability by Market Segments (Product/Age /Sales Channel/Region)
        • Sales Footprint
        • Strategy Overview
          • Marketing Strategy
          • Product Strategy
          • Channel Strategy
  19. Assumptions & Acronyms Used
  20. Research Methodology

List of Tables

  • Table 1: Global Market Value (USD Billion) Forecast by Region, 2020 to 2035
  • Table 2: Global Market Volume (Metric Tons) Forecast by Region, 2020 to 2035
  • Table 3: Global Market Value (USD Billion) Forecast by Type, 2020 to 2035
  • Table 4: Global Market Volume (Metric Tons) Forecast by Type, 2020 to 2035
  • Table 5: Global Market Value (USD Billion) Forecast by End Use, 2020 to 2035
  • Table 6: Global Market Volume (Metric Tons) Forecast by End Use, 2020 to 2035
  • Table 7: North America Market Value (USD Billion) Forecast by Country, 2020 to 2035
  • Table 8: North America Market Volume (Metric Tons) Forecast by Country, 2020 to 2035
  • Table 9: North America Market Value (USD Billion) Forecast by Type, 2020 to 2035
  • Table 10: North America Market Volume (Metric Tons) Forecast by Type, 2020 to 2035
  • Table 11: North America Market Value (USD Billion) Forecast by End Use, 2020 to 2035
  • Table 12: North America Market Volume (Metric Tons) Forecast by End Use, 2020 to 2035
  • Table 13: Latin America Market Value (USD Billion) Forecast by Country, 2020 to 2035
  • Table 14: Latin America Market Volume (Metric Tons) Forecast by Country, 2020 to 2035
  • Table 15: Latin America Market Value (USD Billion) Forecast by Type, 2020 to 2035
  • Table 16: Latin America Market Volume (Metric Tons) Forecast by Type, 2020 to 2035
  • Table 17: Latin America Market Value (USD Billion) Forecast by End Use, 2020 to 2035
  • Table 18: Latin America Market Volume (Metric Tons) Forecast by End Use, 2020 to 2035
  • Table 19: Western Europe Market Value (USD Billion) Forecast by Country, 2020 to 2035
  • Table 20: Western Europe Market Volume (Metric Tons) Forecast by Country, 2020 to 2035
  • Table 21: Western Europe Market Value (USD Billion) Forecast by Type, 2020 to 2035
  • Table 22: Western Europe Market Volume (Metric Tons) Forecast by Type, 2020 to 2035
  • Table 23: Western Europe Market Value (USD Billion) Forecast by End Use, 2020 to 2035
  • Table 24: Western Europe Market Volume (Metric Tons) Forecast by End Use, 2020 to 2035
  • Table 25: Eastern Europe Market Value (USD Billion) Forecast by Country, 2020 to 2035
  • Table 26: Eastern Europe Market Volume (Metric Tons) Forecast by Country, 2020 to 2035
  • Table 27: Eastern Europe Market Value (USD Billion) Forecast by Type, 2020 to 2035
  • Table 28: Eastern Europe Market Volume (Metric Tons) Forecast by Type, 2020 to 2035
  • Table 29: Eastern Europe Market Value (USD Billion) Forecast by End Use, 2020 to 2035
  • Table 30: Eastern Europe Market Volume (Metric Tons) Forecast by End Use, 2020 to 2035
  • Table 31: East Asia Market Value (USD Billion) Forecast by Country, 2020 to 2035
  • Table 32: East Asia Market Volume (Metric Tons) Forecast by Country, 2020 to 2035
  • Table 33: East Asia Market Value (USD Billion) Forecast by Type, 2020 to 2035
  • Table 34: East Asia Market Volume (Metric Tons) Forecast by Type, 2020 to 2035
  • Table 35: East Asia Market Value (USD Billion) Forecast by End Use, 2020 to 2035
  • Table 36: East Asia Market Volume (Metric Tons) Forecast by End Use, 2020 to 2035
  • Table 37: South Asia & Pacific Market Value (USD Billion) Forecast by Country, 2020 to 2035
  • Table 38: South Asia & Pacific Market Volume (Metric Tons) Forecast by Country, 2020 to 2035
  • Table 39: South Asia & Pacific Market Value (USD Billion) Forecast by Type, 2020 to 2035
  • Table 40: South Asia & Pacific Market Volume (Metric Tons) Forecast by Type, 2020 to 2035
  • Table 41: South Asia & Pacific Market Value (USD Billion) Forecast by End Use, 2020 to 2035
  • Table 42: South Asia & Pacific Market Volume (Metric Tons) Forecast by End Use, 2020 to 2035
  • Table 43: Middle East and Africa Market Value (USD Billion) Forecast by Country, 2020 to 2035
  • Table 44: Middle East and Africa Market Volume (Metric Tons) Forecast by Country, 2020 to 2035
  • Table 45: Middle East and Africa Market Value (USD Billion) Forecast by Type, 2020 to 2035
  • Table 46: Middle East and Africa Market Volume (Metric Tons) Forecast by Type, 2020 to 2035
  • Table 47: Middle East and Africa Market Value (USD Billion) Forecast by End Use, 2020 to 2035
  • Table 48: Middle East and Africa Market Volume (Metric Tons) Forecast by End Use, 2020 to 2035

List of Figures

  • Figure 1: Global Market Volume (Metric Tons) Forecast 2020 to 2035
  • Figure 2: Global Market Pricing Analysis
  • Figure 3: Global Market Value (USD Billion) Forecast 2020 to 2035
  • Figure 4: Global Market Value Share and BPS Analysis by Type, 2025 and 2035
  • Figure 5: Global Market Y-o-Y Growth Comparison by Type, 2025 to 2035
  • Figure 6: Global Market Attractiveness Analysis by Type
  • Figure 7: Global Market Value Share and BPS Analysis by End Use, 2025 and 2035
  • Figure 8: Global Market Y-o-Y Growth Comparison by End Use, 2025 to 2035
  • Figure 9: Global Market Attractiveness Analysis by End Use
  • Figure 10: Global Market Value (USD Billion) Share and BPS Analysis by Region, 2025 and 2035
  • Figure 11: Global Market Y-o-Y Growth Comparison by Region, 2025 to 2035
  • Figure 12: Global Market Attractiveness Analysis by Region
  • Figure 13: North America Market Incremental $ Opportunity, 2025 to 2035
  • Figure 14: Latin America Market Incremental $ Opportunity, 2025 to 2035
  • Figure 15: Western Europe Market Incremental $ Opportunity, 2025 to 2035
  • Figure 16: Eastern Europe Market Incremental $ Opportunity, 2025 to 2035
  • Figure 17: East Asia Market Incremental $ Opportunity, 2025 to 2035
  • Figure 18: South Asia & Pacific Market Incremental $ Opportunity, 2025 to 2035
  • Figure 19: Middle East and Africa Market Incremental $ Opportunity, 2025 to 2035
  • Figure 20: North America Market Value Share and BPS Analysis by Country, 2025 and 2035
  • Figure 21: North America Market Value Share and BPS Analysis by Type, 2025 and 2035
  • Figure 22: North America Market Y-o-Y Growth Comparison by Type, 2025 to 2035
  • Figure 23: North America Market Attractiveness Analysis by Type
  • Figure 24: North America Market Value Share and BPS Analysis by End Use, 2025 and 2035
  • Figure 25: North America Market Y-o-Y Growth Comparison by End Use, 2025 to 2035
  • Figure 26: North America Market Attractiveness Analysis by End Use
  • Figure 27: Latin America Market Value Share and BPS Analysis by Country, 2025 and 2035
  • Figure 28: Latin America Market Value Share and BPS Analysis by Type, 2025 and 2035
  • Figure 29: Latin America Market Y-o-Y Growth Comparison by Type, 2025 to 2035
  • Figure 30: Latin America Market Attractiveness Analysis by Type
  • Figure 31: Latin America Market Value Share and BPS Analysis by End Use, 2025 and 2035
  • Figure 32: Latin America Market Y-o-Y Growth Comparison by End Use, 2025 to 2035
  • Figure 33: Latin America Market Attractiveness Analysis by End Use
  • Figure 34: Western Europe Market Value Share and BPS Analysis by Country, 2025 and 2035
  • Figure 35: Western Europe Market Value Share and BPS Analysis by Type, 2025 and 2035
  • Figure 36: Western Europe Market Y-o-Y Growth Comparison by Type, 2025 to 2035
  • Figure 37: Western Europe Market Attractiveness Analysis by Type
  • Figure 38: Western Europe Market Value Share and BPS Analysis by End Use, 2025 and 2035
  • Figure 39: Western Europe Market Y-o-Y Growth Comparison by End Use, 2025 to 2035
  • Figure 40: Western Europe Market Attractiveness Analysis by End Use
  • Figure 41: Eastern Europe Market Value Share and BPS Analysis by Country, 2025 and 2035
  • Figure 42: Eastern Europe Market Value Share and BPS Analysis by Type, 2025 and 2035
  • Figure 43: Eastern Europe Market Y-o-Y Growth Comparison by Type, 2025 to 2035
  • Figure 44: Eastern Europe Market Attractiveness Analysis by Type
  • Figure 45: Eastern Europe Market Value Share and BPS Analysis by End Use, 2025 and 2035
  • Figure 46: Eastern Europe Market Y-o-Y Growth Comparison by End Use, 2025 to 2035
  • Figure 47: Eastern Europe Market Attractiveness Analysis by End Use
  • Figure 48: East Asia Market Value Share and BPS Analysis by Country, 2025 and 2035
  • Figure 49: East Asia Market Value Share and BPS Analysis by Type, 2025 and 2035
  • Figure 50: East Asia Market Y-o-Y Growth Comparison by Type, 2025 to 2035
  • Figure 51: East Asia Market Attractiveness Analysis by Type
  • Figure 52: East Asia Market Value Share and BPS Analysis by End Use, 2025 and 2035
  • Figure 53: East Asia Market Y-o-Y Growth Comparison by End Use, 2025 to 2035
  • Figure 54: East Asia Market Attractiveness Analysis by End Use
  • Figure 55: South Asia & Pacific Market Value Share and BPS Analysis by Country, 2025 and 2035
  • Figure 56: South Asia & Pacific Market Value Share and BPS Analysis by Type, 2025 and 2035
  • Figure 57: South Asia & Pacific Market Y-o-Y Growth Comparison by Type, 2025 to 2035
  • Figure 58: South Asia & Pacific Market Attractiveness Analysis by Type
  • Figure 59: South Asia & Pacific Market Value Share and BPS Analysis by End Use, 2025 and 2035
  • Figure 60: South Asia & Pacific Market Y-o-Y Growth Comparison by End Use, 2025 to 2035
  • Figure 61: South Asia & Pacific Market Attractiveness Analysis by End Use
  • Figure 62: Middle East and Africa Market Value Share and BPS Analysis by Country, 2025 and 2035
  • Figure 63: Middle East and Africa Market Value Share and BPS Analysis by Type, 2025 and 2035
  • Figure 64: Middle East and Africa Market Y-o-Y Growth Comparison by Type, 2025 to 2035
  • Figure 65: Middle East and Africa Market Attractiveness Analysis by Type
  • Figure 66: Middle East and Africa Market Value Share and BPS Analysis by End Use, 2025 and 2035
  • Figure 67: Middle East and Africa Market Y-o-Y Growth Comparison by End Use, 2025 to 2035
  • Figure 68: Middle East and Africa Market Attractiveness Analysis by End Use
  • Figure 69: Global Market - Tier Structure Analysis
  • Figure 70: Global Market - Company Share Analysis

Frequently Asked Questions

What is the projected size of the steel industry by 2035?

The market is expected to reach USD 3,371.7 billion by 2035.

What is the expected CAGR of the steel market from 2025 to 2035?

The market is projected to grow at a CAGR of 4.4% during this period.

Which steel type holds the highest share in the steel market in 2025?

Carbon steel is expected to lead with a 42.3% market share in 2025.

What is the projected share of the building and construction segment in the end-use category by 2025?

Building and construction is expected to hold a 38.5% share of the market in 2025.

Which country is projected to grow fastest in the steel market?

Germany is anticipated to be the fastest-growing market with a CAGR of 4.5% through 2035.

Explore Similar Insights

Future Market Insights

Steel Market