Reports

- Global Locations -

Headquarters

Future Market Insights, Inc.

Christiana Corporate, 200
Continental Drive, Suite 401,
Newark, Delaware - 19713,
United States

T: +1-347-918-3531

Americas

Future Market Insights, Inc.

616 Corporate Way, Suite 2-9018,
Valley Cottage, NY 10989, United States

MEA

Future Market Insights

1602-6 Jumeirah Bay X2 Tower, Plot No: JLT-PH2-X2A,
Jumeirah Lakes Towers, Dubai,
United Arab Emirates

Europe

Future Market Insights

3rd Floor, 207 Regent Street,
W1B 3HH London
United Kingdom

T: + 44 (0) 20 8123 9659

Asia Pacific

Future Market Insights

IndiaLand Global Tech Park, Unit UG-1, Behind Grand HighStreet, Phase 1, Hinjawadi, MH, Pune – 411057, India

Steel Sections Market Outlook (2023 to 2033)

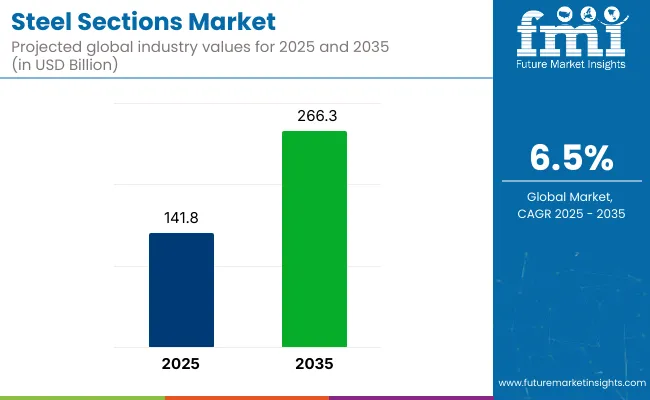
As per the detailed report on the Steel Sections market by Future Market Insights, global sales of Steel Sections reached US$ 85.5 billion in 2018. Y-o-Y market growth was recorded at 5.2% in 2022 with revenue expected to reach US$ 111.6 billion in 2023. The Global Steel Sections market is projected to reach US$ 209.5 billion by end of 2033 representing 6.5% CAGR between 2023 to 2033.

Steel sections are essential components in construction and infrastructure projects due to their strength, durability, and versatility. They provide structural and vibration control strength, support heavy loads, and enable innovative designs, making them best for building safe and resilient.

Other Drivers Propelling the Demand for Steel Sections include:

  • The demand for steel sections is driven by their exceptional strength and durability. Steel is known for its high tensile strength, allowing it to withstand heavy loads and harsh environmental conditions.
  • the structural efficiency that steel sections offer. These sections can bear substantial loads while minimizing the overall weight of the structure. This efficiency translates into cost savings in construction projects by reducing the required amount of material and enabling more innovative and lightweight designs.
  • Steel sections are highly versatile, making them suitable for a wide range of applications. They can be fabricated into various shapes and sizes, catering to specific project requirements. This versatility allows their use in diverse applications, including beams and columns in buildings, trusses in bridges, and other infrastructure projects.
  • The increasing focus on sustainability also contributes to the demand for steel sections. Steel is highly recyclable, and the use of recycled steel in the production of steel sections helps reduce energy consumption and greenhouse gas emissions. Additionally, steel structures can be disassembled and reused, promoting sustainable practices in construction and infrastructure development

Challenges for Companies/Manufacturers in the Steel Sections Market:

  • The steel sections market is highly competitive, with numerous manufacturers trying for market share. Companies face the challenge of differentiating themselves from competitors by offering unique value propositions, such as superior product quality, innovative designs, or exceptional customer service. Building and maintaining a strong brand reputation is crucial to thrive in this competitive landscape.
  • Recent slowdown due to banking recession may hamper the growth of infrastructural and business loans loans worldwide.
  • Steel is a key raw material for manufacturing steel sections, and its price volatility poses a significant challenge for companies. Fluctuations in steel prices can impact production costs and profitability. Manufacturers need to closely monitor and manage raw material costs, considering hedging strategies, long-term supplier relationships, and efficient inventory management to mitigate the impact of price fluctuations.
  • With rapid technological growth, companies in the steel sections market need to stay up-to-date with the latest manufacturing technologies and processes. Investing in modern machinery, automation, and digitalization can enhance efficiency, precision, and productivity. However, keeping pace with evolving technologies and implementing them effectively requires substantial investments and continuous training of the workforce.

Opportunities in the Steel Sections Market:

  • The increasing focus on infrastructure development globally presents a significant opportunity for companies in the steel sections market. Governments and private sector entities are investing in large-scale infrastructure projects, such as transportation networks, bridges, and commercial buildings. This demand for robust and durable steel sections for construction purposes creates a favorable market environment for manufacturers.
  • The growing emphasis on sustainability creates opportunities for companies to develop eco-friendly steel sections and sustainable practices. Investing in energy-efficient manufacturing processes, using recycled steel, and adopting environmentally friendly coatings and finishes can attract environmentally conscious customers. Meeting sustainability requirements and obtaining green certifications can open doors to new market segments and enhance brand reputation.
  • The refurbishment and retrofitting of existing structures offer opportunities for companies in the steel sections market. As aging infrastructure requires upgrades, steel sections can be employed for reinforcing existing buildings and enhancing their structural integrity. This includes strengthening columns, beams, and foundations, as well as incorporating steel sections in seismic retrofitting projects.

Latest Trends in the Steel Sections Market:

  • Manufacturers are adopting eco-friendly production processes, such as using recycled steel, reducing energy consumption, and implementing waste management strategies. This trend allows companies to differentiate themselves as socially conscious and environmentally friendly.
  • These treatments provide corrosion resistance, weather resistance, and improved acidic properties during pickling's. Manufacturers are investing in research and development to offer coatings that prolong the lifespan of steel sections, ensuring longevity and reducing maintenance requirements.
  • The integration of digital technologies and smart manufacturing principles is transforming the steel sections market. IoT-enabled devices, sensors, and data analytics tools are used to monitor and optimize production processes, enabling predictive maintenance, reducing downtime, and enhancing efficiency.
  • Manufacturers are investing in automated machinery and technologies to offer increased design flexibility and customization options.
Attributes Details
Steel Sections Market Size (2023) US$ 111.6 billion
Steel Sections Market Projected Size (2033) US$ 209.5 billion
Value CAGR (2023 to 2033) 6.5%

Don't pay for what you don't need

Customize your report by selecting specific countries or regions and save 30%!

2018 to 2022 Steel Sections Demand Outlook Compared to 2023 to 2033 Forecast

From 2018 to 2022, the global Steel Sections market experienced a CAGR of 5.2%, reaching a market size of US$ 111.6 billion in 2023.

There was an increase in construction and infrastructure development projects worldwide. Governments and private entities invested heavily in building commercial complexes, residential properties, and transportation networks, requiring the use of steel sections for structural purposes. The durability and strength offered by steel sections make them an ideal choice for applications requiring robust and long-lasting materials. The steel section market is expected to continue its growth trajectory, supported by ongoing infrastructure development and the adoption of sustainable construction practices.

Future Forecast for Steel Sections Industry

From 2023 to 2033, the worldwide Steel Sections industry is predicted to grow at a CAGR of 6.5%. The market is anticipated to reach US$ 209.5 billion over the forecast period.

The Steel section industry is expected to experience robust growth from 2023 to 2033, with a projected compound annual growth rate (CAGR) of 6.5%. This growth is anticipated to push the market's value to an estimated US$209.5 billion by the end of 2033. This steady expansion can be attributed to factors such as increased construction activities, infrastructure development, and rising demand for steel in various industries like EV-Automobiles, Automated manufacturing plants, etc.

Nikhil Kaitwade
Nikhil Kaitwade

Principal Consultant

Talk to Analyst

Find your sweet spots for generating winning opportunities in this market.

Comparative View of the Steel Sections Market

Steel Sections Market:

Attributes Steel Sections Market
CAGR (2023 to 2033) 6.5%
Market Value (2033) US$ 209.5 billion
Opportunity Increasing infrastructure projects and construction activities, demand for lightweight and sustainable construction solutions.
Key Trends Sustainable manufacturing practices, technological innovation in design and fabrication, growing customization requirements for complex project designs.

Stainless Steel Market:

Attributes Stainless Steel Market
CAGR (2023 to 2033) 5.5%
Market Value (2033) US$ 193.9 billion
Opportunity Growing demand from industries such as automotive, aerospace, and construction, rising preference for corrosion-resistant materials.
Key Trends Increasing use in architectural applications, advancements in stainless steel grades and surface finishes, adoption of stainless steel in medical and healthcare sectors.

Steel Pipe Market:

Attributes Steel Pipe Market
CAGR (2023 to 2033) 3.9%
Market Value (2033) US$ 149.1 billion
Opportunity Expansion of oil and gas, water and wastewater, and construction industries, growing investments in infrastructure development.
Key Trends Growing demand for seamless pipes in various applications, increasing use of steel pipes in the transportation of fluids and gases, focus on product innovation and cost-efficiency.

Country-Wise Insights

Steel Sections Market to grow in the United States As customer trends towards modification of Vintage cars.

Country The United States
Market Size (US$ billion) by End of Forecast Period (2033) US$ 23.8 billion
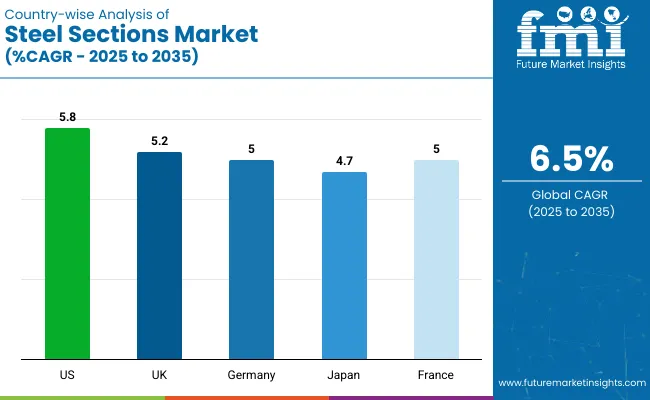
CAGR % 2023 to End of Forecast (2033) 7.7%

The Steel Sections industry in the United States is currently observing a consistent upward trajectory, signifying a favorable growth trend. Based on projections, The industry will achieve a significant market share of approximately US$ 23.8 billion by the year 2033. Based on our meticulous analysis, the industry shall undergo a compound annual growth rate (CAGR) of 7.7% throughout the projected period. There has been a notable increase in both commercial and residential construction, accompanied by a surge in the manufacturing sectors' need for steel.

Notable Growth Expected in China's Steel Sections Market as increase in Motorsport event.

Country China
Market Size (US$ billion) by End of Forecast Period (2033) US$ 102.4 billion
CAGR % 2023 to End of Forecast (2033) 6.6%

The Steel Sections industry in China is projected to experience significant growth, with an estimated market share of US$ 102.4 billion. Based on the projected compound annual growth rate (CAGR) of 6.6% throughout the projected timeframe, This sector has the potential for consistent and gradual expansion. The growth is driven by the implementation of robust infrastructure, an expanding construction domain, and increasing interest from multiple sectors. The increasing need for steel sections in China is a direct consequence of the country's swift urbanisation and industrialization, which are key variables driving the industry's upward trajectory. The implementation of governmental initiatives aimed at encouraging sustainable construction methodologies and the allocation of resources towards improving of manufacturing technologies have the potential to provide a substantial boost to the expansion of the Steel Sections sector within the Chinese market.

Underground racing to boost Steel Sections Market in Japan

Country Japan
Market Size (US$ billion) by End of Forecast Period (2033) US$ 13.6 billion
CAGR % 2023 to End of Forecast (2033) 7.2%

The Steel Sections industry in Japan is projected to achieve a market share of US$ 13.6 billion by 2033, displaying steady growth with a compound annual growth rate (CAGR) of 6.6%. Recent examples exemplify this upward trend. The industry's expansion can be attributed to factors such as ongoing infrastructure development projects, a strong emphasis on earthquake-resistant structures, and the demand for steel sections in automotive and manufacturing sectors. Additionally, Japan's focus on technological innovations, research, and development efforts in the steel industry contribute to the sector's growth. These factors collectively position Japan's Steel Sections industry for a positive outlook in the coming years.

Get the data you need at a Fraction of the cost

Personalize your report by choosing insights you need
and save 40%!

Category-Wise Insights

How Hot rolled steel sections are playing important role in the Steel Sections Industry.

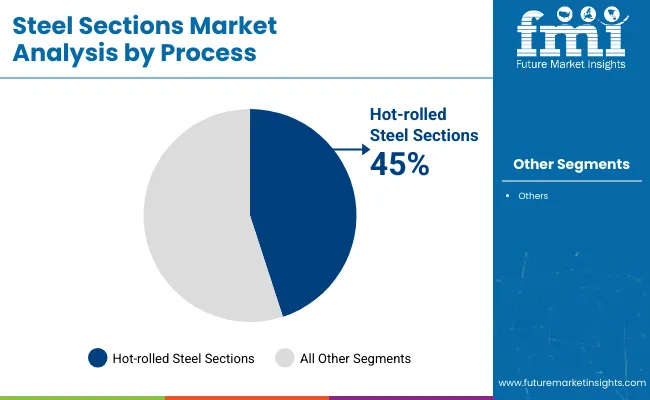
By Process, Hot rolled steel sections segment is expected to dominate the Steel Sections industry with a CAGR of 6.7% from 2023 to 2033. This segment captures a significant market share in 2023 due to its wide range of applications, including structural components in construction, infrastructure projects, and manufacturing.

As the Performance Exhaust systems are designed with larger diameter pipes and less restrictive mufflers, allowing for greater exhaust flow, consumers will focus to upgrade their vehicles. Upgrading to a performance exhaust system is a popular and effective technique to increase horsepower and torque, improve throttle response and improve a high-performance vehicle's overall driving experience.

Type, I-Beam steel section segment is dominating the Steel Sections Industry with market share of 34.2% through 2033

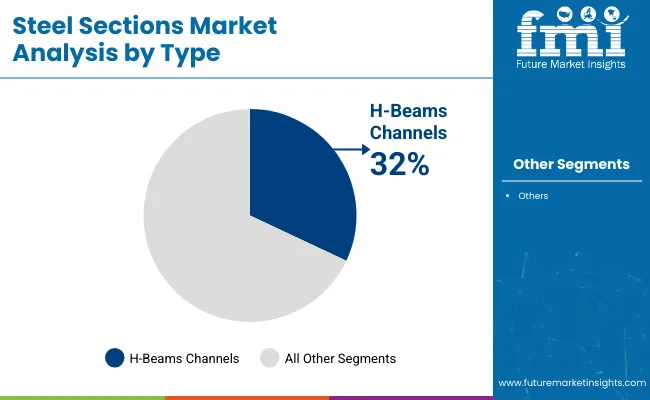
The I-Beam segment holds a dominant position in the Steel Sections industry, capturing an impressive market share of 34.2% from 2022 to 2033. This segment's prominence can be attributed to its versatile and sturdy structural design, making it suitable for a wide range of applications. I-Beams are known for their excellent load-bearing capacity, which is crucial in construction, infrastructure, and industrial projects. Their efficient and reliable performance has solidified the I-Beam segment as the preferred choice for architects, engineers, and builders, leading to its significant market share in the Steel Sections industry during the forecast period.

How Key Players Stay Competitive in the Steel Sections Industry?

Key players in the Steel Sections industry employ several strategies to stay competitive in the market. They focus on continuous innovation, investing in research and development to enhance the quality, durability, and efficiency of their steel sections. This allows them to offer advanced products that meet evolving customer demands. They maintain strong relationships with suppliers to ensure a consistent supply of high-quality raw materials. Players prioritize customer satisfaction by providing customized solutions, timely delivery, and excellent after-sales support. They also emphasize sustainability by adopting eco-friendly production processes and reducing their environmental footprint. They keep a close eye on market trends, industry developments, and emerging technologies to stay ahead of the competition and adapt to changing market dynamics.

Key Strategies Adopted by the Players

  • Product Innovation

Companies invest heavily in Research and development to deliver novel products that improve efficiency, dependability, and cost-effectiveness. Product innovation allows businesses to differentiate themselves from their competition while also catering to the changing demands of their clients.

  • Strategic Partnerships and Collaborations

Key firms in the sector frequently develop strategic partnerships and collaborations with other companies in order to harness their strengths and increase their market reach. Such alliances can allow businesses to obtain access to new technology and markets.

  • Expansion into Emerging Markets

The Steel Sections sector is expanding rapidly in emerging regions such as China and India. Key companies are increasing their presence in these markets by developing local manufacturing facilities and enhancing their distribution networks.

  • Mergers and Acquisitions

Mergers and acquisitions are frequently used by key players in the Steel Sections business to consolidate their market position, expand their product portfolio and gain access to new markets.

Key Players in the Steel Sections Industry

  • ArcelorMittal
  • Nippon Steel Corporation
  • POSCO
  • Tata Steel
  • Baosteel Group
  • JFE Steel Corporation
  • Thyssenkrupp AG
  • Nucor Corporation
  • SSAB AB
  • United States Steel Corporation
  • SAIL (Steel Authority of India Limited)
  • Emirates Steel
  • Evraz Group
  • Severstal
  • Gerdau S.A.
  • Celsa Group
  • Salzgitter AG
  • Hyundai Steel
  • Voestalpine AG
  • Hebei Iron and Steel Group

Key Developments in the Steel Sections Market:

  • The steel companies like SAIL, Tata Steel, JSW Steel and Essar Steel have accomplished some significant work in the area of raw material beneficiation, agglomeration and product development. However, the major focus of work in these companies generally relates to incremental technology development to address the present and short term needs of various production units.
  • In fact, barring some commendable product development efforts, their contributions towards disruptive technology development have not been noteworthy. The actual investment on R&D by the large steel companies in India varies from company to company in the range of 0.07-0.58% of their sales turnover

Segmentation Analysis of the Steel Sections Market

By Process:

  • Hot-rolled steel sections,
  • Cold-formed steel sections,
  • Welded steel sections,
  • Seamless steel sections

By Type:

  • I-beams Channel,
  • H-beams Channels,
  • Angles Hollow sections

By End Use:

  • Residential buildings,
  • Commercial buildings,
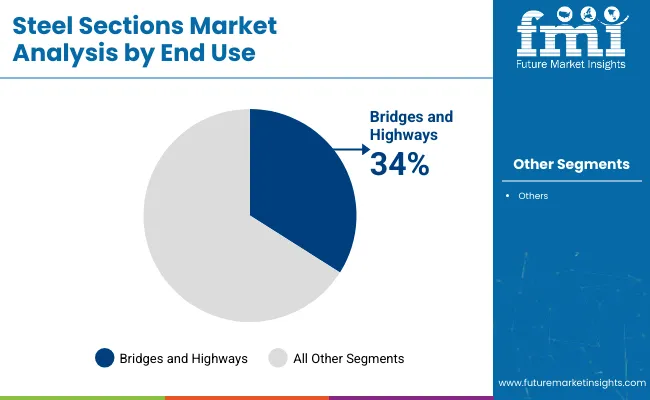
  • Bridges and highways,
  • Industrial plants,
  • Oil and gas refineries

By Region:

  • North America
  • Latin America
  • Eastern Europe
  • Western Europe
  • East Asia
  • South Asia & Pacific
  • The Middle East & Africa

Frequently Asked Questions

How Big will be the Market by 2033?

This market is estimated to reach US$ 209.5 billion by 2033.

Which Countries Dominate the Global Market?

The United States, China, and Japan dominate the global market.

What is the Key Opportunity faced by the Market?

Infrastructural growth fuels construction opportunities.

Which is the Top Trend in this Market?

Technological innovation in design and fabrication is the top trend in the market.

What Leads to Growth in Germany’s Market?

Adopted version of control software solutions and services boosts Germany’s market.

Table of Content

1. Executive Summary

    1.1. Global Market Outlook

    1.2. Demand Side Trends

    1.3. Supply Side Trends

    1.4. Technology Roadmap

    1.5. Analysis and Recommendations

2. Market Overview

    2.1. Market Coverage / Taxonomy

    2.2. Market Definition / Scope / Limitations

3. Key Market Trends

    3.1. Key Trends Impacting the Market

    3.2. Product Innovation / Development Trends

4. Key Success Factors

    4.1. Product Adoption / Usage Analysis

    4.2. Product USPs / Features

    4.3. Strategic Promotional Strategies

5. Global Market Demand Analysis 2018 to 2022 and Forecast, 2023 to 2033

    5.1. Historical Market Volume (Tons) Analysis, 2018 to 2022

    5.2. Current and Future Market Volume (Units) Projections, 2023 to 2033

    5.3. Y-o-Y Growth Trend Analysis

6. Global Market - Pricing Analysis

    6.1. Regional Pricing Analysis By Process

    6.2. Global Average Pricing Analysis Benchmark

7. Global Market Demand (in Value or Size in US$ Million) Analysis 2018 to 2022 and Forecast, 2023 to 2033

    7.1. Historical Market Value (US$ Million) Analysis, 2018 to 2022

    7.2. Current and Future Market Value (US$ Million) Projections, 2023 to 2033

        7.2.1. Y-o-Y Growth Trend Analysis

        7.2.2. Absolute $ Opportunity Analysis

8. Market Background

    8.1. Macro-Economic Factors

        8.1.1. Global GDP Growth Outlook

        8.1.2. Global Manufacturing industry Overview

        8.1.3. Manufacturing Value-Added

        8.1.4. Industry Value Added

        8.1.5. Parent Market Outlook

        8.1.6. Other Macro-Economic Factors

    8.2. Forecast Factors - Relevance & Impact

        8.2.1. Top Companies Historical Growth

        8.2.2. GDP Growth forecast

        8.2.3. Manufacturing Industry forecast

        8.2.4. Global Urbanization Growth Outlook

        8.2.5. Business Climate

        8.2.6. Covid-19 Impact Assessment

        8.2.7. End-use Industry Growth Outlook

    8.3. Value Chain

        8.3.1. Product Manufacturers

        8.3.2. End Users

        8.3.3. Avg. Profitability Margins

    8.4. COVID-19 Crisis – Impact Assessment

        8.4.1. Current Statistics

        8.4.2. Short-Mid-Long Term Outlook

        8.4.3. Likely Rebound

    8.5. Market Dynamics

        8.5.1. Drivers

        8.5.2. Restraints

        8.5.3. Opportunity Analysis

    8.6. Parent Analysis

    8.7. PESTLE Analysis

9. Global Market Analysis 2018 to 2022 and Forecast 2023 to 2033, By Process 

    9.1. Introduction / Key Findings

    9.2. Historical Market Size (US$ Million) and Volume Analysis By Process, 2018 to 2022

    9.3. Current and Future Market Size (US$ Million) and Volume Analysis and Forecast By Process, 2023 to 2033

        9.3.1. Hot-rolled Steel Sections

        9.3.2. Cold-formed Steel Section

        9.3.3. Welded Steel section

        9.3.4. Seamless Steel Section

    9.4. Market Attractiveness Analysis By Process

10. Global Market Analysis 2018 to 2022 and Forecast 2023 to 2033, By Type

    10.1. Introduction / Key Findings

    10.2. Historical Market Size (US$ Million) and Volume Analysis By Type, 2018 to 2022

    10.3. Current and Future Market Size (US$ Million) and Volume Analysis and Forecast By Type, 2023 to 2033

        10.3.1. I-beams Channels

        10.3.2. H-beams Channels

        10.3.3. Angles Hollow Sections

    10.4. Market Attractiveness Analysis By Type

11. Global Market Analysis 2018 to 2022 and Forecast 2023 to 2033, By End Use

    11.1. Introduction / Key Findings

    11.2. Historical Market Size (US$ Million) and Volume Analysis By End Use, 2018 to 2022

    11.3. Current and Future Market Size (US$ Million) and Volume Analysis and Forecast By End Use, 2023 to 2033

        11.3.1. Residential buildings

        11.3.2. Commercial Buildings

        11.3.3. Bridges and Highways

        11.3.4. Industrial Plants

        11.3.5. Oil and gas refineries

    11.4. Market Attractiveness Analysis By End Use

12. Global Market Analysis 2018 to 2022 and Forecast 2023 to 2033, by Region

    12.1. Introduction

    12.2. Historical Market Size (US$ Million) and Volume Analysis By Region, 2018 to 2022

    12.3. Current Market Size (US$ Million) and Volume Analysis and Forecast By Region, 2023 to 2033

        12.3.1. North America

        12.3.2. Latin America

        12.3.3. Western Europe

        12.3.4. Eastern Europe

        12.3.5. Central Asia

        12.3.6. Russia & Belarus

        12.3.7. Balkan & Baltic Countries

        12.3.8. Middle East and Africa (MEA)

        12.3.9. East Asia

        12.3.10. South Asia and Pacific

    12.4. Market Attractiveness Analysis By Region

13. North America Market Analysis 2018 to 2022 and Forecast 2023 to 2033

    13.1. Introduction

    13.2. Pricing Analysis

    13.3. Historical Market Size (US$ Million) and Volume Trend Analysis By Market Taxonomy, 2018 to 2022

    13.4. Market Size (US$ Million) and Volume Forecast By Market Taxonomy, 2023 to 2033

        13.4.1. By Country

            13.4.1.1. U.S.

            13.4.1.2. Canada

        13.4.2. By Process

        13.4.3. By Type

        13.4.4. By End Use

    13.5. Market Attractiveness Analysis

        13.5.1. By Country

        13.5.2. By Process

        13.5.3. By Type

        13.5.4. By End Use

    13.6. Market Trends

    13.7. Key Market Participants - Intensity Mapping

    13.8. Drivers and Restraints - Impact Analysis

14. Latin America Market Analysis 2018 to 2022 and Forecast 2023 to 2033

    14.1. Introduction

    14.2. Pricing Analysis

    14.3. Historical Market Size (US$ Million) and Volume Trend Analysis By Market Taxonomy, 2018 to 2022

    14.4. Market Size (US$ Million) and Volume Forecast By Market Taxonomy, 2023 to 2033

        14.4.1. By Country

            14.4.1.1. Brazil

            14.4.1.2. Mexico

            14.4.1.3. Argentina

            14.4.1.4. Rest of Latin America

        14.4.2. By Process

        14.4.3. By Type

        14.4.4. By End Use

    14.5. Market Attractiveness Analysis

        14.5.1. By Country

        14.5.2. By Process

        14.5.3. By Type

        14.5.4. By End Use

    14.6. Market Trends

    14.7. Key Market Participants - Intensity Mapping

    14.8. Drivers and Restraints - Impact Analysis

15. Western Europe Market Analysis 2018 to 2022 and Forecast 2023 to 2033

    15.1. Introduction

    15.2. Pricing Analysis

    15.3. Historical Market Size (US$ Million) and Volume Trend Analysis By Market Taxonomy, 2018 to 2022

    15.4. Market Size (US$ Million) and Volume Forecast By Market Taxonomy, 2023 to 2033

        15.4.1. By Country

            15.4.1.1. Germany

            15.4.1.2. Italy

            15.4.1.3. France

            15.4.1.4. U.K.

            15.4.1.5. Spain

            15.4.1.6. BENELUX

            15.4.1.7. NORDICS

            15.4.1.8. Rest of Western Europe

        15.4.2. By Process

        15.4.3. By Type

        15.4.4. By End Use

    15.5. Market Attractiveness Analysis

        15.5.1. By Country

        15.5.2. By Process

        15.5.3. By Type

        15.5.4. By End Use

    15.6. Market Trends

    15.7. Key Market Participants - Intensity Mapping

    15.8. Drivers and Restraints - Impact Analysis

16. Eastern Europe Market Analysis 2018 to 2022 and Forecast 2023 to 2033

    16.1. Introduction

    16.2. Pricing Analysis

    16.3. Historical Market Size (US$ Million) and Volume Trend Analysis By Market Taxonomy, 2018 to 2022

    16.4. Market Size (US$ Million) and Volume Forecast By Market Taxonomy, 2023 to 2033

        16.4.1. By Country

            16.4.1.1. Poland

            16.4.1.2. Hungary

            16.4.1.3. Romania

            16.4.1.4. Czech Republic

            16.4.1.5. Rest of Eastern Europe

        16.4.2. By Process

        16.4.3. By Type

        16.4.4. By End Use

    16.5. Market Attractiveness Analysis

        16.5.1. By Country

        16.5.2. By Process

        16.5.3. By Type

        16.5.4. By End Use

    16.6. Market Trends

    16.7. Key Market Participants - Intensity Mapping

    16.8. Drivers and Restraints - Impact Analysis

17. Central Asia Market Analysis 2018 to 2022 and Forecast 2023 to 2033

    17.1. Introduction

    17.2. Pricing Analysis

    17.3. Historical Market Size (US$ Million) and Volume Trend Analysis By Market Taxonomy, 2018 to 2022

    17.4. Market Size (US$ Million) and Volume Forecast By Market Taxonomy, 2023 to 2033

        17.4.1. By Process

        17.4.2. By Type

        17.4.3. By End Use

    17.5. Market Attractiveness Analysis

        17.5.1. By Process

        17.5.2. By Type

        17.5.3. By End Use

    17.6. Market Trends

    17.7. Key Market Participants - Intensity Mapping

    17.8. Drivers and Restraints - Impact Analysis

18. Russia & Belarus Market Analysis 2018 to 2022 and Forecast 2023 to 2033

    18.1. Introduction

    18.2. Pricing Analysis

    18.3. Historical Market Size (US$ Million) and Volume Trend Analysis By Market Taxonomy, 2018 to 2022

    18.4. Market Size (US$ Million) and Volume Forecast By Market Taxonomy, 2023 to 2033

        18.4.1. By Process

        18.4.2. By Type

        18.4.3. By End Use

    18.5. Market Attractiveness Analysis

        18.5.1. By Process

        18.5.2. By Type

        18.5.3. By End Use

    18.6. Market Trends

    18.7. Key Market Participants - Intensity Mapping

    18.8. Drivers and Restraints - Impact Analysis

19. Balkan & Baltic Countries Market Analysis 2018 to 2022 and Forecast 2023 to 2033

    19.1. Introduction

    19.2. Pricing Analysis

    19.3. Historical Market Size (US$ Million) and Volume Trend Analysis By Market Taxonomy, 2018 to 2022

    19.4. Market Size (US$ Million) and Volume Forecast By Market Taxonomy, 2023 to 2033

        19.4.1. By Process

        19.4.2. By Type

        19.4.3. By End Use

    19.5. Market Attractiveness Analysis

        19.5.1. By Process

        19.5.2. By Type

        19.5.3. By End Use

    19.6. Market Trends

    19.7. Key Market Participants - Intensity Mapping

    19.8. Drivers and Restraints - Impact Analysis

20. South Asia and Pacific Market Analysis 2018 to 2022 and Forecast 2023 to 2033

    20.1. Introduction

    20.2. Pricing Analysis

    20.3. Historical Market Size (US$ Million) and Volume Trend Analysis By Market Taxonomy, 2018 to 2022

    20.4. Market Size (US$ Million) and Volume Forecast By Market Taxonomy, 2023 to 2033

        20.4.1. By Country

            20.4.1.1. India

            20.4.1.2. ASEAN

            20.4.1.3. Oceania

            20.4.1.4. Rest of South Asia & Pacific

        20.4.2. By Process

        20.4.3. By Type

        20.4.4. By End Use

    20.5. Market Attractiveness Analysis

        20.5.1. By Country

        20.5.2. By Process

        20.5.3. By Type

        20.5.4. By End Use

    20.6. Market Trends

    20.7. Key Market Participants - Intensity Mapping

    20.8. Drivers and Restraints - Impact Analysis

21. East Asia Market Analysis 2018 to 2022 and Forecast 2023 to 2033

    21.1. Introduction

    21.2. Pricing Analysis

    21.3. Historical Market Size (US$ Million) and Volume Trend Analysis By Market Taxonomy, 2018 to 2022

    21.4. Market Size (US$ Million) and Volume Forecast By Market Taxonomy, 2023 to 2033

        21.4.1. By Country

            21.4.1.1. China

            21.4.1.2. Japan

            21.4.1.3. South Korea

        21.4.2. By Process

        21.4.3. By Type

        21.4.4. By End Use

    21.5. Market Attractiveness Analysis

        21.5.1. By Country

        21.5.2. By Process

        21.5.3. By Type

        21.5.4. By End Use

    21.6. Market Trends

    21.7. Key Market Participants - Intensity Mapping

    21.8. Drivers and Restraints - Impact Analysis

22. Middle East and Africa Market Analysis 2018 to 2022 and Forecast 2023 to 2033

    22.1. Introduction

    22.2. Pricing Analysis

    22.3. Historical Market Size (US$ Million) and Volume Trend Analysis By Market Taxonomy, 2018 to 2022

    22.4. Market Size (US$ Million) and Volume Forecast By Market Taxonomy, 2023 to 2033

        22.4.1. By Country

            22.4.1.1. GCC Countries

            22.4.1.2. Türkiye

            22.4.1.3. Northern Africa

            22.4.1.4. South Africa

            22.4.1.5. Rest of Middle East and Africa

        22.4.2. By Process

        22.4.3. By Type

        22.4.4. By End Use

    22.5. Market Attractiveness Analysis

        22.5.1. By Country

        22.5.2. By Process

        22.5.3. By Type

        22.5.4. By End Use

    22.6. Market Trends

    22.7. Key Market Participants - Intensity Mapping

    22.8. Drivers and Restraints - Impact Analysis

23. Country-wise Market Analysis 

    23.1. Introduction

        23.1.1. Market Value Proportion Analysis, By Key Countries

        23.1.2. Global Vs. Country Growth Comparison

    23.2. U.S. Market Analysis

        23.2.1. By Process

        23.2.2. By Type

        23.2.3. By End Use

    23.3. Canada Market Analysis

        23.3.1. By Process

        23.3.2. By Type

        23.3.3. By End Use

    23.4. Mexico Market Analysis

        23.4.1. By Process

        23.4.2. By Type

        23.4.3. By End Use

    23.5. Brazil Market Analysis

        23.5.1. By Process

        23.5.2. By Type

        23.5.3. By End Use

    23.6. Argentina Market Analysis

        23.6.1. By Process

        23.6.2. By Type

        23.6.3. By End Use

    23.7. Germany Market Analysis

        23.7.1. By Process

        23.7.2. By Type

        23.7.3. By End Use

    23.8. Italy Market Analysis

        23.8.1. By Process

        23.8.2. By Type

        23.8.3. By End Use

    23.9. France Market Analysis

        23.9.1. By Process

        23.9.2. By Type

        23.9.3. By End Use

    23.10. U.K. Market Analysis

        23.10.1. By Process

        23.10.2. By Type

        23.10.3. By End Use

    23.11. Spain Market Analysis

        23.11.1. By Process

        23.11.2. By Type

        23.11.3. By End Use

    23.12. NORDICS Market Analysis

        23.12.1. By Process

        23.12.2. By Type

        23.12.3. By End Use

    23.13. Poland Market Analysis

        23.13.1. By Process

        23.13.2. By Type

        23.13.3. By End Use

    23.14. Hungary Market Analysis

        23.14.1. By Process

        23.14.2. By Type

        23.14.3. By End Use

    23.15. Romania Market Analysis

        23.15.1. By Process

        23.15.2. By Type

        23.15.3. By End Use

    23.16. Czech Republic Market Analysis

        23.16.1. By Process

        23.16.2. By Type

        23.16.3. By End Use

    23.17. China Market Analysis

        23.17.1. By Process

        23.17.2. By Type

        23.17.3. By End Use

    23.18. Japan Market Analysis

        23.18.1. By Process

        23.18.2. By Type

        23.18.3. By End Use

    23.19. S. Korea Market Analysis

        23.19.1. By Process

        23.19.2. By Type

        23.19.3. By End Use

    23.20. India Market Analysis

        23.20.1. By Process

        23.20.2. By Type

        23.20.3. By End Use

    23.21. ASEAN Market Analysis

        23.21.1. By Process

        23.21.2. By Type

        23.21.3. By End Use

    23.22. Australia and New Zealand Market Analysis

        23.22.1. By Process

        23.22.2. By Type

        23.22.3. By End Use

    23.23. KSA Market Analysis

        23.23.1. By Process

        23.23.2. By Type

        23.23.3. By End Use

    23.24. UAE Market Analysis

        23.24.1. By Process

        23.24.2. By Type

        23.24.3. By End Use

    23.25. Northern Africa Market Analysis

        23.25.1. By Process

        23.25.2. By Type

        23.25.3. By End Use

    23.26. Türkiye Market Analysis

        23.26.1. By Process

        23.26.2. By Type

        23.26.3. By End Use

    23.27. South Africa Market Analysis

        23.27.1. By Process

        23.27.2. By Type

        23.27.3. By End Use

    23.28. Israel Market Analysis

        23.28.1. By Process

        23.28.2. By Type

        23.28.3. By End Use

24. Market Structure Analysis

    24.1. Market Analysis by Tier of Companies (Steel Sections)

    24.2. Market Concentration

    24.3. Market Share Analysis of Top Players

    24.4. Production Capacity Analysis

    24.5. Market Presence Analysis

        24.5.1. By End Use Footprint of Players

        24.5.2. By Regional Footprint of Players

        24.5.3. By Channel Footprint of Players

25. Competition Analysis

    25.1. Competition Dashboard

    25.2. Competition Benchmarking

    25.3. Competition Deep Dive

        25.3.1. ArcelorMittal

            25.3.1.1. Overview

            25.3.1.2. Product Portfolio

            25.3.1.3. Profitability by Market Segments (Product/Channel/Region)

            25.3.1.4. Sales Footprint

            25.3.1.5. Strategy Overview

        25.3.2. Nippon Steel Corporation

            25.3.2.1. Overview

            25.3.2.2. Product Portfolio

            25.3.2.3. Profitability by Market Segments (Product/Channel/Region)

            25.3.2.4. Sales Footprint

            25.3.2.5. Strategy Overview

        25.3.3. POSCO

            25.3.3.1. Overview

            25.3.3.2. Product Portfolio

            25.3.3.3. Profitability by Market Segments (Product/Channel/Region)

            25.3.3.4. Sales Footprint

            25.3.3.5. Strategy Overview

        25.3.4. Tata Steel

            25.3.4.1. Overview

            25.3.4.2. Product Portfolio

            25.3.4.3. Profitability by Market Segments (Product/Channel/Region)

            25.3.4.4. Sales Footprint

            25.3.4.5. Strategy Overview

        25.3.5. Baosteel Group

            25.3.5.1. Overview

            25.3.5.2. Product Portfolio

            25.3.5.3. Profitability by Market Segments (Product/Channel/Region)

            25.3.5.4. Sales Footprint

            25.3.5.5. Strategy Overview

        25.3.6. JFE Steel Corporation

            25.3.6.1. Overview

            25.3.6.2. Product Portfolio

            25.3.6.3. Profitability by Market Segments (Product/Channel/Region)

            25.3.6.4. Sales Footprint

            25.3.6.5. Strategy Overview

        25.3.7. Thyssenkrupp AG

            25.3.7.1. Overview

            25.3.7.2. Product Portfolio

            25.3.7.3. Profitability by Market Segments (Product/Channel/Region)

            25.3.7.4. Sales Footprint

            25.3.7.5. Strategy Overview

        25.3.8. Nucor Corporation

            25.3.8.1. Overview

            25.3.8.2. Product Portfolio

            25.3.8.3. Profitability by Market Segments (Product/Channel/Region)

            25.3.8.4. Sales Footprint

            25.3.8.5. Strategy Overview

        25.3.9. SSAB AB

            25.3.9.1. Overview

            25.3.9.2. Product Portfolio

            25.3.9.3. Profitability by Market Segments (Product/Channel/Region)

            25.3.9.4. Sales Footprint

            25.3.9.5. Strategy Overview

        25.3.10. United States Steel Corporation

            25.3.10.1. Overview

            25.3.10.2. Product Portfolio

            25.3.10.3. Profitability by Market Segments (Product/Channel/Region)

            25.3.10.4. Sales Footprint

            25.3.10.5. Strategy Overview

        25.3.11. SAIL (Steel Authority of India Limited)

            25.3.11.1. Overview

            25.3.11.2. Product Portfolio

            25.3.11.3. Profitability by Market Segments (Product/Channel/Region)

            25.3.11.4. Sales Footprint

            25.3.11.5. Strategy Overview

        25.3.12. Emirates Steel

            25.3.12.1. Overview

            25.3.12.2. Product Portfolio

            25.3.12.3. Profitability by Market Segments (Product/Channel/Region)

            25.3.12.4. Sales Footprint

            25.3.12.5. Strategy Overview

        25.3.13. Evraz Group

            25.3.13.1. Overview

            25.3.13.2. Product Portfolio

            25.3.13.3. Profitability by Market Segments (Product/Channel/Region)

            25.3.13.4. Sales Footprint

            25.3.13.5. Strategy Overview

        25.3.14. Severstal

            25.3.14.1. Overview

            25.3.14.2. Product Portfolio

            25.3.14.3. Profitability by Market Segments (Product/Channel/Region)

            25.3.14.4. Sales Footprint

            25.3.14.5. Strategy Overview

        25.3.15. Gerdau S.A.

            25.3.15.1. Overview

            25.3.15.2. Product Portfolio

            25.3.15.3. Profitability by Market Segments (Product/Channel/Region)

            25.3.15.4. Sales Footprint

            25.3.15.5. Strategy Overview

        25.3.16. Celsa Group

            25.3.16.1. Overview

            25.3.16.2. Product Portfolio

            25.3.16.3. Profitability by Market Segments (Product/Channel/Region)

            25.3.16.4. Sales Footprint

            25.3.16.5. Strategy Overview

        25.3.17. Salzgitter AG

            25.3.17.1. Overview

            25.3.17.2. Product Portfolio

            25.3.17.3. Profitability by Market Segments (Product/Channel/Region)

            25.3.17.4. Sales Footprint

            25.3.17.5. Strategy Overview

        25.3.18. Hyundai Steel

            25.3.18.1. Overview

            25.3.18.2. Product Portfolio

            25.3.18.3. Profitability by Market Segments (Product/Channel/Region)

            25.3.18.4. Sales Footprint

            25.3.18.5. Strategy Overview

        25.3.19. Voestalpine AG

            25.3.19.1. Overview

            25.3.19.2. Product Portfolio

            25.3.19.3. Profitability by Market Segments (Product/Channel/Region)

            25.3.19.4. Sales Footprint

            25.3.19.5. Strategy Overview

        25.3.20. Hebei Iron and Steel Group

            25.3.20.1. Overview

            25.3.20.2. Product Portfolio

            25.3.20.3. Profitability by Market Segments (Product/Channel/Region)

            25.3.20.4. Sales Footprint

            25.3.20.5. Strategy Overview

26. Assumptions and Acronyms Used

27. Research Methodology

Explore Industrial Automation Insights

View Reports