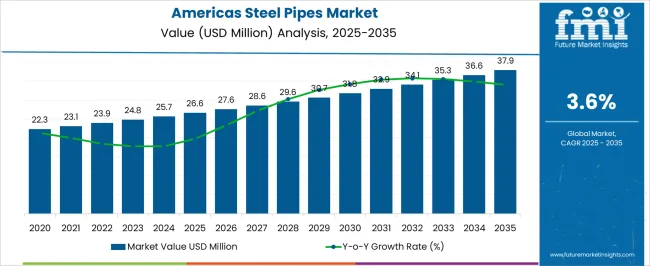
The Americas Steel Pipes Market is estimated to be valued at USD 26.6 million in 2025 and is projected to reach USD 37.9 million by 2035, registering a compound annual growth rate (CAGR) of 3.6% over the forecast period.
| Metric | Value |
|---|---|
| Americas Steel Pipes Market Estimated Value in (2025 E) | USD 26.6 million |
| Americas Steel Pipes Market Forecast Value in (2035 F) | USD 37.9 million |
| Forecast CAGR (2025 to 2035) | 3.6% |
The Americas steel pipes market is expanding steadily, supported by robust demand across construction, energy, and infrastructure sectors. Rising urbanization, coupled with government-led infrastructure projects, is driving consumption of durable and cost-efficient piping solutions.
Increasing oil and gas exploration activities, along with the refurbishment of aging pipeline networks, are further strengthening market adoption. Technological advancements in pipe manufacturing processes, including precision forming and heat treatment, are enhancing product reliability and performance.
Additionally, the rising use of steel pipes in water distribution and sewage management systems underscores their critical role in sustainable urban development. The market outlook remains optimistic as manufacturers continue to prioritize seamless supply chains, improved corrosion resistance technologies, and eco-friendly production practices to meet evolving end-user requirements across the region.
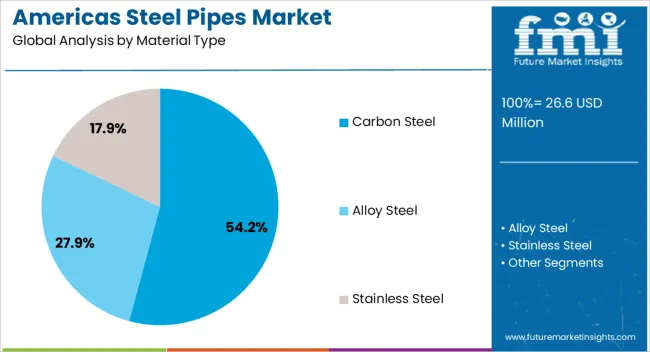
The carbon steel material type segment is projected to account for 54.20% of total revenue by 2025 within the material category, making it the leading segment. This dominance is attributed to its high strength, cost efficiency, and adaptability across a wide range of applications.
Carbon steel pipes are preferred for their durability, machinability, and compatibility with welding processes, making them highly suitable for demanding industries such as oil, gas, and construction. The availability of carbon steel in various grades and sizes has further supported its use in both standard and specialized infrastructure projects.
Continuous improvements in coating technologies have enhanced its corrosion resistance, solidifying its position as the most widely adopted material type.
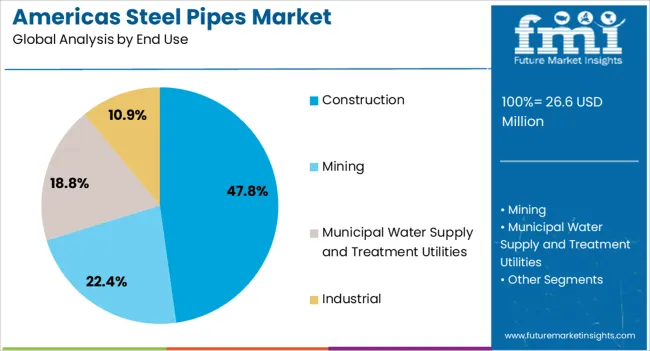
The construction segment is expected to hold 47.80% of total market revenue by 2025 within the end use category, positioning it as the dominant sector. This growth is driven by large-scale infrastructure development, residential and commercial building projects, and investments in transportation networks.
Steel pipes are extensively used for structural purposes, plumbing, and water distribution systems within the construction industry. Their ability to withstand high pressure, provide long service life, and offer cost efficiency makes them indispensable in both residential and industrial applications.
With rising urbanization and government focus on sustainable infrastructure, demand for steel pipes in the construction sector is anticipated to remain consistently strong.
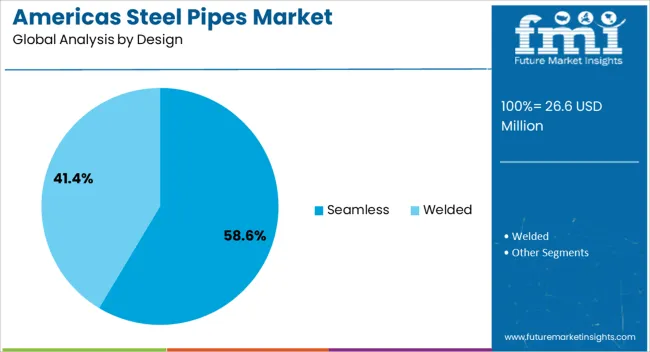
The seamless design segment is anticipated to represent 58.60% of total revenue by 2025 within the design category, making it the leading design type. Its dominance is based on superior mechanical strength, resistance to high pressure, and reliability in critical applications.
Seamless steel pipes are widely used in oil and gas exploration, power generation, and high-pressure fluid transportation, where welded alternatives may not perform as effectively. Their uniform structure and absence of welded joints reduce the risk of leakage and failure, ensuring operational safety.
Continuous innovation in seamless manufacturing techniques has enhanced precision and reduced costs, further encouraging adoption. This combination of performance and reliability has reinforced the segment’s leadership in the Americas steel pipes market.
Sales in global America's steel pipes market are forecasted to increase at a 2.4% CAGR compared to the 3.6% CAGR registered between 2020 and 2025. Despite the rapid urbanization of the world's population, the oil and gas industry has continued to expand.
However, due to reduced demand in the oil and gas industry during the pandemic, steel pipe market growth slowed in 2024. A decline in demand was also seen in the chemical industry.
The global market is expected to continue growing during the forecast period, driven by the increasing demand from the infrastructure, construction, and manufacturing sectors. The market is also expected to benefit from government initiatives to boost economic growth and infrastructure development in the region.
The United States and Canada are expected to remain the dominant markets, while Mexico and Brazil are projected to witness significant growth due to their expanding manufacturing and construction industries. The increasing adoption of advanced technologies, such as automation and digitization, is also expected to create opportunities for the steel pipes market in the region.
| Historical CAGR | 2.4% |
|---|---|
| Historical Market Value (2025) | USD 24 million |
| Forecast CAGR | 3.6% |
Replacement of Aging Pipelines
Steel pipes are popular owing to superior reliability in performance and durability, coupled with a wide range of applications in the automotive, construction, and mining industries. Also, a wide range of steel pipes, particularly for oil and gas logistics, may help long-term projections.
The corrosion issues in carbon steel pipes and the resultant requirements of replacements for ageing pipelines may aid market growth by boosting residential and non-residential applications. Also, further benefits such as hardness, temperature resistance, flexibility, aesthetics, and low maintenance costs may support the market in the long term.
ERW Pipes Gain Prominence
ERW (electric resistance welded) steel pipes have been gaining prominence across America owing to new opportunities in local markets, emphasising infrastructure in urban settings.
Significant investments being made for buses, air travel, rail, telecommunication, and energy, are likely to generate key opportunities for market players.
Manufacturers are focusing on geographical and capacity expansions. Also, the demand for commercial and housing spaces has increased the demand for ERW pipes. Furthermore, favourable policies by governments towards gas and energy distribution may prove beneficial in market developments.
While America’s steel pipes market is projected to grow steadily at a slow rate through 2035, steel pipe manufacturers are expected to face obstacles that may restrain the potential for growth in the long term.
For instance, the high costs of installation associated with steel pipes hinder adoption rates. In addition, America’s steel pipes market may witness strong competition from alternative pipe materials, such as plastic and iron, owing to cost advantages. Steel pipe diameters are limited owing to notable cost increases for large sizes, limiting the scope of application for offerings developed by manufacturers.
Steel pipes are largely manufactured from 3 key materials – carbon steel, alloy steel, and stainless steel. Carbon steel pipes are projected to remain highly sought after in America throughout the projection period, with the carbon steel market likely to grow steadily.
The demand for carbon steel pipes can be attributed to beneficial physical and chemical attributes, including resistance to corrosion shocks, low environmental impact, and minimal need for pre-treatment before use.
Steel pipes can be categorized into seamless and welded variants. Welded steel pipes can be further segregated into ERW and SAW options. Seamless pipes are projected to hold a significant market share of 58.6% throughout the forecast period.
The demand for seamless pipes in the industry can be mainly attributed to high pressure and strength ratings and better uniformity in design, which makes it ideal for heavy-duty applications such as the oil & gas sector and water supply infrastructure, generating lucrative opportunities in the long term.
Using steel pipes in a wide temperature range and for transporting toxic substances, coupled with weldability characteristics, high strength, low corrosion, and high tensile strength, are important for onshore and offshore operations, generating lucrative opportunities for the long term.
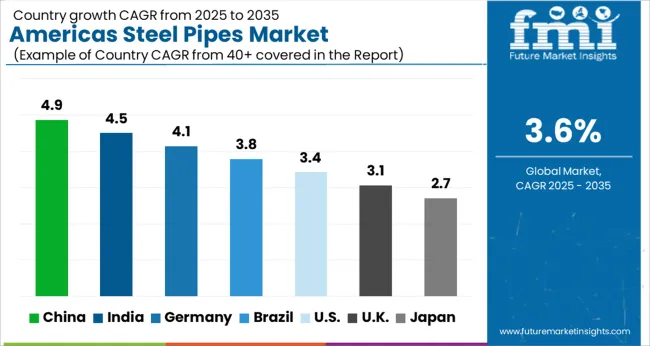
Countries Leading in America’s Steel Pipes Market: Country-wise Analysis
| Regions | North America |
|---|---|
| Countries | United States |
| Market Share | 70.4% |
| CAGR | 3.6% |
| Regions | North America |
|---|---|
| Countries | Canada |
| Market Share | 9.1% |
| CAGR | 2.6% |
| Regions | North America |
|---|---|
| Countries | Mexico |
| Market Share | 7.9% |
| CAGR | 2.2% |
| Regions | South America |
|---|---|
| Countries | Brazil |
| Market Share | 8.7% |
| CAGR | 2.3% |
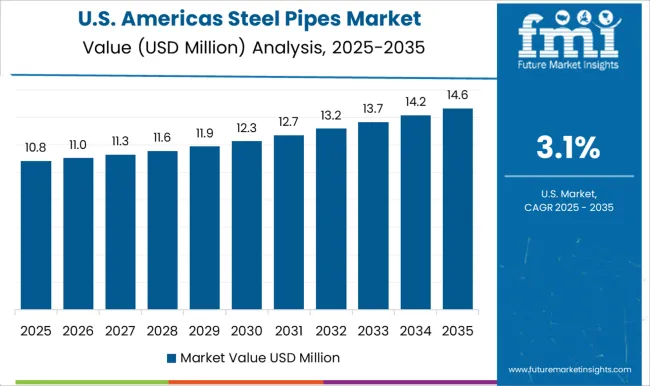
The United States market for steel pipes remains lucrative and is anticipated to account for more than 70.4% of the overall market share. Also, sustained economic growth in the country, supported by fiscal stimulus by the government, and the resultant increase in business confidence have played a key role in the demand for steel pipes in several end-use sectors.
The United States has witnessed a substantial increase in crude oil production, providing market players with lucrative opportunities to leverage for revenue. The United States market has also witnessed significant highs and lows in the past few years, with significant growth between 2025 and 2025 and a key emphasis on applications in the oil and gas sector.
Brazil has been reflecting strong economic activity at a relatively slow pace. Industrial growth in the country and growing consumer prices in the region have been driving the market recently. However, regional economic uncertainties across Latin America have affected steel production.
Brazil has been witnessing a slump in imports, owing to fluctuations in the requirements of finished steel products, while crude steel production remains fairly stable. Moreover, key challenges for market players in Brazil include the continuing trade tensions between China and the United States, tight economic conditions, and reduced commodity prices.
In Latin America, Brazil is the only country that has managed to maintain a surplus of trade in finished steel, accounting for more than 50% of the market share in the region and 8.7% of the total market share.
Favourable government policies in the country may help reduce inflation and aid in a better monetary environment. Also, the industry is likely to reflect growth through the forecast period owing to better business confidence in the industrial and construction sectors through 2025.
The demand for steel pipes in Canada is notable owing to their high value in comparison to many countries in Latin America. However, the country has been facing challenges in terms of significant slumps in the prices in terms of crude oil and the steady decline in demand from the energy industry. A CAGR of 2.6% indicates positive market growth over the forecast period.
Fluctuations in steel prices have challenged market players in terms of sales. The market is likely to reflect a steady but sluggish growth through 2035 due to growing steel prices and a trend of depreciation of the Canadian dollar.
Growth may also be driven by increasing activity in domestic oil and gas drilling and revenue generation from irrigation and water supply applications for residential and commercial infrastructure development.
According to government statistics, the deficit between imports and exports is anticipated to shrink steadily in years to come, with 2025 valuations accounting for almost 1.2 billion and 1.4 billion, respectively, aiding steady growth in the years ahead.
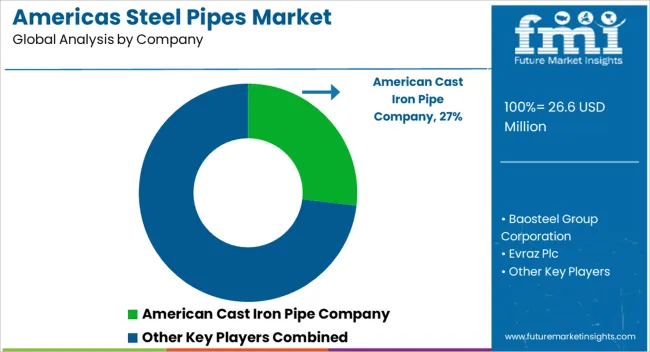
Some of the key players operating in America’s Steel Pipes Market are
Recent Developments
The pandemic has substantially impacted steel pipe manufacturers in the market. Consequently, market players are increasingly investing efforts in optimizing production to match the decline in demand with a reduction in production capacities and workforce gaining importance. Large manufacturers also invest in consolidating their presence during this period through strategic acquisitions.
| Attribute | Details |
|---|---|
| Forecast Period | 2025 to 2035 |
| Historical Data Available for | 2020 to 2025 |
| Market Analysis | USD million for Value and MT for Volume |
| Key Regions Covered | North America; Latin America |
| Key Countries Covered | The United States, Canada, Brazil, Mexico, Chile, Peru, Germany, UNITED KINGDOM, Spain, Italy, France, Russia, Poland, China, India, Japan, Australia, New Zealand, GCC Countries, North Africa, South Africa, and Turkey |
| Key Segments Covered | Material Type, End Use, Design, Region |
| Key Companies Profiled | American Cast Iron Pipe Company; Baosteel Group Corporation; Evraz Plc; Nippon Steel & Sumitomo Metal Corporation; JFE Holdings Corporation; Hyundai Steel Company; TMK Group; United States Steel; Tata Iron and Steel; VALLOUREC; Nucor Corporation; Zekelman Industries |
| Report Coverage | Market Forecast, Company Share Analysis, Competition Intelligence, DROT Analysis, Market Dynamics and Challenges, and Strategic Growth Initiatives |
| Customization & Pricing | Available upon Request |
The global americas steel pipes market is estimated to be valued at USD 26.6 million in 2025.
The market size for the americas steel pipes market is projected to reach USD 37.9 million by 2035.
The americas steel pipes market is expected to grow at a 3.6% CAGR between 2025 and 2035.
The key product types in americas steel pipes market are carbon steel, alloy steel and stainless steel.
In terms of end use, construction segment to command 47.8% share in the americas steel pipes market in 2025.


Our Research Products

The "Full Research Suite" delivers actionable market intel, deep dives on markets or technologies, so clients act faster, cut risk, and unlock growth.

The Leaderboard benchmarks and ranks top vendors, classifying them as Established Leaders, Leading Challengers, or Disruptors & Challengers.

Locates where complements amplify value and substitutes erode it, forecasting net impact by horizon

We deliver granular, decision-grade intel: market sizing, 5-year forecasts, pricing, adoption, usage, revenue, and operational KPIs—plus competitor tracking, regulation, and value chains—across 60 countries broadly.

Spot the shifts before they hit your P&L. We track inflection points, adoption curves, pricing moves, and ecosystem plays to show where demand is heading, why it is changing, and what to do next across high-growth markets and disruptive tech

Real-time reads of user behavior. We track shifting priorities, perceptions of today’s and next-gen services, and provider experience, then pace how fast tech moves from trial to adoption, blending buyer, consumer, and channel inputs with social signals (#WhySwitch, #UX).

Partner with our analyst team to build a custom report designed around your business priorities. From analysing market trends to assessing competitors or crafting bespoke datasets, we tailor insights to your needs.
Supplier Intelligence
Discovery & Profiling
Capacity & Footprint
Performance & Risk
Compliance & Governance
Commercial Readiness
Who Supplies Whom
Scorecards & Shortlists
Playbooks & Docs
Category Intelligence
Definition & Scope
Demand & Use Cases
Cost Drivers
Market Structure
Supply Chain Map
Trade & Policy
Operating Norms
Deliverables
Buyer Intelligence
Account Basics
Spend & Scope
Procurement Model
Vendor Requirements
Terms & Policies
Entry Strategy
Pain Points & Triggers
Outputs
Pricing Analysis
Benchmarks
Trends
Should-Cost
Indexation
Landed Cost
Commercial Terms
Deliverables
Brand Analysis
Positioning & Value Prop
Share & Presence
Customer Evidence
Go-to-Market
Digital & Reputation
Compliance & Trust
KPIs & Gaps
Outputs
Full Research Suite comprises of:
Market outlook & trends analysis
Interviews & case studies
Strategic recommendations
Vendor profiles & capabilities analysis
5-year forecasts
8 regions and 60+ country-level data splits
Market segment data splits
12 months of continuous data updates
DELIVERED AS:
PDF EXCEL ONLINE
Americas Seeds Market Size and Share Forecast Outlook 2025 to 2035
Americas COVID-19 Testing Market - Trends & Forecast 2025 to 2035
Steel Drum Market Size and Share Forecast Outlook 2025 to 2035
Steel Drums & IBCs Market Size and Share Forecast Outlook 2025 to 2035
Steel Roll-on Tube Market Size and Share Forecast Outlook 2025 to 2035
Steel Testing Equipment Market Size and Share Forecast Outlook 2025 to 2035
Steel Salvage Drums Market Size and Share Forecast Outlook 2025 to 2035
Steel Wire Reinforced Polyethylene Pipe Market Size and Share Forecast Outlook 2025 to 2035
Steel Wire Market Size and Share Forecast Outlook 2025 to 2035
Steel Strapping Market Size and Share Forecast Outlook 2025 to 2035
Steel Drum Industry Analysis in Southeast Asia Size and Share Forecast Outlook 2025 to 2035
Steel Studs Market Size and Share Forecast Outlook 2025 to 2035
Steel Rebar Market Size and Share Forecast Outlook 2025 to 2035
Steel Sections Market Analysis - Size, Share, and Forecast Outlook 2025 to 2035
Steel Market Size, Growth, and Forecast 2025 to 2035
Steel Containers Market Analysis by Product Type, Capacity Type, End Use, and Region through 2025 to 2035
Steel Pipe Market Growth - Trends & Forecast 2025 to 2035
Key Players & Market Share in the Steel Containers Industry
Competitive Overview of Steel Drum Market Share
Examining Market Share Trends in Steel Drums and IBCs Industry

Thank you!
You will receive an email from our Business Development Manager. Please be sure to check your SPAM/JUNK folder too.
Chat With
MaRIA