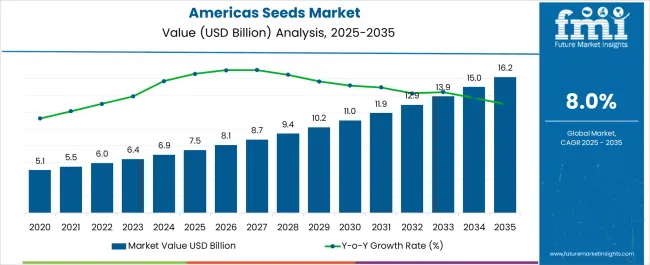
The Americas seeds market is estimated to be valued at USD 7.5 billion in 2025 and is projected to reach USD 16.3 billion by 2035, registering a compound annual growth rate (CAGR) of 8% over the forecast period. The market is projected to add an absolute dollar opportunity of USD 8.8 billion over the forecast period, reflecting a 2.2x growth trajectory.
The market evolution is expected to be driven by increasing adoption of precision agriculture, rising demand for high-yielding crop varieties, and growing focus on climate-resilient seed technologies, particularly in major agricultural regions like Brazil, Argentina, and the United States.
By 2030, the market is likely to reach USD 10.9 billion, accounting for USD 3.4 billion in incremental value over the first half of the decade. The remaining USD 5.4 billion is expected during the second half, suggesting a strongly back-loaded growth pattern with accelerating momentum. The soybean segment's dominance with 83% market share aligns with South America's position as the world's largest soybean producing region, where Brazil and Argentina account for significant global production. GMO seed adoption remains robust at 68.5% market share, supported by favorable regulatory environments and farmer preferences for herbicide-tolerant and insect-resistant traits.
Companies such as Bayer AG and Corteva Agriscience are advancing their competitive positions through substantial investment in biotechnology platforms and scalable breeding systems. Bayer allocated USD 2.5 billion to R&D in 2025, focusing on hybrid and genetically modified seeds tailored for environmental stress tolerance, while Syngenta reinvests 9% of profits into precision breeding technologies and AI-driven germplasm development. Innovation-led procurement models are supporting expansion into climate-resilient crop varieties, precision agriculture applications, and next-generation trait stacking for enhanced pest resistance and herbicide tolerance.
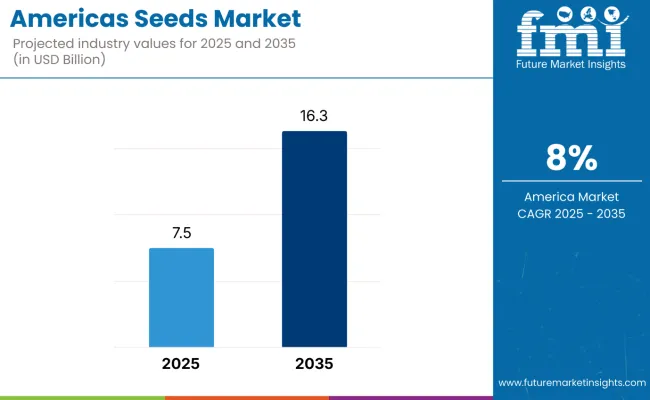
| Metric | Value |
|---|---|
| Estimated Value in (2025E) | USD 7.5 billion |
| Forecast Value in (2035F) | USD 16.3 billion |
| Forecast CAGR (2025 to 2035) | 8% |
The market holds 22% of the global agricultural inputs market, driven by its foundational role in crop production and biotechnology integration. It accounts for 18% of the global commercial seeds market, supported by extensive GMO adoption and precision agriculture technologies. The market contributes 66% to the North American seed treatment market through corn, soybean, and cotton applications. It represents 35% of precision farming market integration, where advanced seeds work with GPS-guided planting and data-driven management systems. The biotechnology agriculture share reaches 75%, reflecting the Americas' global leadership in GMO adoption with over 90% rates for major crops.
The market is undergoing structural change driven by accelerating consolidation among major seed companies, with the top five players controlling over 60% of global market share following mega-mergers like Bayer-Monsanto and ChemChina-Syngenta. Advanced breeding technologies using CRISPR gene editing, AI-powered trait discovery, and digital phenotyping have enhanced seed development timelines and precision, making biotechnology seeds increasingly competitive against conventional varieties. Manufacturers are introducing event-based approval mechanisms and regulatory streamlining for genetically modified seeds, expanding market access while maintaining biosafety standards under USDA-APHIS, EPA, and FDA coordinated frameworks
Seeds with proven biocompatibility with precision agriculture systems, yield enhancement capabilities, and climate adaptability are an essential foundation for modern farming operations across feed crops, food production, and biofuel applications. The Americas' extensive adoption of genetically modified crops, with over 90% adoption rates for corn, cotton, and soybeans in the USA, demonstrates the region's leadership in biotechnology integration for enhanced productivity. Growing awareness of food security challenges driven by population growth with global population projected to reach 9 billion by 2050 is further propelling adoption of high-yielding, climate-resilient seed varieties.
As the global agricultural industry continues to prioritize climate resilience and advanced delivery of nutrients through biofortified crops, the market outlook remains favorable. Agricultural biotechnology investments have enabled development of drought-tolerant corn yielding 20-30% more than conventional varieties in arid conditions, while Bt crops have reduced pest-related losses by 30-50%.
The market is segmented by type, trait, crop type, and region. By type, the market is bifurcated into GMO and conventional. Based on trait, the market is divided into herbicide tolerance, insecticide resistance, and others (disease resistance, drought tolerance, enhanced nutrition, cold tolerance, salinity tolerance, and improved shelf life). By crop type, the market is categorized into rice, soybean, and wheat. By country, the market is classified intoUnited States, Brazil, Argentina, Colombia, Chile, Paraguay, and Peru.
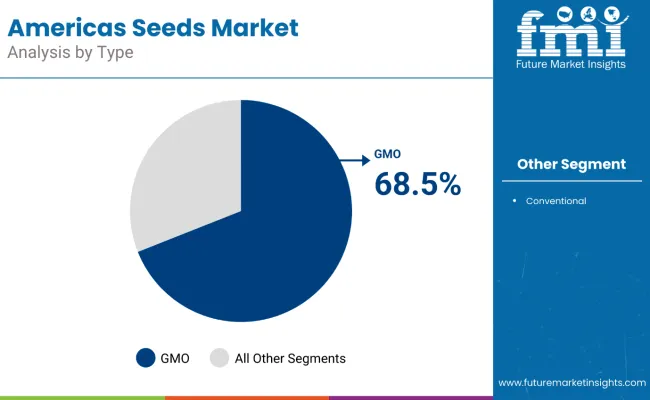
GMO represents the most lucrative segment in the market, commanding a dominant 68.5% market share. This segment's superior profitability stems from premium pricing advantages over conventional alternatives, as biotechnology seeds offer enhanced performance characteristics that justify higher selling prices. The segment benefits from multiple revenue streams including technology licensing fees and trait royalties that conventional seeds cannot capture. GMO seeds deliver superior farmer returns through higher yields, reduced pesticide applications, and improved crop protection, driving widespread adoption across major agricultural regions in the Americas.
Leading biotechnology companies achieve higher profitability margins from their GMO portfolios compared to conventional seed operations. The segment's growth trajectory remains robust, supported by continuous innovation in trait development, stacked gene combinations, and climate-resilient varieties. Strong intellectual property protection creates sustainable competitive advantages that maintain premium market positioning. Favorable regulatory environments and established farmer acceptance across the Americas further reinforce GMO seeds as the market's most profitable segment.
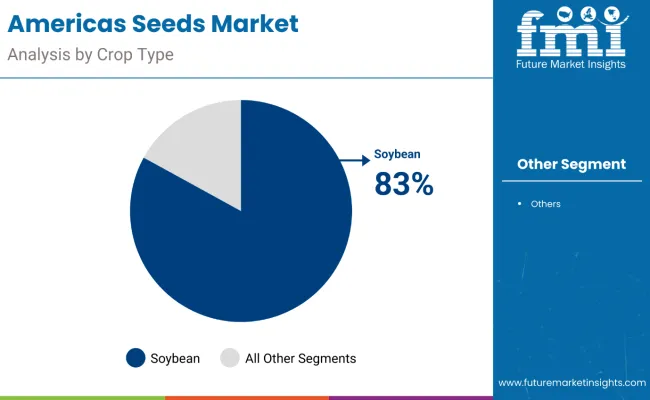
Soybeans represent the most lucrative segment in the market by crop type, commanding a dominant 83% market share. This segment's superior profitability stems from the Americas being the world’s largest soybean-producing region, with Brazil, Argentina, and the United States collectively accounting for the majority of global production. Soybean seeds benefit from strong market demand driven by protein meal requirements for livestock feed and vegetable oil consumption. The segment enjoys widespread adoption of biotechnology traits, with herbicide-tolerant and insect-resistant varieties delivering enhanced farmer productivity and simplified weed management.
Leading seed companies achieve higher margins from soybean varieties due to premium trait licensing opportunities and established breeding programs. The segment's growth trajectory remains robust, supported by expanding global protein demand, biofuel applications, and food processing industries. Strong export markets from the Americas to Asia and Europe create sustained demand for high-quality soybean varieties. Favorable growing conditions across diverse climate zones in North and South America reinforce soybeans as the market's most profitable crop segment.
From 2025 to 2035, agricultural companies adopted advanced biotechnology platforms and precision breeding technologies to improve crop yields, reduce pest losses, and enhance climate resilience. This shift positions seed suppliers offering high-performance, genetically enhanced varieties as key partners in supporting next-generation agricultural production and sustainable farming systems.
Rising Agricultural Innovation Drives Americas Seeds Market Growth
The steady increase in agricultural R&D investment and focus on climate-resilient crop varieties has been identified as the primary catalyst for growth in the Americas seeds market. In 2024, breakthrough developments in CRISPR gene editing and stacked trait technologies prompted agricultural companies globally to incorporate advanced biotechnology into innovative crop formulations. By 2025, seed manufacturers were expected to upgrade breeding systems with enhanced yield boosters and stress-tolerance traits to accommodate regulatory demands for improved agricultural productivity.
These developments indicate that consistent agricultural innovation, not short-term market trends, is fueling procurement cycles. Manufacturers that provide high-performance, biotechnology-enhanced seeds with proven field effectiveness are well-positioned to capture sustained demandfrom farmers and agricultural distributors.
Advanced Breeding System Integration Creates Market Expansion Opportunity
In 2025, seed companies began integrating precision agriculture platforms with biotechnology-based crop varieties to streamline farm management and improve agricultural outcomes, leading to reported improvements in yield performance and resource efficiency. By 2025, GMO formulations and trait-stacked systems were being embedded directly into crop development strategies, allowing real-time optimization of agricultural effectiveness and sustainability profiles.
These implementations demonstrate that when advanced breeding technologies are incorporated with precision agriculture systems, crop performance is significantly enhanced. Agricultural companies that adopt high-quality biotechnology seeds with proven yield enhancement capabilities are being positioned to gain competitive advantage, offering superior crop varieties with improved farmer outcomes and regulatory approval potential.
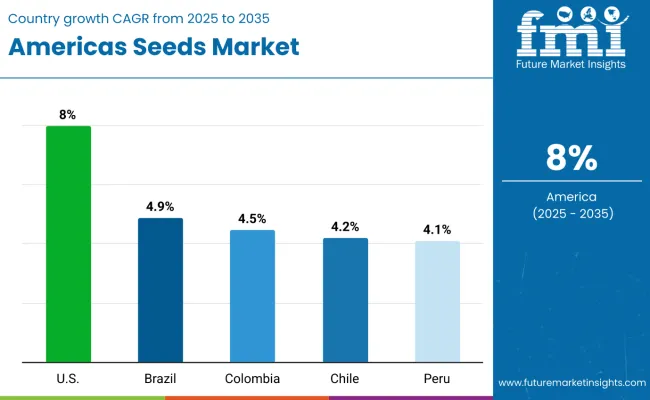
| Country | CAGR (2025-2035) |
|---|---|
| United States | 8% |
| Brazil | 4.9% |
| Colombia | 4.5% |
| Chile | 4.2% |
| Peru | 4.1% |
The United States demonstrates the highest growth trajectory with an 8% CAGR from 2025-2035, significantly outpacing other regional markets due to advanced biotechnology infrastructure, extensive R&D investments, and comprehensive GMO adoption rates for major crops. Brazil follows as the second-fastest growing market at 4.9% CAGR, driven by its position as the world's second-largest biotech crop producer and expanding agricultural area in key production regions. Colombia at 4.5% CAGR supported by government modernization initiatives, Chile at 4.2% CAGR leveraging its counter-season production advantage, and Peru at 4.1% CAGR focusing on native variety development and export-oriented agriculture.
Sales of Americas seeds in the USA are projected to grow at a CAGR of 8% from 2025 to 2035, driven by advanced biotechnology adoption and precision agriculture integration. With 99% GMO adoption for major crops like corn and soybeans, the country leads global seed innovation through extensive R&D investments exceeding USD 2 billion annually. Major seed companies maintain 85% of their global production capacity within the United States, leveraging sophisticated breeding facilities and advanced trait development programs. The country's agricultural infrastructure supports year-round seed production activities, from research trials to commercial-scale multiplication operations. Advanced digital agriculture platforms are increasingly integrated with seed technologies, enabling precision planting and data-driven crop management systems.
Revenue from Americas seeds in Brazil is projected to grow at a CAGR of 4.9% from 2025-2035, positioning the country as the world's second-largest biotech crop producer. The country's comprehensive regulatory framework through CTNBio has approved 131 plant biotechnology events, supporting both domestic production and global seed multiplication programs. Brazil's agricultural expansion has added 4.8 million hectares of biotech crops over the past five years, primarily in the Cerrado region. The country operates extensive counter-season production facilities, providing seeds for Northern Hemisphere markets during off-season periods. Strategic partnerships between multinational seed companies and local distributors have created robust supply chain networks reaching remote agricultural regions. EMBRAPA's research programs continue developing tropical-adapted varieties optimized for Brazilian growing conditions.
Demand for Americas seeds in Colombia is projected to grow at a CAGR of 4.5% from 2025-2035, supported by government initiatives promoting agricultural modernization and biotechnology adoption. Colombia's diverse geography and tropical climate create ideal conditions for cultivating various crop types, from traditional grains to specialty varieties. The country's agricultural transformation has accelerated through targeted government programs promoting hybrid seed adoption among smallholder farmers. Regional cooperatives have emerged as key distribution channels, providing technical assistance and financing support for seed purchases. Colombia's expanding palm oil and sugarcane industries have driven demand for specialized seed varieties optimized for commercial production. The Ministry of Agriculture has established seed certification programs ensuring quality standards across different crop categories. Growing integration with regional value chains has positioned Colombia as a key supplier for Central American and Caribbean markets.
Sales of Americas seeds in Chile are expected to grow at a CAGR of 4.2% from 2025 to 2035, driven byincreasing global demand for counter-season seed production, Chile’s favorable climatic conditions, and its position as the Southern Hemisphere’s largest GM seed exporter.Chile's regulatory framework allows confined cultivation of biotechnology seeds for research and multiplication purposes, making it attractive for international seed companies. The country's unique counter-season advantage enables year-round seed production cycles, maximizing facility utilization rates and production efficiency. Chilean operations serve as critical backup production sites for multinational companies, ensuring global supply chain resilience. Advanced research facilities in regions like Valparaíso and O'Higgins support new trait development and variety testing programs.
The Americas seeds market in Peru is projected to expand at a CAGR of 4.1% from 2025 to 2035, supported by increasing agricultural modernization and food security initiatives. The country's diverse agricultural zones from coastal to highland regions create opportunities for cultivating various crop types and developing climate-adapted varieties. Peru maintains significant agrobiodiversity, particularly in native potato and quinoa varieties, while gradually adopting improved hybrid seeds. The government's agricultural development programs have prioritized seed system strengthening through public-private partnerships and technical assistance programs. Peru's unique genetic resources provide opportunities for developing specialty crops with enhanced nutritional profiles and climate resilience characteristics. Export-oriented agricultural sectors, particularly asparagus and quinoa, have driven demand for certified seed varieties meeting international quality standards.
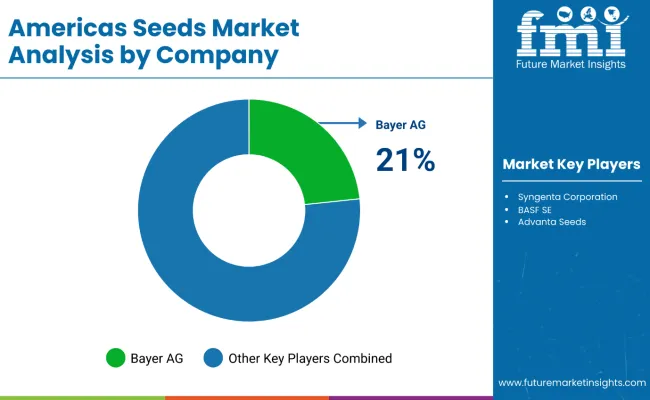
The market is highly consolidated, featuring established biotechnology companies with varying degrees of breeding expertise and trait development specialization. Bayer AG and Corteva Agriscience lead the biotechnology segment, supplying high-performance GMO seeds for major crop applications and advanced trait combinations. Their strength lies in sophisticated gene editing technologies and regulatory approval capabilities.
Syngenta Corporation differentiates through integrated crop protection solutions, including specialized seed treatments and trait stacking services that cater to precision agriculture and sustainable farming applications. BASF SE and Advanta Seeds focus on regional breeding programs and cost-effective seed production methods, addressing growing demand for locally-adapted varieties and conventional seeds in diverse agricultural environments.
Regional players such as local seed cooperatives and specialized breeding companies emphasize geographic market expertise and climate-specific varieties, ensuring agronomic performance and supply chain reliability for domestic farmers and agricultural distributors. Meanwhile, established chemical companies are investing in seed development capabilities to diversify their agricultural input portfolios and capture integrated crop management opportunities.
Entry barriers remain significant, driven by challenges in biotechnology platform development, regulatory approval requirements, and trait licensing costs across GMO and conventional applications. Competitiveness increasingly depends on trait portfolio breadth, regulatory compliance capabilities, and proven field performance profiles for diverse agricultural and environmental conditions. The consolidation in the market reflects the substantial R&D investments required for modern seed development, with leading companies spending hundreds of millions annually on breeding programs and biotechnology research.
Key Developments in the Americas Seeds Market
In December 2024, Bene Seeds Inc. and Johnny’s Selected Seeds launched two co-developed cherry tomato varieties, resulting from a multi-year collaboration. The new varieties, developed to enhance yield and flavor, reflect the companies’ commitment to high-quality, flavorful produce and strengthen their presence in the premium tomato market.
| Items | Values |
|---|---|
| Quantitative Units (2025) | USD 7.5 Billion |
| Type | GMO and Conventional |
| Crop Type | Soybean, Rice, and Wheat |
| Trait | Herbicide Tolerance, Insecticide Resistance, and Others (including disease resistance, drought tolerance, enhanced nutrition, cold tolerance, salinity tolerance, improved shelf life, enhanced oil content, improved protein content, nitrogen use efficiency, and fungal resistance) |
| Countries Covered | United States, Brazil, Argentina, Colombia, Chile, Paraguay, and Peru |
| Key Companies Prof iled | Bayer AG, BASF SE, Corteva Agriscience, Advanta Seeds, Syngenta Corporation, Rice Tec Inc., Limagrain, Florimond Desprez, AgReliant Genetics LLC, and SLC Agrícola. |
| Additional Attributes | Dollar sales by type and crop sector, growing adoption of biotechnology traits and precision agriculture applications for enhanced productivity and climate resilience, stable demand in sustainable farming and food security applications, innovations in gene editing technology and breeding methods improve yields, pest resistance, and regulatory compliance |
The global americas seeds market is estimated to be valued at USD 7.5 billion in 2025.
The market size for the americas seeds market is projected to reach USD 16.2 billion by 2035.
The americas seeds market is expected to grow at a 8.0% CAGR between 2025 and 2035.
The key product types in americas seeds market are gmo and conventional.
In terms of trait, herbicide tolerance segment to command 48.6% share in the americas seeds market in 2025.


Our Research Products

The "Full Research Suite" delivers actionable market intel, deep dives on markets or technologies, so clients act faster, cut risk, and unlock growth.

The Leaderboard benchmarks and ranks top vendors, classifying them as Established Leaders, Leading Challengers, or Disruptors & Challengers.

Locates where complements amplify value and substitutes erode it, forecasting net impact by horizon

We deliver granular, decision-grade intel: market sizing, 5-year forecasts, pricing, adoption, usage, revenue, and operational KPIs—plus competitor tracking, regulation, and value chains—across 60 countries broadly.

Spot the shifts before they hit your P&L. We track inflection points, adoption curves, pricing moves, and ecosystem plays to show where demand is heading, why it is changing, and what to do next across high-growth markets and disruptive tech

Real-time reads of user behavior. We track shifting priorities, perceptions of today’s and next-gen services, and provider experience, then pace how fast tech moves from trial to adoption, blending buyer, consumer, and channel inputs with social signals (#WhySwitch, #UX).

Partner with our analyst team to build a custom report designed around your business priorities. From analysing market trends to assessing competitors or crafting bespoke datasets, we tailor insights to your needs.
Supplier Intelligence
Discovery & Profiling
Capacity & Footprint
Performance & Risk
Compliance & Governance
Commercial Readiness
Who Supplies Whom
Scorecards & Shortlists
Playbooks & Docs
Category Intelligence
Definition & Scope
Demand & Use Cases
Cost Drivers
Market Structure
Supply Chain Map
Trade & Policy
Operating Norms
Deliverables
Buyer Intelligence
Account Basics
Spend & Scope
Procurement Model
Vendor Requirements
Terms & Policies
Entry Strategy
Pain Points & Triggers
Outputs
Pricing Analysis
Benchmarks
Trends
Should-Cost
Indexation
Landed Cost
Commercial Terms
Deliverables
Brand Analysis
Positioning & Value Prop
Share & Presence
Customer Evidence
Go-to-Market
Digital & Reputation
Compliance & Trust
KPIs & Gaps
Outputs
Full Research Suite comprises of:
Market outlook & trends analysis
Interviews & case studies
Strategic recommendations
Vendor profiles & capabilities analysis
5-year forecasts
8 regions and 60+ country-level data splits
Market segment data splits
12 months of continuous data updates
DELIVERED AS:
PDF EXCEL ONLINE
Americas Steel Pipes Market Size and Share Forecast Outlook 2025 to 2035
Americas COVID-19 Testing Market - Trends & Forecast 2025 to 2035
Flaxseeds Market – Growth, Demand & Nutritional Benefits
Citrus Seeds Market Size and Share Forecast Outlook 2025 to 2035
Hybrid Seeds Market Size and Share Forecast Outlook 2025 to 2035
Global Forage Seeds Market Size, Growth, and Forecast for 2025 to 2035
Industry Share Analysis for Sesame Seeds Companies
Caraway Seeds Market
Chamomile Seeds Market – Growth & Demand 2025 to 2035
Hybrid Rice Seeds Market Size and Share Forecast Outlook 2025 to 2035
Packaged Sunflower Seeds Market – Growth, Demand & Consumer Trends
Rubus Idaeus (Raspberry) Seeds Market

Thank you!
You will receive an email from our Business Development Manager. Please be sure to check your SPAM/JUNK folder too.
Chat With
MaRIA