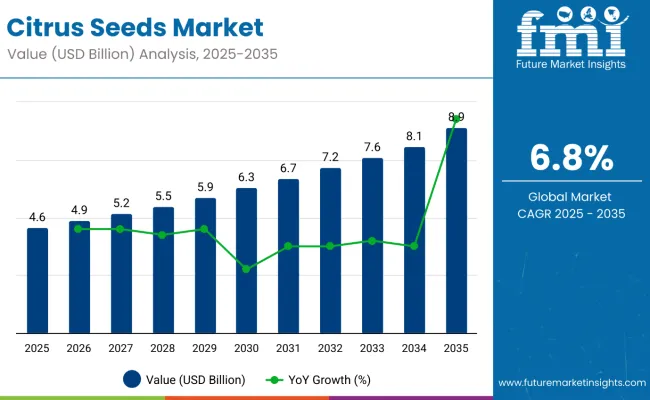
The citrus seeds market is estimated to be valued at USD 4.6 billion in 2025 and is projected to reach USD 8.9 billion by 2035, registering a compound annual growth rate (CAGR) of 6.8% over the forecast period.
| Metric | Value |
|---|---|
| Estimated Size (2025E) | USD 4.6 billion |
| Projected Value (2035F) | USD 8.9 billion |
| CAGR (2025 to 2035) | 6.8% |
The market is projected to add an absolute dollar opportunity of USD 4.3 billion over the forecast period, reflecting 1.93 times growth at a CAGR of 6.8%. The market evolution is expected to be shaped by increasing consumer awareness of plant-based health products, rising demand for dietary supplements, and expanding applications in cosmetics and oil extraction, particularly where natural antioxidants and clean-label ingredients are prioritized.
By 2030, the market is likely to reach USD 6.6 billion, accounting for USD 2.0 billion in incremental value over the first half of the decade. The remaining USD 2.3 billion is expected during the second half, suggesting a moderately back-loaded growth pattern. Product innovation in natural extraction processes and clean-label formulations is gaining traction due to the favorable antioxidant properties of citrus seeds and their versatile functional applications.
Companies such as Lemon Concentrate S.L. and Citrosuco S.A. are advancing their competitive positions through investment in advanced extraction technologies and scalable processing systems. Health-conscious consumer demand is supporting expansion into dietary supplements, cosmetics, and functional food applications. Market performance will remain anchored in natural ingredient efficacy, extraction innovation, and clean-label compliance benchmarks.
The market holds a notable share across multiple parent industries due to its functional and multipurpose use. Within the broader citrus products market, citrus seeds account for about 8%, primarily as a by-product. In the plant-based ingredients market, it holds around 3.5%, given its rising use in supplements and oils. In the nutraceutical ingredients market, citrus seeds account for a 4% share, driven by demand for antioxidant-rich components. In the natural cosmetics ingredients market, the share is 5%, thanks to its use in skincare oils. Though still emerging, the market is gaining traction across wellness, food, and cosmetic sectors.
The market is expected to benefit from advancements in cold-press oil extraction, eco-friendly packaging, and bioactive skincare formulations using citrus seed compounds. Regulatory initiatives in regions like the EU and Japan are encouraging the use of natural ingredients in food and cosmetics, providing a favorable environment for manufacturers. Additionally, increased R&D investments, such as the Evera division of Citrosuco focusing on responsible ingredient reuse, are likely to support long-term growth across both developed and emerging markets.
Citrus seeds' exceptional antioxidant properties, versatile applications, and natural origin make them an attractive ingredient for health-conscious consumers and manufacturers seeking clean-label, plant-based solutions for dietary supplements, cosmetics, and oil extraction industries.
Growing awareness of natural health products and functional ingredients is further propelling adoption, especially in nutraceuticals, personal care, and wellness sectors. The shift toward responsibly sourced and natural alternatives to synthetic ingredients, along with innovations in extraction and processing technologies, is also enhancing product quality and expanding application possibilities across diverse industries.
As wellness trends accelerate globally and clean-label preferences become critical, the market outlook remains highly favorable. With consumers and manufacturers prioritizing natural antioxidants, plant-based ingredients, and functional benefits, citrus seeds are well-positioned to expand across various food, cosmetic, pharmaceutical, and nutraceutical applications, driving sustained market growth through the forecast period.
The market is segmented by nature, application, sales channel, and region. By nature, the market is bifurcated into organic and conventional. By application, the market is divided into animal feed, oil extraction, dietary supplements, personal care & cosmetics, household/retail, and others (pharmaceutical and flavoring agents). Based on sales channel, the market is categorized into direct/b2b, modern trade, specialty store, online retailers, and others (convenience stores and wholesalers). Regionally, the market spans across North America, Latin America, Europe, Asia Pacific, and the Middle East & Africa.
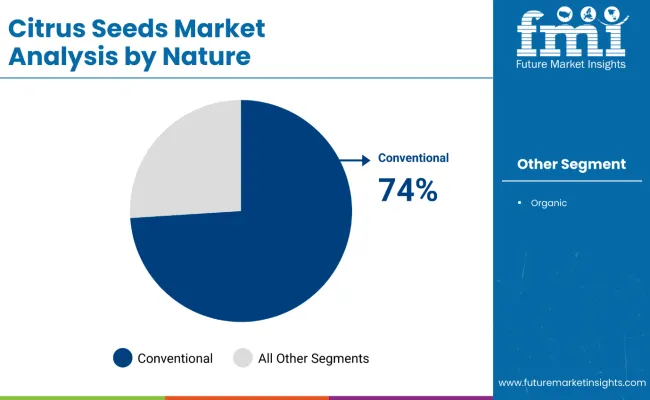
The conventional segment holds a dominant position with 74% of the market share in the nature category, owing to its cost-effectiveness, high yield potential, and widespread availability across global supply chains. Conventional citrus seeds are extensively utilized across bulk manufacturing sectors, including cosmetics, dietary supplements, and oil extraction, due to their standardized quality and robust production infrastructure.
They enable manufacturers to achieve competitive pricing while maintaining consistent output quality and meeting large-scale demand requirements. The conventional approach significantly reduces production costs through established farming practices and efficient processing methods, making it the preferred choice for both domestic and export markets.
Manufacturers continue to rely on conventional citrus seeds due to their proven supply chain reliability, standardized processing outcomes, and ability to support high-volume commercial applications. The segment remains well-positioned to maintain its dominance as global demand for citrus seed-based products continues to expand across diverse industrial applications.
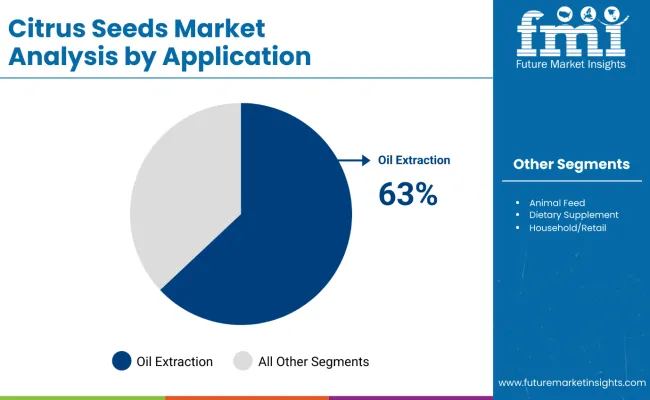
Oil extraction remains the leading application segment with 63% of the market share in 2025, as citrus seed oil delivers exceptional health benefits, including high antioxidant content, zero cholesterol properties, and versatile functionality across culinary and therapeutic applications. The oil’s rich ascorbic acid and folate profile makes it particularly valuable for heart health and specialized dietary needs.
Citrus seed oil has gained significant traction in cooking applications, especially among diabetic and cardiac patients, while simultaneously expanding into premium skincare formulations and pharmaceutical products. Its clean-label appeal and functional properties align perfectly with consumer preferences for natural, health-focused ingredients.
The segment benefits from strong international demand for high-value derivatives and continues to drive innovation in extraction technologies and product development. As consumers increasingly prioritize functional oils with proven health benefits, citrus seed oil extraction is positioned for sustained growth across multiple end-use industries.
In 2024, global citrus seed consumption grew by 8.1% year-on-year, with Asia-Pacific capturing a 40% market share. Applications include oil extraction, nutraceutical supplements, cosmetic formulations, and natural preservative development. Manufacturers are introducing advanced extraction technologies and multi-functional seed-based compounds that deliver superior antioxidant properties and processing versatility. Clean-label formulations now support transparent ingredient positioning. Health-conscious consumption trends and the efficacy of natural ingredients support consumer confidence. Technology providers increasingly supply ready-to-use seed extracts with integrated nutritional profiles to reduce formulation complexity.
Health and Wellness Trends Drive Citrus Seed Utilization
Food and cosmetic manufacturers are choosing citrus seed ingredients to achieve superior antioxidant content, enhance natural product profiles, and meet consumer demand for plant-based functional products. In nutritional testing, citrus seed oil demonstrates up to 62.5% efficacy in extraction applications, compared to 15-25% for synthetic alternatives. Products fortified with citrus seeds maintain stability throughout processing and storage cycles. In skincare formulations, citrus seed extracts help reduce ingredient complexity while maintaining efficacy by up to 45%. Citrus seed applications are increasingly used for clean-label positioning, driving adoption in sectors demanding natural ingredient enhancement. These advantages explain the rising utilization of citrus seeds across nutraceuticals, cosmetics, and food formulations in 2024.
Supply Chain Volatility, Extraction Complexity and Seasonal Constraints Restrict Expansion
Growth faces constraints due to citrus fruit price fluctuations, seasonal availability challenges, and specialized extraction infrastructure needs. Raw citrus processing costs can vary due to seasonal factors and regional supply conditions, impacting seed pricing and leading to procurement delays in industrial applications. Extraction processing technology requirements and quality control standards add complexity to product development cycles. Cold chain logistics and specialized storage conditions extend distribution costs by 15-20% compared to conventional botanical ingredients. Limited availability among extraction-capable processing facilities restricts scalable production, especially for custom formulation projects. These constraints make citrus seed adoption challenging in price-sensitive markets despite growing natural ingredient benefits and commercial interest.
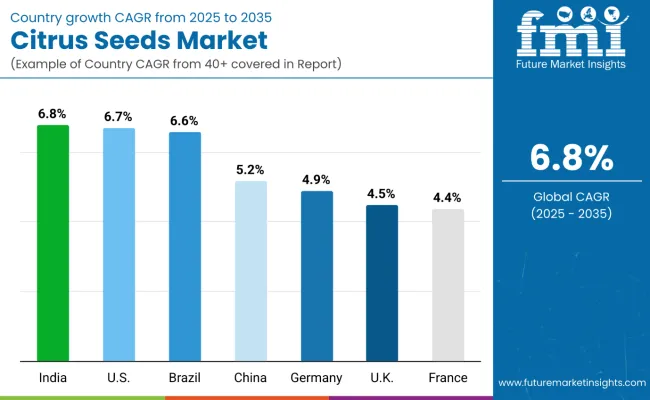
| Countries | CAGR (2025 to 2035) |
|---|---|
| India | 6.8% |
| USA | 6.7% |
| Brazil | 6.6% |
| China | 5.2% |
| Germany | 4.9% |
| UK | 4.5% |
| France | 4.4% |
The market shows varied growth trajectories across the top seven countries. India leads with the highest projected CAGR of 6.8% from 2025 to 2035, driven by expanding health consciousness and large-scale citrus production. The USA follows closely at 6.7%, supported by clean-label ingredient demand and nutraceutical applications. Brazil maintains strong growth at 6.6%, leveraging its position as a major citrus producer with significant export potential. China shows moderate growth at 5.2% due to market maturity, even though it is the world’s largest citrus producer. European markets demonstrate steady but lower growth rates, with Germany at 4.9%, the UK at 4.5%, and France at 4.4%, reflecting mature market dynamics focused on premium and organic applications.
The report covers an in-depth analysis of 40+ countries; seven top-performing OECD countries are highlighted below.
Revenue from citrus seeds in India is projected to grow at a CAGR of 6.8% from 2025 to 2035, driven by increasing awareness of natural health products, expanding ayurvedic medicine applications, and rising demand for plant-based dietary supplements across major states, including Maharashtra, Andhra Pradesh, and Punjab. Indian processors are investing in modern extraction technologies and organic certification processes to improve quality and meet international export standards.
Key Statistics
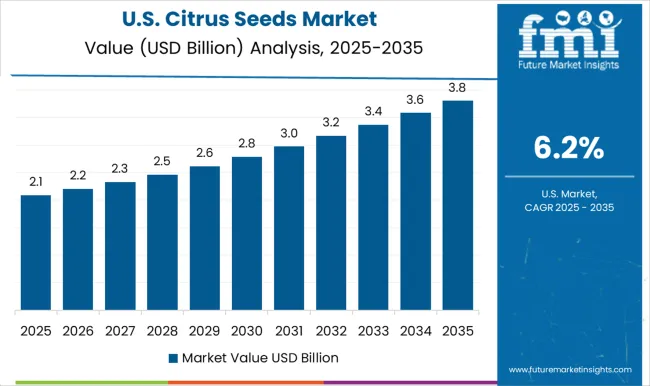
The citrus seeds market in the USA is projected to expand at a CAGR of 6.7% from 2025 to 2035, due to nutraceutical innovation and clean-label ingredient applications in California, Florida, and Texas regions. Advanced extraction technologies and responsibly managed processing methods are being deployed for dietary supplements, cosmetics, and functional food applications. FDA regulations and clean-label standards support practical citrus seed application development in high-value nutritional and cosmetic markets.
Key Statistics
Sales of citrus seeds in Brazil are expected to grow at a CAGR of 6.6% from 2025 to 2035, due to increasing export-oriented oil extraction and value-added processing in São Paulo, Minas Gerais, and Bahia regions. Citrus seed utilization is shifting from waste management toward high-value extraction and international trade. Domestic agricultural partnerships have strengthened, with increased collaboration between Brazilian citrus growers and international ingredient companies. Export regulations and Brazilian quality standards have improved citrus seed accessibility in global markets.
Key Statistics
Demand for citrus seeds in China is expected to grow at a CAGR of 5.2% from 2025 to 2035, driven by traditional medicine applications and growing health supplement markets in Guangdong, Sichuan, and Zhejiang provinces. Food ingredient manufacturers and traditional medicine companies are increasingly adopting citrus seeds for product enhancement and therapeutic applications. However, market growth is constrained by mature domestic markets and intense competition from established producers.
Key Statistics
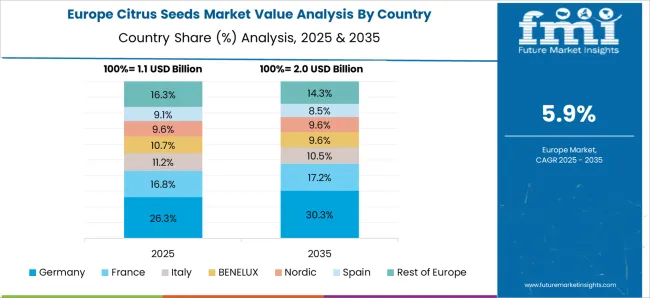
Sales of citrus seeds in Germany are expected to expand at a CAGR of 4.9% from 2025 to 2035, due to increasing applications of premium cosmetic and organic supplement development in Bavaria, North Rhine-Westphalia, and Baden-Württemberg regions. Advanced extraction technologies and responsibly managed processing methods are being deployed for high-end skincare, natural cosmetics, and organic supplement applications. Companies in Germany are focusing on quality certifications and responsible sourcing to meet stringent EU regulatory requirements.
Key Statistics
Revenue from citrus seeds in the UK is expected to grow at a CAGR of 4.5% from 2025 to 2035, driven by premium skincare and natural supplement markets in London, Manchester, and Birmingham regions. Health supplement manufacturers and cosmetic companies are increasingly adopting citrus seeds for product differentiation and natural ingredient positioning. However, growth is constrained by limited domestic processing capacity and reliance on imported raw materials post-Brexit.
Key Statistics
Sales of citrus seeds in France are expected to grow at a CAGR of 4.4% from 2025 to 2035, due to increasing applications of premium cosmetic and artisanal supplement production in the Paris, Lyon, and Marseille regions. Citrus seed adoption is shifting toward luxury skincare and specialized wellness products. Custom extraction services and specialized processing capabilities lead commercial citrus seed deployment in high-end applications. EU regulatory compliance and French quality standards have improved citrus seed accessibility in luxury and wellness markets.
Key Statistics
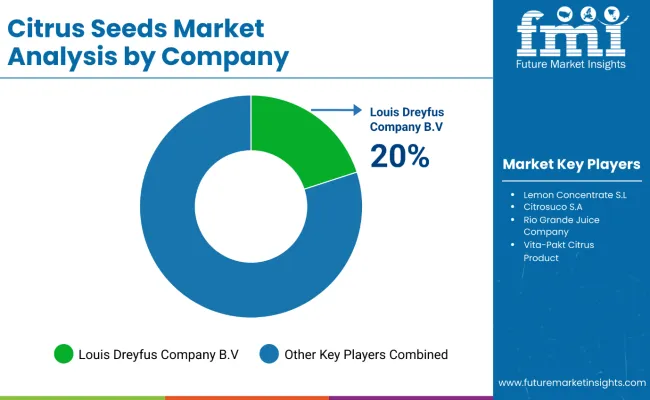
The market exhibits a moderately fragmented competitive landscape, featuring a blend of large-scale citrus processors, specialized ingredient companies, and regional agricultural cooperatives with varying degrees of extraction technology, product innovation, and application expertise. Louis Dreyfus Company B.V. and Citrosuco S.A. lead the market with comprehensive citrus processing capabilities, leveraging their established positions in citrus fruit processing to capitalize on seed valorization opportunities. Their competitive advantage stems from integrated supply chains, advanced extraction technologies, and strong relationships with global food manufacturers and cosmetic companies.
Lemon Concentrate S.L. and Sucocitrico Cutrale Ltd. differentiate through specialized seed processing technologies and custom extraction services targeting premium applications in nutraceuticals, cosmetics, and dietary supplements. Yantai North Andre Juice Co., Ltd. and The Wonderful Company, LLC focus on large-scale oil extraction and value-added processing, addressing growing demand from health supplement manufacturers and natural ingredient applications.
Regional players such as Dole Food Company Inc., Sunkist Growers Inc., and emerging companies like Citromax Group emphasize responsibly managed processing methods, organic certification, and clean-label positioning to capture premium market segments. Entry barriers remain significant due to requirements for advanced extraction technology, citrus supply chain integration, and compliance with food safety and cosmetic ingredient standards across multiple application categories. Competitiveness increasingly depends on extraction efficiency, product customization capabilities, and research and development expertise for diverse nutraceutical, cosmetic, and functional food applications.
| Items | Value |
|---|---|
| Quantitative Units (2025) | USD 4.6 billion |
| Nature | Organic and Conventional |
| Application | Animal Feed, Oil Extraction, Dietary Supplements, Personal Care and Cosmetics, Household/Retail, and Others |
| Sales Channel | Direct/B2B, Modern Trade, Specialty Store, Online Retailers, and Others |
| Regions Covered | North America, Latin America, Europe, East Asia, South Asia & Pacific, and the Middle East & Africa |
| Countries Covered | United States, Canada, United Kingdom, Germany, France, China, Japan, South Korea, Brazil, Australia and 40+ countries |
| Key Players | Lemon Concentrate S.L., Citrosuco S.A., Louis Dreyfus Company B.V., Yantai North Andre Juice Co. Ltd., Sucocitrico Cutrale Ltd., Citromax Group, Peace River Citrus Products, Rio Grande Juice Company, Vita-Pakt Citrus Products, Panteley Toshev Ltd, Tangshan Eusa Colors Int 'l Group (EUSA COLORS), Presque Isle Wine Cellars, and Parchem Trading Ltd. |
| Additional Attributes | Dollar sales by nature, application, and sales channel, regional demand trends, competitive landscape, consumer and farmer preferences for organic versus conventional seeds, integration with responsible sourcing practices, innovations in seed treatment and storage, and quality standardization across distribution channels |
The global citrus seeds market is estimated to be valued at USD 4.6 billion in 2025.
The market size for the citrus seeds market is projected to reach USD 8.6 billion by 2035.
The citrus seeds market is expected to grow at a 6.5% CAGR between 2025 and 2035.
The key product types in citrus seeds market are organic and conventional.
In terms of application, animal feed segment to command 44.6% share in the citrus seeds market in 2025.


Our Research Products

The "Full Research Suite" delivers actionable market intel, deep dives on markets or technologies, so clients act faster, cut risk, and unlock growth.

The Leaderboard benchmarks and ranks top vendors, classifying them as Established Leaders, Leading Challengers, or Disruptors & Challengers.

Locates where complements amplify value and substitutes erode it, forecasting net impact by horizon

We deliver granular, decision-grade intel: market sizing, 5-year forecasts, pricing, adoption, usage, revenue, and operational KPIs—plus competitor tracking, regulation, and value chains—across 60 countries broadly.

Spot the shifts before they hit your P&L. We track inflection points, adoption curves, pricing moves, and ecosystem plays to show where demand is heading, why it is changing, and what to do next across high-growth markets and disruptive tech

Real-time reads of user behavior. We track shifting priorities, perceptions of today’s and next-gen services, and provider experience, then pace how fast tech moves from trial to adoption, blending buyer, consumer, and channel inputs with social signals (#WhySwitch, #UX).

Partner with our analyst team to build a custom report designed around your business priorities. From analysing market trends to assessing competitors or crafting bespoke datasets, we tailor insights to your needs.
Supplier Intelligence
Discovery & Profiling
Capacity & Footprint
Performance & Risk
Compliance & Governance
Commercial Readiness
Who Supplies Whom
Scorecards & Shortlists
Playbooks & Docs
Category Intelligence
Definition & Scope
Demand & Use Cases
Cost Drivers
Market Structure
Supply Chain Map
Trade & Policy
Operating Norms
Deliverables
Buyer Intelligence
Account Basics
Spend & Scope
Procurement Model
Vendor Requirements
Terms & Policies
Entry Strategy
Pain Points & Triggers
Outputs
Pricing Analysis
Benchmarks
Trends
Should-Cost
Indexation
Landed Cost
Commercial Terms
Deliverables
Brand Analysis
Positioning & Value Prop
Share & Presence
Customer Evidence
Go-to-Market
Digital & Reputation
Compliance & Trust
KPIs & Gaps
Outputs
Full Research Suite comprises of:
Market outlook & trends analysis
Interviews & case studies
Strategic recommendations
Vendor profiles & capabilities analysis
5-year forecasts
8 regions and 60+ country-level data splits
Market segment data splits
12 months of continuous data updates
DELIVERED AS:
PDF EXCEL ONLINE
Citrus Molasses Market Size and Share Forecast Outlook 2025 to 2035
Citrus Pulp Fiber Market Size and Share Forecast Outlook 2025 to 2035
Citrus Oil Market Analysis - Size, Share, and Forecast Outlook 2025 to 2035
Citrus Gummies Market Analysis - Flavor Trends & Growth 2025 to 2035
Citrus Fiber Market Trends - Functional Applications & Growth 2025 to 2035
Citrus Pectin Market Size, Growth, and Forecast for 2025 to 2035
Citrus Crop Nutrition Market Analysis by Product Type, Application, Sustainability Practices, and Regional Forecast from 2025 to 2035
Citrus Yogurt Market Insights – Flavor Trends & Consumer Demand 2025 to 2035
Citrus Pulp Market Analysis - Trends & Growth Forecast 2025 to 2035
Citrus Water Market Trends – Growth & Consumer Insights 2025 to 2035
Citrus Flavors Market Report – Trends & Innovations 2025 to 2035
Citrus Solvents Market Insights Trends & Forecast 2025 to 2035
Citrus Alcohol Market Trends - Flavor Innovations & Demand 2025 to 2035
Citrus Powder Market Outlook – Growth, Demand & Forecast 2024 to 2034
Citrus Aurantium Extract Market – Growth, Applications & Industry Trends
Citrus bioflavonoid Market
Flaxseeds Market – Growth, Demand & Nutritional Benefits
Hybrid Seeds Market Size and Share Forecast Outlook 2025 to 2035
Global Forage Seeds Market Size, Growth, and Forecast for 2025 to 2035
Industry Share Analysis for Sesame Seeds Companies

Thank you!
You will receive an email from our Business Development Manager. Please be sure to check your SPAM/JUNK folder too.
Chat With
MaRIA